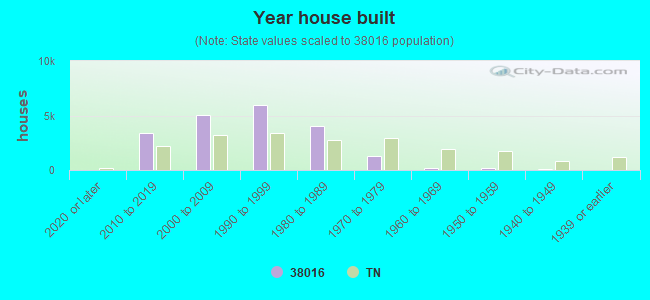
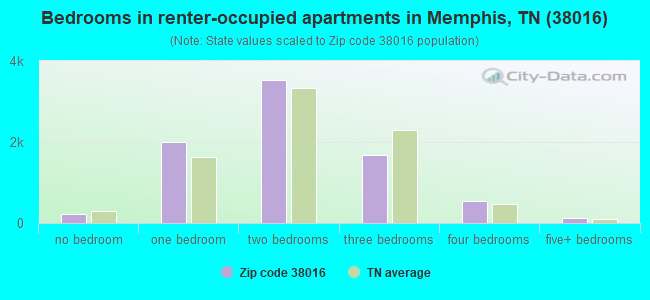
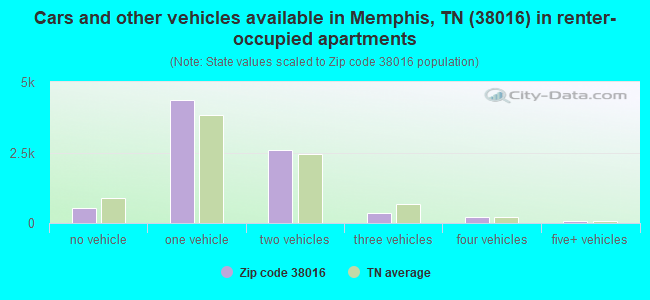
Houses and condos: 20,679 Renter-occupied apartments: 8,081
% of renters here:
41%
State:
33%
March 2022 cost of living index in zip code 38016: 82.0 (low, U.S. average is 100)
Land area: 19.1 sq. mi. Water area: 0.0 sq. mi.
Population density: 2,473 people per square mile
(low).
OSM Map
Google Map
MSN Map
OSM Map
General Map
Google Map
MSN Map
OSM Map
Google Map
MSN Map
OSM Map
Google Map
MSN Map
Please wait while loading the map...
Real estate property taxes paid for housing units in 2022:
This zip code:
0.9% ($2,654)
Tennessee:
0.5% ($1,376)
Median real estate property taxes paid for housing units with mortgages in 2022: $2,601 (0.9%) Median real estate property taxes paid for housing units with no mortgage in 2022: $3,053 (1.1%)
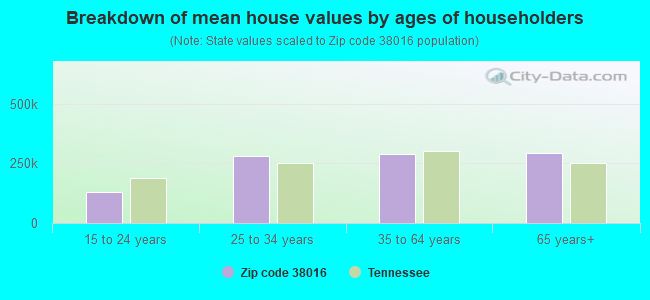
Estimated median house/condo value in 2022: $284,923
38016:
$284,923
Tennessee:
$284,800
According to our research of Tennessee and other state lists, there were 62 registered sex offenders living in 38016 zip code as of May 03, 2024. The ratio of all residents to sex offenders in zip code 38016 is 765 to 1. The ratio of registered sex offenders to all residents in this zip code is lower than the state average.
Median resident age:
This zip code:
34.5 years
Tennessee median age:
39.2 years
Average household size:
This zip code:
2.4 people
Tennessee:
2.4 people
Averages for the 2020 tax year for zip code 38016, filed in 2021:
Average Adjusted Gross Income (AGI) in 2020: $56,469 (Individual Income Tax Returns)
Here:
$56,469
State:
$69,014
Salary/wage: $52,592 (reported on 85.4% of returns)
Here:
$52,592
State:
$55,872
(% of AGI for various income ranges: 1345.3% for AGIs below $25k, 4033.2% for AGIs $25k-50k, 7338.7% for AGIs $50k-75k, 10761.8% for AGIs $75k-100k, 19120.7% for AGIs $100k-200k, 59465.8% for AGIs over 200k)
Taxable interest for individuals: $1,093 (reported on 17.4% of returns)
This zip code:
$1,093
Tennessee:
$1,945
(% of AGI for various income ranges: 6.5% for AGIs below $25k, 8.0% for AGIs $25k-50k, 18.4% for AGIs $50k-75k, 36.5% for AGIs $75k-100k, 85.1% for AGIs $100k-200k, 743.2% for AGIs over 200k)
Ordinary dividends: $4,333 (reported on 10.7% of returns)
Here:
$4,333
State:
$8,105
(% of AGI for various income ranges: 9.9% for AGIs below $25k, 11.9% for AGIs $25k-50k, 43.8% for AGIs $50k-75k, 72.6% for AGIs $75k-100k, 192.2% for AGIs $100k-200k, 2444.7% for AGIs over 200k)
Net capital gain/loss in AGI: +$12,523 (reported on 10.2% of returns)
Here:
+$12,523
State:
+$33,664
(% of AGI for various income ranges: 3.7% for AGIs below $25k, 11.1% for AGIs $25k-50k, 39.8% for AGIs $50k-75k, 105.8% for AGIs $75k-100k, 356.9% for AGIs $100k-200k, 11488.9% for AGIs over 200k)
Profit/loss from business: +$3,496 (reported on 23.8% of returns)
Here:
+$3,496
State:
+$18,991
(% of AGI for various income ranges: 47.4% for AGIs $50k-75k, 165.8% for AGIs $75k-100k, 886.1% for AGIs $100k-200k, 4398.9% for AGIs over 200k)
Taxable individual retirement arrangement distribution: $17,751 (reported on 5.8% of returns)
38016:
$17,751
Tennessee:
$20,036
(% of AGI for various income ranges: 30.0% for AGIs below $25k, 52.9% for AGIs $25k-50k, 108.9% for AGIs $50k-75k, 243.3% for AGIs $75k-100k, 576.0% for AGIs $100k-200k, 2406.8% for AGIs over 200k)
Self-employed (Keogh) retirement plans: $21,325 (reported on 0.3% of returns)
38016:
$21,325
Tennessee:
$28,955
(% of AGI for various income ranges: 48.6% for AGIs $100k-200k, 521.6% for AGIs over 200k)
Total itemized deductions: $29,171 (reported on 9.8% of returns)
Here:
$29,171
State:
$40,136
(% of AGI for various income ranges: 52.2% for AGIs below $25k, 204.4% for AGIs $25k-50k, 491.7% for AGIs $50k-75k, 820.3% for AGIs $75k-100k, 1221.6% for AGIs $100k-200k, 4893.2% for AGIs over 200k)
Charity contributions: $11,886 (reported on 9.0% of returns)
Here:
$11,886
State:
$19,852
(% of AGI for various income ranges: 9.1% for AGIs below $25k, 56.9% for AGIs $25k-50k, 159.2% for AGIs $50k-75k, 307.7% for AGIs $75k-100k, 523.7% for AGIs $100k-200k, 2625.3% for AGIs over 200k)
Taxes paid: $5,440 (reported on 9.3% of returns)
38016:
$5,440
State:
$6,038
(% of AGI for various income ranges: 8.0% for AGIs below $25k, 34.9% for AGIs $25k-50k, 88.6% for AGIs $50k-75k, 151.9% for AGIs $75k-100k, 232.0% for AGIs $100k-200k, 774.2% for AGIs over 200k)
Earned income credit: $2,430 (reported on 19.1% of returns)
Here:
$2,430
State:
$2,391
(% of AGI for various income ranges: 119.9% for AGIs below $25k, 72.2% for AGIs $25k-50k, 0.7% for AGIs $50k-75k)
Percentage of individuals using paid preparers for their 2020 taxes: 92.2%
Here:
92%
State:
93%
(% for various income ranges: 92.5% for AGIs below $25k, 92.7% for AGIs $25k-50k, 91.9% for AGIs $50k-75k, 91.9% for AGIs $75k-100k, 90.6% for AGIs $100k-200k, 90.6% for AGIs over 200k)
Averages for the 2012 tax year for zip code 38016, filed in 2013:
Average Adjusted Gross Income (AGI) in 2012: $56,777 (Individual Income Tax Returns)
Here:
$56,777
State:
$53,767
Salary/wage: $52,332 (reported on 88.1% of returns)
Here:
$52,332
State:
$45,421
(% of AGI for various income ranges: 82.4% for AGIs below $25k, 88.8% for AGIs $25k-50k, 85.5% for AGIs $50k-75k, 82.6% for AGIs $75k-100k, 81.2% for AGIs $100k-200k, 67.1% for AGIs over 200k)
Taxable interest for individuals: $1,298 (reported on 23.6% of returns)
This zip code:
$1,298
Tennessee:
$1,732
(% of AGI for various income ranges: 0.6% for AGIs below $25k, 0.3% for AGIs $25k-50k, 0.3% for AGIs $50k-75k, 0.4% for AGIs $75k-100k, 0.4% for AGIs $100k-200k, 1.3% for AGIs over 200k)
Ordinary dividends: $4,106 (reported on 13.7% of returns)
Here:
$4,106
State:
$6,739
(% of AGI for various income ranges: 1.2% for AGIs below $25k, 0.6% for AGIs $25k-50k, 0.5% for AGIs $50k-75k, 0.6% for AGIs $75k-100k, 0.8% for AGIs $100k-200k, 2.5% for AGIs over 200k)
Net capital gain/loss in AGI: +$8,067 (reported on 11.2% of returns)
Here:
+$8,067
State:
+$19,082
(% of AGI for various income ranges: 0.2% for AGIs $50k-75k, 0.3% for AGIs $75k-100k, 0.9% for AGIs $100k-200k, 7.6% for AGIs over 200k)
Profit/loss from business: +$10,183 (reported on 17.7% of returns)
Here:
+$10,183
State:
+$15,240
(% of AGI for various income ranges: 5.9% for AGIs below $25k, 1.0% for AGIs $25k-50k, 2.0% for AGIs $50k-75k, 2.5% for AGIs $75k-100k, 3.3% for AGIs $100k-200k, 5.8% for AGIs over 200k)
Taxable individual retirement arrangement distribution: $15,129 (reported on 7.3% of returns)
38016:
$15,129
Tennessee:
$15,505
(% of AGI for various income ranges: 2.1% for AGIs below $25k, 1.4% for AGIs $25k-50k, 1.7% for AGIs $50k-75k, 2.1% for AGIs $75k-100k, 2.5% for AGIs $100k-200k, 1.7% for AGIs over 200k)
Self-employment retirement plans: $17,522 (reported on 0.4% of returns)
38016:
$17,522
Tennessee:
$22,567
(% of AGI for various income ranges: 0.2% for AGIs $100k-200k, 0.4% for AGIs over 200k)
Total itemized deductions: $21,088 (23% of AGI, reported on 37.3% of returns)
Here:
$21,088
State:
$21,976
Here:
23.0% of AGI
State:
17.8% of AGI
(% of AGI for various income ranges: 10.1% for AGIs below $25k, 13.3% for AGIs $25k-50k, 15.8% for AGIs $50k-75k, 17.8% for AGIs $75k-100k, 13.3% for AGIs $100k-200k, 11.6% for AGIs over 200k)
Charity contributions: $5,529 (reported on 32.5% of returns)
Here:
$5,529
State:
$6,709
(% of AGI for various income ranges: 1.5% for AGIs below $25k, 2.5% for AGIs $25k-50k, 3.3% for AGIs $50k-75k, 3.2% for AGIs $75k-100k, 3.6% for AGIs $100k-200k, 3.7% for AGIs over 200k)
Taxes paid: $4,700 (reported on 36.6% of returns)
38016:
$4,700
State:
$4,829
(% of AGI for various income ranges: 1.9% for AGIs below $25k, 2.7% for AGIs $25k-50k, 3.5% for AGIs $50k-75k, 3.3% for AGIs $75k-100k, 3.4% for AGIs $100k-200k, 2.6% for AGIs over 200k)
Earned income credit: $2,358 (reported on 18.4% of returns)
Here:
$2,358
State:
$2,404
(% of AGI for various income ranges: 7.8% for AGIs below $25k, 1.1% for AGIs $25k-50k)
Percentage of individuals using paid preparers for their 2012 taxes: 44.9%
Here:
45%
State:
52%
(% for various income ranges: 44.1% for AGIs below $25k, 42.4% for AGIs $25k-50k, 44.8% for AGIs $50k-75k, 44.8% for AGIs $75k-100k, 48.1% for AGIs $100k-200k, 65.5% for AGIs over 200k)
Averages for the 2004 tax year for zip code 38016, filed in 2005:
Average Adjusted Gross Income (AGI) in 2004: $58,078 (Individual Income Tax Returns)
Here:
$58,078
State:
$44,088
Salary/wage: $53,881 (reported on 89.6% of returns)
Here:
$53,881
State:
$38,825
(% of AGI for various income ranges: 190.9% for AGIs below $10k, 82.5% for AGIs $10k-25k, 88.0% for AGIs $25k-50k, 86.0% for AGIs $50k-75k, 87.7% for AGIs $75k-100k, 77.0% for AGIs over 100k)
Taxable interest for individuals: $1,227 (reported on 37.9% of returns)
This zip code:
$1,227
Tennessee:
$1,802
(% of AGI for various income ranges: 5.6% for AGIs below $10k, 1.8% for AGIs $10k-25k, 0.9% for AGIs $25k-50k, 0.7% for AGIs $50k-75k, 0.6% for AGIs $75k-100k, 0.7% for AGIs over 100k)
Taxable dividends: $2,302 (reported on 21.8% of returns)
Here:
$2,302
State:
$3,727
(% of AGI for various income ranges: 6.1% for AGIs below $10k, 1.1% for AGIs $10k-25k, 0.6% for AGIs $25k-50k, 0.7% for AGIs $50k-75k, 0.6% for AGIs $75k-100k, 1.0% for AGIs over 100k)
Net capital gain/loss: +$10,816 (reported on 19.1% of returns)
Here:
+$10,816
State:
+$15,776
(% of AGI for various income ranges: -1.2% for AGIs below $10k, -0.1% for AGIs $10k-25k, 0.2% for AGIs $25k-50k, 0.4% for AGIs $50k-75k, 0.6% for AGIs $75k-100k, 7.7% for AGIs over 100k)
Profit/loss from business: +$13,756 (reported on 15.8% of returns)
Here:
+$13,756
State:
+$12,882
(% of AGI for various income ranges: -6.1% for AGIs below $10k, 5.5% for AGIs $10k-25k, 2.4% for AGIs $25k-50k, 3.1% for AGIs $50k-75k, 3.1% for AGIs $75k-100k, 4.7% for AGIs over 100k)
IRA payment deduction: $2,985 (reported on 2.4% of returns)
38016:
$2,985
Tennessee:
$2,934
(% of AGI for various income ranges: 0.2% for AGIs $10k-25k, 0.2% for AGIs $25k-50k, 0.1% for AGIs $50k-75k, 0.1% for AGIs $75k-100k, 0.1% for AGIs over 100k)
Self-employed pension: $13,321 (reported on 0.8% of returns)
Here:
$13,321
Tennessee:
$16,857
(% of AGI for various income ranges: 0.0% for AGIs $25k-50k, 0.1% for AGIs $50k-75k, 0.1% for AGIs $75k-100k, 0.4% for AGIs over 100k)
Total itemized deductions: $18,659 (21% of AGI, reported on 46.9% of returns)
Here:
$18,659
State:
$18,035
Here:
20.7% of AGI
State:
19.9% of AGI
(% of AGI for various income ranges: 27.1% for AGIs below $10k, 11.3% for AGIs $10k-25k, 15.8% for AGIs $25k-50k, 17.6% for AGIs $50k-75k, 17.5% for AGIs $75k-100k, 13.2% for AGIs over 100k)
Charity contributions deductions: $4,309 (5% of AGI, reported on 41.7% of returns)
Here:
$4,309
State:
$5,167
Here:
4.6% of AGI
State:
5.3% of AGI
(% of AGI for various income ranges: 1.7% for AGIs below $10k, 1.5% for AGIs $10k-25k, 2.4% for AGIs $25k-50k, 3.0% for AGIs $50k-75k, 3.3% for AGIs $75k-100k, 3.5% for AGIs over 100k)
Total tax: $9,039 (reported on 82.0% of returns)
38016:
$9,039
State:
$7,482
(% of AGI for various income ranges: 4.9% for AGIs below $10k, 4.6% for AGIs $10k-25k, 7.5% for AGIs $25k-50k, 9.5% for AGIs $50k-75k, 10.7% for AGIs $75k-100k, 17.9% for AGIs over 100k)
Earned income credit: $1,660 (reported on 9.6% of returns)
Here:
$1,660
State:
$1,826
Percentage of individuals using paid preparers for their 2004 taxes: 48.0%
Here:
48%
State:
60%
(% for various income ranges: 40.0% for AGIs below $10k, 50.3% for AGIs $10k-25k, 47.0% for AGIs $25k-50k, 49.7% for AGIs $50k-75k, 46.2% for AGIs $75k-100k, 54.6% for AGIs over 100k)
Likely homosexual households (counted as self-reported same-sex unmarried-partner households)
Lesbian couples: 0.1% of all households
Gay men: 0.3% of all households
Household received Food Stamps/SNAP in the past 12 months: 1,393 Household did not receive Food Stamps/SNAP in the past 12 months: 18,187
Women who had a birth in the past 12 months: 357 (265 now married, 94 unmarried) Women who did not have a birth in the past 12 months: 12,402 (4,576 now married, 7,824 unmarried)
Housing units in zip code 38016 with a mortgage: 9,039 (738 second mortgage, 606 both second mortgage and home equity loan) Houses without a mortgage: 178
Median monthly owner costs for units with a mortgage: $1,647 Median monthly owner costs for units without a mortgage: $671
Residents with income below the poverty level in 2022:
This zip code:
8.9%
Whole state:
13.3%
Residents with income below 50% of the poverty level in 2022:
This zip code:
3.7%
Whole state:
7.1%
Median number of rooms in houses and condos:
Here:
7.1
State:
6.5
Median number of rooms in apartments:
Here:
4.3
State:
4.4
Notable locations in this zip code not listed on our city pages
Notable locations in zip code 38016: Patricia Shaw Pumping Station Water Treatment Plant (A), City of Memphis Division of Fire Station 58 (B), City of Memphis Division of Fire Station 59 (C). Display/hide their locations on the map
Reservoirs: Fisher Lake (A), Colonial Country Club Sixteenth Hole Lake (B), Great American Mortgage Lake (C), Guymon Lake (D). Display/hide their locations on the map
In group quarters: 101 (-1 institutionalized population)
Size of family households: 5,452 2-persons, 3,066 3-persons, 2,043 4-persons, 765 5-persons, 525 6-persons, 158 7-or-more-persons
Size of nonfamily households: 6,243 1-person, 1,117 2-persons, 140 3-persons
6,516 married couples with children.
2,631 single-parent households (492 men, 2,139 women).
87.6% of residents of 38016 zip code speak English at home.
4.2% of residents speak Spanish at home (57% very well, 27% well, 11% not well, 5% not at all).
0.8% of residents speak other Indo-European language at home (76% very well, 23% well, 1% not well).
5.8% of residents speak Asian or Pacific Island language at home (38% very well, 19% well, 42% not well, 1% not at all).
1.8% of residents speak other language at home (85% very well, 15% well).
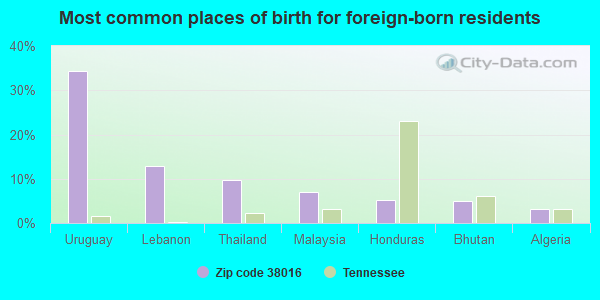
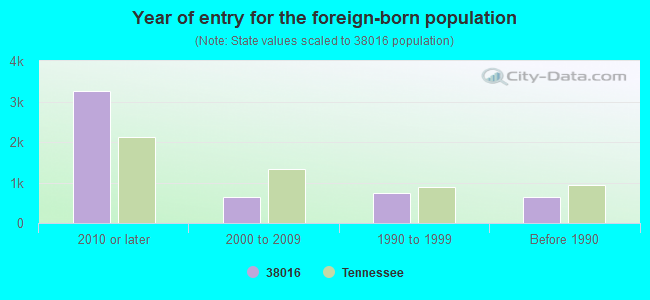
Foreign born population: 4,509 (9.5%) (37.8% of them are naturalized citizens)
This zip code:
9.5%
Whole state:
5.6%
34%Uruguay
13%Lebanon
10%Thailand
7%Malaysia
5%Honduras
5%Bhutan
3%Algeria
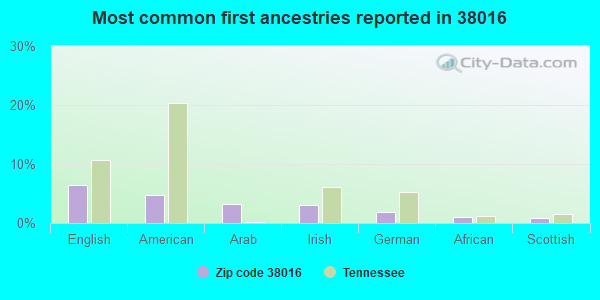
6%English
5%American
3%Arab
3%Irish
2%German
1%African
1%Scottish
Year of entry for the foreign-born population
3,2492010 or later
6442000 to 2009
7521990 to 1999
643Before 1990
Public high school in in zip code 38016 not listed on the city page:
CORDOVA HIGH SCHOOL(Students: 2,179, Location: 1800 BERRYHILL RD, Grades: 9-12)
Public elementary/middle schools in in zip code 38016 not listed on the city page:
Housing units lacking complete plumbing facilities: 0.0% Housing units lacking complete kitchen facilities: 0.6%
55.6%Electricity
41.5%Utility gas
2.0%Bottled, tank, or LP gas
Place of birth for U.S.-born residents:
This state: 25,084
Northeast: 1,883
Midwest: 3,729
South: 10,202
West: 1,352
88% of the 38016 zip code residents lived in the same house 1 year ago. Out of people who lived in different houses, 70% moved from this county. Out of people who lived in different houses, 9% moved from different county within same state. Out of people who lived in different houses, 13% moved from different state. Out of people who lived in different houses, 4% moved from abroad.
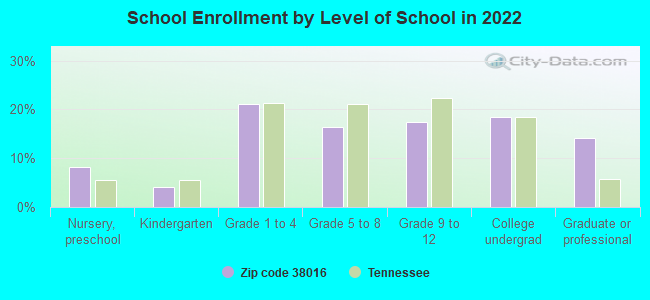
Private vs. public school enrollment:
Students in private schools in grades 1 to 8 (elementary and middle school): 1,163
Here:
23.9%
Tennessee:
15.0%
Students in private schools in grades 9 to 12 (high school): 504
Here:
22.3%
Tennessee:
16.2%
Students in private undergraduate colleges: 395
Here:
16.6%
Tennessee:
23.5%
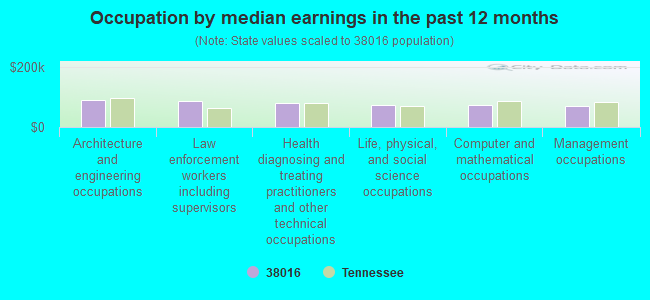
Occupation by median earnings in the past 12 months ($)
91,103Architecture and engineering occupations
85,717Law enforcement workers including supervisors
80,789Health diagnosing and treating practitioners and other technical occupations
74,492Life, physical, and social science occupations
72,065Computer and mathematical occupations
71,123Management occupations
Companies with federal contracts located in this zip code (CORDOVA, TN):
SECURITY SIGNALS, INC (9509 MACON RD; small business) : $68,079,592 in 44 contractsfrom 2000 to 2006
Contracts for Pyrotechnics by Army Signed by year:2000: $4,383,816; 2001: $6,411,810; 2002: $10,300,189; 2003: $17,733,681; 2004: $13,640,576; 2005: $8,527,650; 2006: $7,081,870.
Biggest contracts:
$8,856,870 with Army for Pyrotechnics. Signed on 2002-05-03. Completion date: 2003-02-28.
$7,572,357, same as above.Signed on 2003-09-05. Completion date: 2005-12-30.
$7,378,189, same as above.Signed on 2003-09-25. Completion date: 2005-12-30.
$6,956,562, same as above.Signed on 2006-03-28. Completion date: 2010-12-31.
STEVEN PEARSON CONTRACTING (1471 TEAL WING CV; small business) : $31,824 in 5 contractsfrom 2005 to 2006
Contracts for Technical Assistance by Army Signed by year:2000: $0; 2001: $0; 2002: $0; 2003: $0; 2004: $0; 2005: $21,742; 2006: $10,082.
Biggest contracts:
$9,488 with Army for Technical Assistance. Taking place in MS. Signed on 2005-08-22. Completion date: 2005-09-30.
$8,576, same as above.Signed on 2005-02-24. Completion date: 2005-09-30.
$6,416, same as above.Signed on 2006-05-08. Completion date: 2006-05-31.
$3,678, same as above.Signed on 2005-12-28. Completion date: 2006-05-31.
TRUCKPRO INC (8110 CORDOVA RD STE 116) : $16,632 in 4 contractsfrom 2003 to 2005
$10,808 with Army for Miscellaneous Vehicular Components. Taking place in OK. Signed on 2003-03-04. Completion date: 2003-03-12.
$6,005 with Army for Maintenance, Repair and Rebuilding of Equipment -- Ground Effect Vehicles, Motor Vehicles, Trailers, and Cycles. Taking place in AR. Signed on 2005-09-10. Completion date: 2005-09-30.
$0, same as above.Signed on 2005-10-27. Completion date: 2005-10-28.
-$181, same as above.Signed on 2005-10-27. Completion date: 2005-10-28.
AVA FINE DESIGNS, INC (1752 DARTFORD DRIVE; small business) : $9,774 in 2 contractsin 2004
$4,887 with U.S. Army Corps of Engineers - civil program financing only for Office Furniture. Taking place in KY. Signed on 2004-03-04. Completion date: 2004-03-31.
$4,887 with Army for Office Furniture. Taking place in KY. Signed on 2004-03-04. Completion date: 2004-03-31.
R & R STRIPING (1841 E PHEASANT ACRE LANE; small business)
$9,200 with Navy for Maintenance, Repair or Alteration of Real Property -- Other Utilities. Signed on 2004-09-29. Completion date: 2004-11-28.
Top industries in this zip code by the number of employees in 2005:
Educational Services: Colleges, Universities, and Professional Schools (100-249: 1)
Fatal accident statistics in 2014:
Fatal accident count: 3
Vehicles involved in fatal accidents: 6
Fatal accidents caused by drunken drivers: 0
Fatalities: 3
Persons involved in fatal accidents: 9
Pedestrians involved in fatal accidents: 0
Fatal accident statistics in 2013:
Fatal accident count: 1
Vehicles involved in fatal accidents: 1
Fatal accidents caused by drunken drivers: 0
Fatalities: 1
Persons involved in fatal accidents: 1
Pedestrians involved in fatal accidents: 0
2002 - 2018 National Fire Incident Reporting System (NFIRS) incidents
According to the data from the years 2002 - 2018 the average number of fires per year is 67. The highest number of fires - 97 took place in 2017, and the least - 17 in 2004. The data has a rising trend.
When looking into fire subcategories, the most incidents belonged to: Structure Fires (46.6%), and Outside Fires (32.6%).
Fire incident types reported to NFIRS in Zip Code 38016


 (Students: 2,179, Location: 1800 BERRYHILL RD, Grades: 9-12)
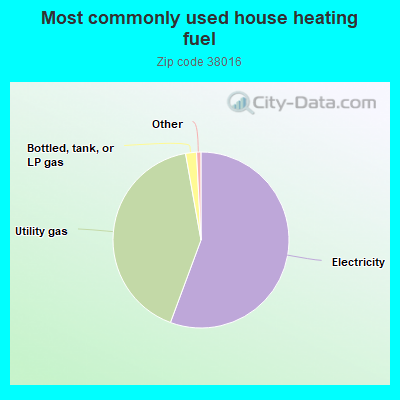
 According to the data from the years 2002 - 2018 the average number of fires per year is 67. The highest number of fires - 97 took place in 2017, and the least - 17 in 2004. The data has a rising trend.
 When looking into fire subcategories, the most incidents belonged to: Structure Fires (46.6%), and Outside Fires (32.6%).