Estimated zip code population in 2022: 39,044 Zip code population in 2010: 35,059 Zip code population in 2000: 52,710
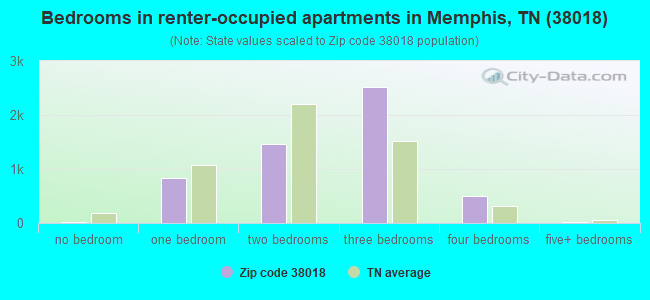
Houses and condos: 15,117 Renter-occupied apartments: 5,403
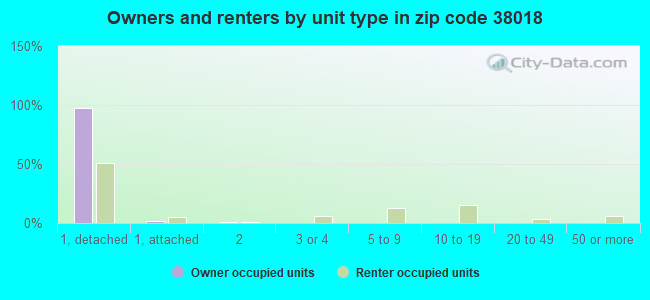
% of renters here:
37%
State:
33%
March 2022 cost of living index in zip code 38018: 87.4 (less than average, U.S. average is 100)
Land area: 18.5 sq. mi. Water area: 0.1 sq. mi.
Population density: 2,115 people per square mile
(low).
OSM Map
General Map
Google Map
MSN Map
OSM Map
General Map
Google Map
MSN Map
OSM Map
General Map
Google Map
MSN Map
OSM Map
General Map
Google Map
MSN Map
Please wait while loading the map...
Real estate property taxes paid for housing units in 2022:
This zip code:
1.0% ($2,800)
Tennessee:
0.5% ($1,376)
Median real estate property taxes paid for housing units with mortgages in 2022: $2,681 (1.0%) Median real estate property taxes paid for housing units with no mortgage in 2022: $3,189 (1.0%)
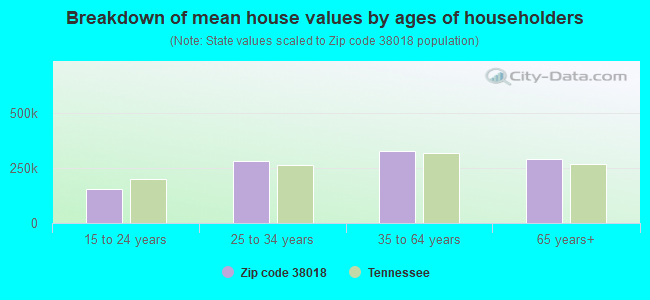
Estimated median house/condo value in 2022: $280,505
38018:
$280,505
Tennessee:
$284,800
According to our research of Tennessee and other state lists, there were 39 registered sex offenders living in 38018 zip code as of April 27, 2024. The ratio of all residents to sex offenders in zip code 38018 is 965 to 1. The ratio of registered sex offenders to all residents in this zip code is much lower than the state average.
Median resident age:
This zip code:
37.1 years
Tennessee median age:
39.2 years
Average household size:
This zip code:
2.6 people
Tennessee:
2.4 people
Averages for the 2020 tax year for zip code 38018, filed in 2021:
Average Adjusted Gross Income (AGI) in 2020: $64,802 (Individual Income Tax Returns)
Here:
$64,802
State:
$69,014
Salary/wage: $57,884 (reported on 85.4% of returns)
Here:
$57,884
State:
$55,872
(% of AGI for various income ranges: 1331.9% for AGIs below $25k, 3967.9% for AGIs $25k-50k, 7289.4% for AGIs $50k-75k, 10327.6% for AGIs $75k-100k, 19266.9% for AGIs $100k-200k, 67747.7% for AGIs over 200k)
Taxable interest for individuals: $1,283 (reported on 20.2% of returns)
This zip code:
$1,283
Tennessee:
$1,945
(% of AGI for various income ranges: 8.2% for AGIs below $25k, 10.5% for AGIs $25k-50k, 20.0% for AGIs $50k-75k, 42.0% for AGIs $75k-100k, 96.0% for AGIs $100k-200k, 809.1% for AGIs over 200k)
Ordinary dividends: $5,390 (reported on 13.3% of returns)
Here:
$5,390
State:
$8,105
(% of AGI for various income ranges: 15.4% for AGIs below $25k, 24.1% for AGIs $25k-50k, 45.3% for AGIs $50k-75k, 100.5% for AGIs $75k-100k, 224.3% for AGIs $100k-200k, 2915.0% for AGIs over 200k)
Net capital gain/loss in AGI: +$20,831 (reported on 12.5% of returns)
Here:
+$20,831
State:
+$33,664
(% of AGI for various income ranges: 5.8% for AGIs below $25k, 23.9% for AGIs $25k-50k, 36.1% for AGIs $50k-75k, 147.9% for AGIs $75k-100k, 414.7% for AGIs $100k-200k, 17694.1% for AGIs over 200k)
Profit/loss from business: +$8,894 (reported on 24.2% of returns)
Here:
+$8,894
State:
+$18,991
(% of AGI for various income ranges: 25.0% for AGIs below $25k, 90.3% for AGIs $50k-75k, 367.1% for AGIs $75k-100k, 898.6% for AGIs $100k-200k, 9334.5% for AGIs over 200k)
Taxable individual retirement arrangement distribution: $20,161 (reported on 6.0% of returns)
38018:
$20,161
Tennessee:
$20,036
(% of AGI for various income ranges: 28.5% for AGIs below $25k, 65.2% for AGIs $25k-50k, 106.1% for AGIs $50k-75k, 219.3% for AGIs $75k-100k, 468.3% for AGIs $100k-200k, 3255.9% for AGIs over 200k)
Self-employed (Keogh) retirement plans: $22,112 (reported on 0.4% of returns)
38018:
$22,112
Tennessee:
$28,955
(% of AGI for various income ranges: 56.3% for AGIs $100k-200k, 461.4% for AGIs over 200k)
Total itemized deductions: $31,826 (reported on 9.9% of returns)
Here:
$31,826
State:
$40,136
(% of AGI for various income ranges: 45.8% for AGIs below $25k, 160.8% for AGIs $25k-50k, 457.6% for AGIs $50k-75k, 658.1% for AGIs $75k-100k, 1208.7% for AGIs $100k-200k, 6843.6% for AGIs over 200k)
Charity contributions: $14,557 (reported on 9.2% of returns)
Here:
$14,557
State:
$19,852
(% of AGI for various income ranges: 6.4% for AGIs below $25k, 43.5% for AGIs $25k-50k, 150.2% for AGIs $50k-75k, 252.9% for AGIs $75k-100k, 546.0% for AGIs $100k-200k, 4090.9% for AGIs over 200k)
Taxes paid: $5,766 (reported on 9.6% of returns)
38018:
$5,766
State:
$6,038
(% of AGI for various income ranges: 6.0% for AGIs below $25k, 28.5% for AGIs $25k-50k, 86.3% for AGIs $50k-75k, 123.5% for AGIs $75k-100k, 239.1% for AGIs $100k-200k, 982.7% for AGIs over 200k)
Earned income credit: $2,439 (reported on 18.6% of returns)
Here:
$2,439
State:
$2,391
(% of AGI for various income ranges: 123.3% for AGIs below $25k, 78.6% for AGIs $25k-50k, 0.9% for AGIs $50k-75k)
Percentage of individuals using paid preparers for their 2020 taxes: 92.2%
Here:
92%
State:
93%
(% for various income ranges: 92.0% for AGIs below $25k, 92.8% for AGIs $25k-50k, 91.9% for AGIs $50k-75k, 92.5% for AGIs $75k-100k, 91.4% for AGIs $100k-200k, 91.9% for AGIs over 200k)
Averages for the 2012 tax year for zip code 38018, filed in 2013:
Average Adjusted Gross Income (AGI) in 2012: $65,517 (Individual Income Tax Returns)
Here:
$65,517
State:
$53,767
Salary/wage: $58,793 (reported on 88.1% of returns)
Here:
$58,793
State:
$45,421
(% of AGI for various income ranges: 81.6% for AGIs below $25k, 88.7% for AGIs $25k-50k, 85.6% for AGIs $50k-75k, 83.4% for AGIs $75k-100k, 83.1% for AGIs $100k-200k, 62.6% for AGIs over 200k)
Taxable interest for individuals: $1,307 (reported on 25.8% of returns)
This zip code:
$1,307
Tennessee:
$1,732
(% of AGI for various income ranges: 0.8% for AGIs below $25k, 0.3% for AGIs $25k-50k, 0.3% for AGIs $50k-75k, 0.4% for AGIs $75k-100k, 0.3% for AGIs $100k-200k, 1.0% for AGIs over 200k)
Ordinary dividends: $4,246 (reported on 16.5% of returns)
Here:
$4,246
State:
$6,739
(% of AGI for various income ranges: 1.1% for AGIs below $25k, 0.5% for AGIs $25k-50k, 0.5% for AGIs $50k-75k, 0.6% for AGIs $75k-100k, 0.9% for AGIs $100k-200k, 2.2% for AGIs over 200k)
Net capital gain/loss in AGI: +$12,760 (reported on 12.5% of returns)
Here:
+$12,760
State:
+$19,082
(% of AGI for various income ranges: 0.4% for AGIs $75k-100k, 0.5% for AGIs $100k-200k, 8.9% for AGIs over 200k)
Profit/loss from business: +$14,041 (reported on 18.5% of returns)
Here:
+$14,041
State:
+$15,240
(% of AGI for various income ranges: 7.9% for AGIs below $25k, 2.0% for AGIs $25k-50k, 2.5% for AGIs $50k-75k, 3.5% for AGIs $75k-100k, 4.0% for AGIs $100k-200k, 5.2% for AGIs over 200k)
Taxable individual retirement arrangement distribution: $17,276 (reported on 7.7% of returns)
38018:
$17,276
Tennessee:
$15,505
(% of AGI for various income ranges: 2.1% for AGIs below $25k, 1.6% for AGIs $25k-50k, 1.7% for AGIs $50k-75k, 2.0% for AGIs $75k-100k, 2.1% for AGIs $100k-200k, 2.3% for AGIs over 200k)
Self-employment retirement plans: $20,433 (reported on 0.7% of returns)
38018:
$20,433
Tennessee:
$22,567
(% of AGI for various income ranges: 0.2% for AGIs $25k-50k, 0.2% for AGIs $100k-200k, 0.6% for AGIs over 200k)
Total itemized deductions: $20,502 (19% of AGI, reported on 39.6% of returns)
Here:
$20,502
State:
$21,976
Here:
18.8% of AGI
State:
17.8% of AGI
(% of AGI for various income ranges: 9.9% for AGIs below $25k, 14.0% for AGIs $25k-50k, 15.7% for AGIs $50k-75k, 14.1% for AGIs $75k-100k, 13.0% for AGIs $100k-200k, 8.6% for AGIs over 200k)
Charity contributions: $5,738 (reported on 34.3% of returns)
Here:
$5,738
State:
$6,709
(% of AGI for various income ranges: 1.1% for AGIs below $25k, 2.4% for AGIs $25k-50k, 3.3% for AGIs $50k-75k, 3.1% for AGIs $75k-100k, 3.5% for AGIs $100k-200k, 3.2% for AGIs over 200k)
Taxes paid: $5,027 (reported on 38.8% of returns)
38018:
$5,027
State:
$4,829
(% of AGI for various income ranges: 2.0% for AGIs below $25k, 2.9% for AGIs $25k-50k, 3.4% for AGIs $50k-75k, 3.4% for AGIs $75k-100k, 3.4% for AGIs $100k-200k, 2.3% for AGIs over 200k)
Earned income credit: $2,332 (reported on 16.7% of returns)
Here:
$2,332
State:
$2,404
(% of AGI for various income ranges: 7.2% for AGIs below $25k, 1.0% for AGIs $25k-50k)
Percentage of individuals using paid preparers for their 2012 taxes: 44.3%
Here:
44%
State:
52%
(% for various income ranges: 42.9% for AGIs below $25k, 41.0% for AGIs $25k-50k, 46.1% for AGIs $50k-75k, 42.0% for AGIs $75k-100k, 47.0% for AGIs $100k-200k, 69.0% for AGIs over 200k)
Averages for the 2004 tax year for zip code 38018, filed in 2005:
Average Adjusted Gross Income (AGI) in 2004: $66,836 (Individual Income Tax Returns)
Here:
$66,836
State:
$44,088
Salary/wage: $60,653 (reported on 88.1% of returns)
Here:
$60,653
State:
$38,825
(% of AGI for various income ranges: 220.2% for AGIs below $10k, 79.9% for AGIs $10k-25k, 85.9% for AGIs $25k-50k, 86.7% for AGIs $50k-75k, 87.8% for AGIs $75k-100k, 72.7% for AGIs over 100k)
Taxable interest for individuals: $1,561 (reported on 43.5% of returns)
This zip code:
$1,561
Tennessee:
$1,802
(% of AGI for various income ranges: 10.0% for AGIs below $10k, 1.9% for AGIs $10k-25k, 0.8% for AGIs $25k-50k, 0.8% for AGIs $50k-75k, 0.5% for AGIs $75k-100k, 1.2% for AGIs over 100k)
Taxable dividends: $2,433 (reported on 26.3% of returns)
Here:
$2,433
State:
$3,727
(% of AGI for various income ranges: 10.0% for AGIs below $10k, 1.5% for AGIs $10k-25k, 0.8% for AGIs $25k-50k, 0.6% for AGIs $50k-75k, 0.7% for AGIs $75k-100k, 1.1% for AGIs over 100k)
Net capital gain/loss: +$12,101 (reported on 22.1% of returns)
Here:
+$12,101
State:
+$15,776
(% of AGI for various income ranges: -0.4% for AGIs below $10k, -0.5% for AGIs $10k-25k, 0.2% for AGIs $25k-50k, 0.2% for AGIs $50k-75k, 0.8% for AGIs $75k-100k, 7.5% for AGIs over 100k)
Profit/loss from business: +$17,509 (reported on 17.8% of returns)
Here:
+$17,509
State:
+$12,882
(% of AGI for various income ranges: 7.3% for AGIs below $10k, 6.7% for AGIs $10k-25k, 3.8% for AGIs $25k-50k, 3.5% for AGIs $50k-75k, 3.1% for AGIs $75k-100k, 5.6% for AGIs over 100k)
Profit/loss from farming: +$660 (reported on 0.3% of returns)
Here:
+$660
State:
-$6,038
IRA payment deduction: $3,151 (reported on 2.9% of returns)
38018:
$3,151
Tennessee:
$2,934
(% of AGI for various income ranges: 0.3% for AGIs $10k-25k, 0.2% for AGIs $25k-50k, 0.2% for AGIs $50k-75k, 0.2% for AGIs $75k-100k, 0.1% for AGIs over 100k)
Self-employed pension: $14,645 (reported on 1.4% of returns)
Here:
$14,645
Tennessee:
$16,857
(% of AGI for various income ranges: 0.9% for AGIs below $10k, 0.1% for AGIs $25k-50k, 0.1% for AGIs $50k-75k, 0.1% for AGIs $75k-100k, 0.5% for AGIs over 100k)
Total itemized deductions: $18,894 (19% of AGI, reported on 52.1% of returns)
Here:
$18,894
State:
$18,035
Here:
19.5% of AGI
State:
19.9% of AGI
(% of AGI for various income ranges: 38.4% for AGIs below $10k, 13.4% for AGIs $10k-25k, 17.6% for AGIs $25k-50k, 17.8% for AGIs $50k-75k, 16.7% for AGIs $75k-100k, 12.3% for AGIs over 100k)
Charity contributions deductions: $4,813 (5% of AGI, reported on 46.9% of returns)
Here:
$4,813
State:
$5,167
Here:
4.8% of AGI
State:
5.3% of AGI
(% of AGI for various income ranges: 2.9% for AGIs below $10k, 1.8% for AGIs $10k-25k, 2.7% for AGIs $25k-50k, 3.1% for AGIs $50k-75k, 3.3% for AGIs $75k-100k, 3.8% for AGIs over 100k)
Total tax: $11,607 (reported on 83.2% of returns)
38018:
$11,607
State:
$7,482
(% of AGI for various income ranges: 7.9% for AGIs below $10k, 4.8% for AGIs $10k-25k, 7.4% for AGIs $25k-50k, 9.5% for AGIs $50k-75k, 10.9% for AGIs $75k-100k, 19.8% for AGIs over 100k)
Earned income credit: $1,656 (reported on 8.5% of returns)
Here:
$1,656
State:
$1,826
Percentage of individuals using paid preparers for their 2004 taxes: 49.1%
Here:
49%
State:
60%
(% for various income ranges: 44.6% for AGIs below $10k, 49.5% for AGIs $10k-25k, 47.8% for AGIs $25k-50k, 47.5% for AGIs $50k-75k, 45.7% for AGIs $75k-100k, 58.3% for AGIs over 100k)
Likely homosexual households (counted as self-reported same-sex unmarried-partner households)
Lesbian couples: 0.1% of all households
Gay men: 0.4% of all households
Household received Food Stamps/SNAP in the past 12 months: 1,182 Household did not receive Food Stamps/SNAP in the past 12 months: 13,517
Women who had a birth in the past 12 months: 407 (324 now married, 85 unmarried) Women who did not have a birth in the past 12 months: 9,120 (3,626 now married, 5,492 unmarried)
Housing units in zip code 38018 with a mortgage: 6,609 (408 second mortgage, 31 home equity loan, 248 both second mortgage and home equity loan) Houses without a mortgage: 129
Median monthly owner costs for units with a mortgage: $1,650 Median monthly owner costs for units without a mortgage: $662
Residents with income below the poverty level in 2022:
This zip code:
9.5%
Whole state:
13.3%
Residents with income below 50% of the poverty level in 2022:
This zip code:
4.1%
Whole state:
7.1%
Median number of rooms in houses and condos:
Here:
7.1
State:
6.5
Median number of rooms in apartments:
Here:
4.9
State:
4.4
Notable locations in this zip code not listed on our city pages
Churches in zip code 38018 include: New Hope Baptist Church (A), Cordova Baptist Church (B), Spirit Life Worship Center (C), Church of God (D), Hill Chapel (E), Morning Chapel (F). Display/hide their locations on the map
5,480 married couples with children.
3,075 single-parent households (1,160 men, 1,915 women).
86.5% of residents of 38018 zip code speak English at home.
4.7% of residents speak Spanish at home (47% very well, 13% well, 32% not well, 9% not at all).
1.8% of residents speak other Indo-European language at home (78% very well, 17% well, 5% not well).
2.8% of residents speak Asian or Pacific Island language at home (41% very well, 34% well, 24% not well, 1% not at all).
4.6% of residents speak other language at home (92% very well, 3% well, 5% not well).
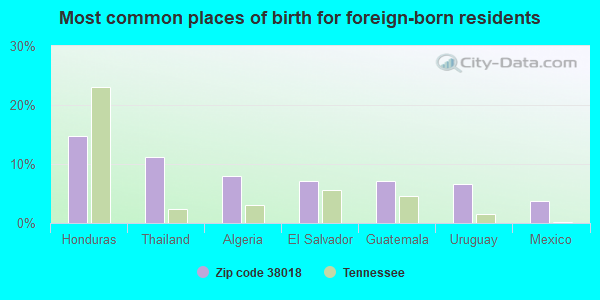
Foreign born population: 4,042 (10.4%) (44.1% of them are naturalized citizens)
This zip code:
10.4%
Whole state:
5.6%
15%Honduras
11%Thailand
8%Algeria
7%El Salvador
7%Guatemala
7%Uruguay
4%Mexico
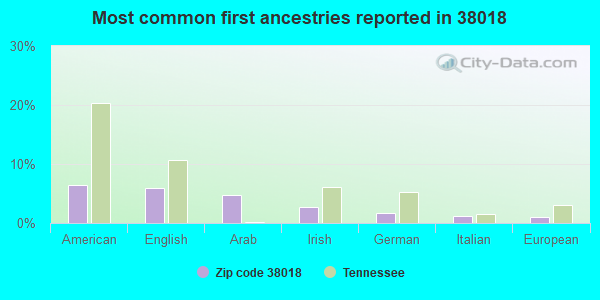
6%American
6%English
5%Arab
3%Irish
2%German
1%Italian
1%European
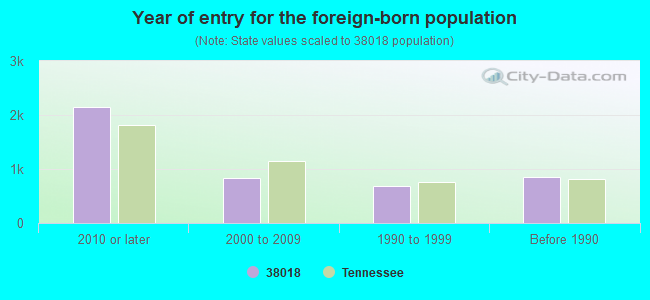
Year of entry for the foreign-born population
2,1552010 or later
8272000 to 2009
6901990 to 1999
856Before 1990
Private high schools in in this zip code not listed on the city page:
EVANGELICAL CHRISTIAN SCHOOL OF MEMPHIS (Students: 1,035, Location: 7600 MACON RD, Grades: PK-12)
FIRST ASSEMBLY CHRISTIAN SCHOOL (Students: 778, Location: 8650 WALNUT GROVE RD, Grades: PK-12)
HERITAGE BAPTIST ACADEMY (Students: 70, Location: 711 N HOUSTON LEVEE RD, Grades: PK-12)
Private elementary/middle schools in in this zip code not listed on the city page:
CORDOVA CHRISTIAN LEARNING ACADEMY (Students: 293, Location: 8200 MACON RD, Grades: PK-6)
Facilities with environmental interests located in this zip code:
CORDOVA CONCRETE INC (7810 MORIARTY RD in CORDOVA, TN)
(Integrated Compliance Information System) - ICIS-04-2005-9956, ENFORCEMENT/COMPLIANCE ACTIVITY FORMAL ENFORCEMENT ACTION (Integrated Compliance Information System) - ICIS-04-2005-9956, ENFORCEMENT/COMPLIANCE ACTIVITY National Pollutant Discharge Elimination System NON-MAJOR (Tracking pollutant discharge elimination systems) - permit TRI REPORTER (Tracking of toxic chemicals releasing facilities) Business SIC classification: READY-MIXED CONCRETE Organizations: CORDOVA CONCRETE (MORIARTY RD) (CONTACT/OWNER)
Alternative names: CORDOVA CONCRETE (MORIARTY RD)
CORDOVA ELEMENTARY SCHOOL (750 SANGA RD in CORDOVA, TN)
(National Center for Education Statistics) - STATE ID-0117 Organizations: MEMPHIS CITY SCHOOL DISTRICT (SCHOOL DISTRICT)
CORDOVA MIDDLE SCHOOL (900 SANGA RD in CORDOVA, TN)
(National Center for Education Statistics) - STATE ID-0118 Organizations: MEMPHIS CITY SCHOOL DISTRICT (SCHOOL DISTRICT)
DEXTER MIDDLE SCHOOL (6998 EAST RALEIGH- LA GRANGE R in CORDOVA, TN)
(National Center for Education Statistics) - STATE ID-0068 Organizations: SHELBY COUNTY SCHOOL DISTRICT (SCHOOL DISTRICT)
COSTCO WHOLESALE #352 (2431 NORTH GERMANTOWN PARKWAY in CORDOVA, TN)
Large Quantity Generators, more that 1000 kg of hazardous waste/month (Resource Conservation and Recovery Act (tracking hazardous waste)) Business NAICS classification: ONE-HOUR PHOTOFINISHING. Organizations: COSTCO WHOLESALE CORP (CONTACT/OPERATOR)
ABRA AUTO BODY AND GLASS (7980 PATRIOT DRIVE in CORDOVA, TN)
Conditionally Exempt Small Quantity Generators, less than 100 kg/month of hazardous waste (Resource Conservation and Recovery Act (tracking hazardous waste)) - notification Business NAICS classification: GENERAL AUTOMOTIVE REPAIR. Organizations: CHARLES CREASY, JR (MANAGER) (CONTACT/OPERATOR)
AC-HUMKO CORPORATION TECHNICAL SERVICE (S01T63 in CORDOVA, TN)
(Resource Conservation and Recovery Act (tracking hazardous waste)) Business NAICS classification: FATS AND OILS REFINING AND BLENDING.
(Resource Conservation and Recovery Act (tracking hazardous waste))
BRAMBLES EQUIPMENT (7839 MORIARTY RD in CORDOVA, TN)
Conditionally Exempt Small Quantity Generators, less than 100 kg/month of hazardous waste (Resource Conservation and Recovery Act (tracking hazardous waste)) - notification Business NAICS classification: ELEVATOR AND MOVING STAIRWAY MANUFACTURING.
Housing units lacking complete plumbing facilities: 0.4% Housing units lacking complete kitchen facilities: 0.7%
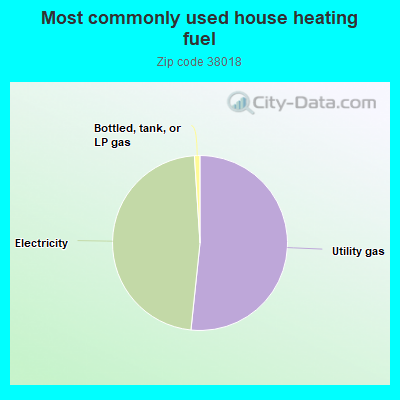
51.5%Utility gas
47.2%Electricity
1.0%Bottled, tank, or LP gas
Population in 1990: 21,777. Population change in the 1990s: +30,933 (+142.0%).
Place of birth for U.S.-born residents:
This state: 21,408
Northeast: 1,123
Midwest: 2,427
South: 7,905
West: 1,787
38% of the 38018 zip code residents lived in the same house 5 years ago. Out of people who lived in different houses, 60% lived in this county. Out of people who lived in different counties, 50% lived in Tennessee.
85% of the 38018 zip code residents lived in the same house 1 year ago. Out of people who lived in different houses, 63% moved from this county. Out of people who lived in different houses, 6% moved from different county within same state. Out of people who lived in different houses, 24% moved from different state. Out of people who lived in different houses, 2% moved from abroad.
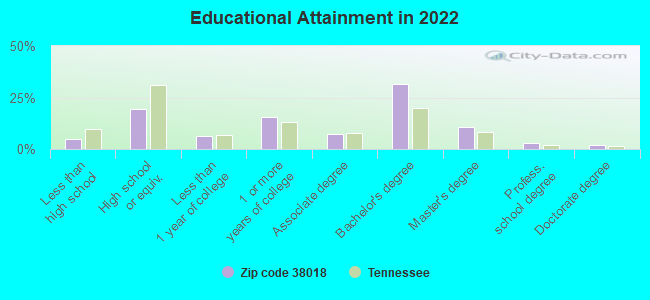
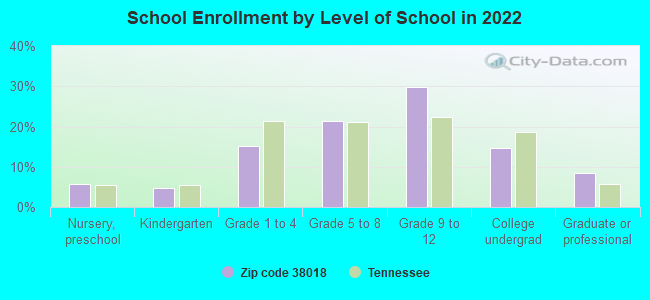
Private vs. public school enrollment:
Students in private schools in grades 1 to 8 (elementary and middle school): 442
Here:
12.6%
Tennessee:
15.0%
Students in private schools in grades 9 to 12 (high school): 1,076
Here:
37.2%
Tennessee:
16.2%
Students in private undergraduate colleges: 184
Here:
13.0%
Tennessee:
23.5%
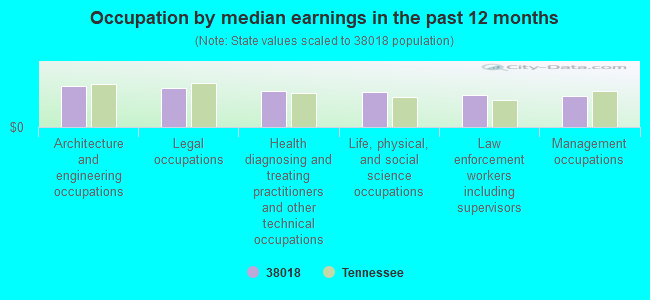
Occupation by median earnings in the past 12 months ($)
101,346Architecture and engineering occupations
95,167Legal occupations
87,650Health diagnosing and treating practitioners and other technical occupations
85,767Life, physical, and social science occupations
79,167Law enforcement workers including supervisors
75,484Management occupations
Companies with biggest federal contracts located in this zip code (CORDOVA, TN):
CHANCELLOR & SON, INC. (7474 RALEIGH LA GRANGE RD.) : $46,008,801 in 133 contractsfrom 1999 to 2006
Contracts for Construction of Structures and Facilities -- Other Non-Building Facilities, Construction of Structures and Facilities -- Other Conservation and Development Facilities, Construction of Structures and Facilities -- Highways, Roads, Streets, Bridges, and Railways (includes resurfacing), Construction of Structures and Facilities -- Other Utilities, and moreby U.S. Army Corps of Engineers - civil program financing only, Army, Natural Resources Conservation Service Signed by year:2000: $11,054,693; 2001: $15,599,629; 2002: $481,231; 2003: $3,340,313; 2004: $4,617,349; 2005: $3,764,866; 2006: $2,937,020.
Biggest contracts:
$5,000,000 with U.S. Army Corps of Engineers - civil program financing only for Construction of Structures and Facilities -- Other Non-Building Facilities. Taking place in MS. Signed on 2001-11-20. Completion date: 2003-08-13.
$3,500,000, same as above.Signed on 2001-11-09. Completion date: 2003-08-13.
$2,000,000, same as above.Signed on 2001-01-18. Completion date: 2002-10-08.
$1,611,074, same as above.Signed on 2001-04-30. Completion date: 2002-10-08.
INVENTORY LOCATOR SERVICE LLC (8001 CENTERVIEW PKWY 4TH F; small business) : $1,875,833 in 101 contractsfrom 1999 to 2006
Contracts for Other ADP and Telecommunications Services (includes data storage on tapes, compact disks, etc.), Miscellaneous Items, Communications Services, Administrative and Service Buildings, and moreby Navy, Defense Logistics Agency, Air Force, Army, and others Signed by year:2000: $108,499; 2001: $104,004; 2002: $180,620; 2003: $565,771; 2004: $408,998; 2005: $367,813; 2006: $106,613.
Biggest contracts:
$301,458 with Navy for Other ADP and Telecommunications Services (includes data storage on tapes, compact disks, etc.). Signed on 2003-04-25. Completion date: 2007-09-30.
$73,950 with Defense Logistics Agency for Miscellaneous Items. Signed on 2004-10-01. Completion date: 2004-10-30.
$73,950 with Defense Logistics Agency for Communications Services. Signed on 2005-10-25. Completion date: 2006-09-30.
$65,442 with Navy for Administrative and Service Buildings. Taking place in PA. Signed on 2002-10-01. Completion date: 2002-09-30.
STANDARD CONSTRUCTION COMPANY, (7434 RALEIGH LAGRANGE; small business) : $888,540 in 35 contractsfrom 1999 to 2006
Contracts for Maintenance, Repair or Alteration of Real Property -- Highways, Roads, Streets, Bridges, and Railways (includes resurfacing), Maintenance, Repair or Alteration of Real Property -- Miscellaneous Buildings, Maintenance, Repair or Alteration of Real Property -- Testing and Measurement Buildings by Navy Signed by year:2000: $491,073; 2001: $0; 2002: $0; 2003: $0; 2004: $25,000; 2005: $301,659; 2006: $51,201.
Biggest contracts:
$105,219 with Navy for Maintenance, Repair or Alteration of Real Property -- Highways, Roads, Streets, Bridges, and Railways (includes resurfacing). Signed on 2000-09-29. Completion date: 2001-01-31.
$97,905, same as above.Signed on 2000-09-30. Completion date: 2000-11-30.
$92,912, same as above.Signed on 2000-09-08. Completion date: 2000-11-30.
$73,508, same as above.Signed on 2000-09-29. Completion date: 2000-11-30.
MADDEN PHILLIPS CONSTRUCTION I (1190 BIG ORANGE RD; small business) : $149,877 in 8 contractsfrom 2001 to 2003
Contracts for Construction of Structures and Facilities -- Highways, Roads, Streets, Bridges, and Railways (includes resurfacing), Maintenance, Repair or Alteration of Real Property -- Sewage and Waste Facilities, Maintenance, Repair or Alteration of Real Property -- Other Administrative Facilities and Service Buildings, Maintenance, Repair or Alteration of Real Property -- Highways, Roads, Streets, Bridges, and Railways (includes resurfacing) by Forest Service (disused code: now 12C2), Navy Signed by year:2000: $0; 2001: $87,000; 2002: $0; 2003: $62,877; 2004: $0; 2005: $0; 2006: $0.
Biggest contracts:
$65,000 with Forest Service (disused code: now 12C2) for Construction of Structures and Facilities -- Highways, Roads, Streets, Bridges, and Railways (includes resurfacing). Taking place in MS. Signed on 2001-09-15. Completion date: 2001-11-15.
$24,971 with Navy for Maintenance, Repair or Alteration of Real Property -- Sewage and Waste Facilities. Signed on 2003-05-01. Completion date: 2003-06-30.
$22,915 with Navy for Maintenance, Repair or Alteration of Real Property -- Other Administrative Facilities and Service Buildings. Signed on 2003-07-28. Completion date: 2003-09-26.
$22,000 with Forest Service (disused code: now 12C2) for Construction of Structures and Facilities -- Highways, Roads, Streets, Bridges, and Railways (includes resurfacing). Taking place in MS. Signed on 2001-11-15. Completion date: 2001-11-15.
COMPUTER A C POWER SOLUTIONS, (7845 TRINITY RD STE 102; small business) : $123,566 in 4 contractsfrom 2003 to 2005
$63,524 with Army for ADP Support Equipment. Signed on 2005-08-24. Completion date: 2005-08-31.
$45,402 with Navy for Converters, Electrical, Nonrotating. Signed on 2003-07-08. Completion date: 2003-07-08.
$9,544 with Army for ADP Support Equipment. Signed on 2004-08-25. Completion date: 2004-09-16.
$5,096, same as above.Signed on 2004-08-13. Completion date: 2004-08-31.
JIMMY DEAN FOODS DIVISION OF S (8000 CENTERVIEW PARKWAY) : $109,856 in 3 contractsfrom 2000 to 2001
$52,976 with Department of Defense for Food Items For Resale. Signed on 2001-01-01. Completion date: 2001-02-28.
$28,787, same as above.Signed on 2001-12-01. Completion date: 2001-12-31.
$28,093 with Department of Defense for Food Items For Resale. Taking place in FL. Signed on 2000-01-31. Completion date: 2000-01-31.
WARREN AND ASSOCIATES LLC (7862 HARBOR OAK CV; small business)
$82,267 with Army for Miscellaneous Maintenance and Repair Shop Specialized Equipment. Signed on 2000-05-12. Completion date: 2000-07-31.
NATIONAL EQUIPMENT SERVICES IN (7839 MORIARTY RD) : $77,050 in 8 contractsfrom 2002 to 2005
Contracts for Winches, Hoists, Cranes, and Derricks, Miscellaneous Vehicular Components, Lease or Rental of Equipment -- Miscellaneous, Lease or Rental of Equipment -- Construction, Mining, Excavating, and Highway Maintenance Equipment, and moreby Navy, Army, U.S. Army Corps of Engineers - civil program financing only Signed by year:2000: $0; 2001: $0; 2002: $5,014; 2003: $56,536; 2004: $8,000; 2005: $7,500; 2006: $0.
Biggest contracts:
$45,250 with Navy for Winches, Hoists, Cranes, and Derricks. Taking place in CT. Signed on 2003-03-25. Completion date: 2003-04-22.
$8,000 with Army for Miscellaneous Vehicular Components. Signed on 2004-09-26. Completion date: 2004-10-26.
$7,500 with Army for Lease or Rental of Equipment -- Miscellaneous. Taking place in KS. Signed on 2005-08-26. Completion date: 2005-09-02.
$6,100 with U.S. Army Corps of Engineers - civil program financing only for Lease or Rental of Equipment -- Construction, Mining, Excavating, and Highway Maintenance Equipment. Taking place in IL. Signed on 2003-02-18. Completion date: 2003-03-17.
PROMEDIA, INC (7865 TRINITY ROAD #110) : $76,571 in 3 contractsfrom 2001 to 2004
$57,777 with U.S. Army Corps of Engineers - civil program financing only for ADP Support Equipment. Signed on 2001-11-15. Completion date: 2001-11-29.
$12,195 with Army for ADPE System Configuration. Signed on 2004-09-29. Completion date: 2004-10-15.
$6,599 with Air Force for ADPE System Configuration. Signed on 2003-04-04. Completion date: 2003-04-21.
FREEMAN FORD FABRICATORS INC (8572 MACON RD; small business) : $66,843 in 2 contractsfrom 2000 to 2002
$39,523 with U.S. Army Corps of Engineers - civil program financing only for Marine Hardware and Hull Items. Signed on 2000-07-19. Completion date: 2000-09-25.
$27,320 with U.S. Army Corps of Engineers - civil program financing only for Bearings, Mounted. Signed on 2002-03-22. Completion date: 2002-06-28.
Top industries in this zip code by the number of employees in 2005:
Administrative and Support and Waste Management and Remediation Services: Temporary Help Services (100-249: 1, 50-99: 2, 20-49: 1, 10-19: 1, 5-9: 1, 1-4: 3)
People in group quarters in 2010:
368 people in nursing facilities/skilled-nursing facilities
People in group quarters in 2000:
360 people in nursing homes
142 people in other group homes
2 people in religious group quarters
Fatal accident statistics in 2013:
Fatal accident count: 1
Vehicles involved in fatal accidents: 2
Fatal accidents caused by drunken drivers: 0
Fatalities: 1
Persons involved in fatal accidents: 1
Pedestrians involved in fatal accidents: 0
Fatal accident statistics in 2012:
Fatal accident count: 2
Vehicles involved in fatal accidents: 5
Fatal accidents caused by drunken drivers: 0
Fatalities: 2
Persons involved in fatal accidents: 6
Pedestrians involved in fatal accidents: 0
Home Mortgage Disclosure Act Aggregated Statistics For Year 2009 (Based on 10 full and 6 partial tracts)
A) FHA, FSA/RHS & VA Home Purchase Loans
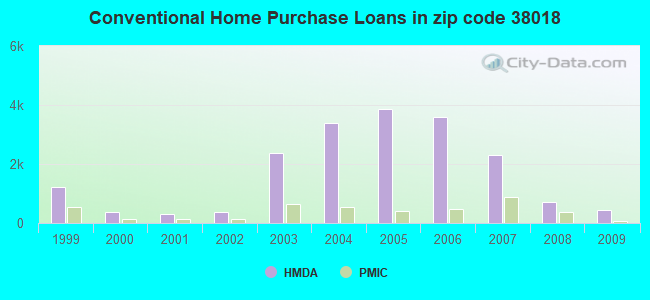
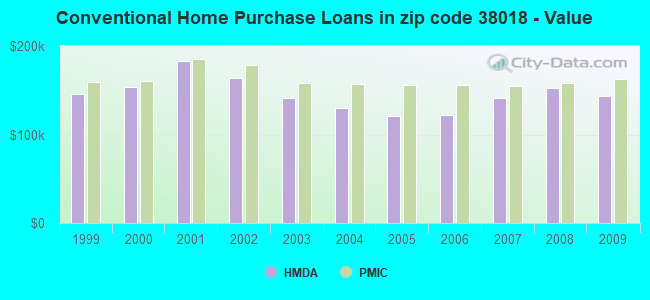
B) Conventional Home Purchase Loans
C) Refinancings
D) Home Improvement Loans
F) Non-occupant Loans on < 5 Family Dwellings (A B C & D)
G) Loans On Manufactured Home Dwelling (A B C & D)
Number
Average Value
Number
Average Value
Number
Average Value
Number
Average Value
Number
Average Value
Number
Average Value
LOANS ORIGINATED
1,259
$137,772
436
$143,946
1,688
$152,362
55
$40,786
183
$115,514
3
$281,597
APPLICATIONS APPROVED, NOT ACCEPTED
46
$132,016
24
$123,084
199
$153,838
13
$18,533
5
$86,880
2
$70,690
APPLICATIONS DENIED
154
$131,193
92
$167,605
814
$161,595
80
$29,775
62
$111,913
2
$41,530
APPLICATIONS WITHDRAWN
99
$137,600
57
$183,663
577
$163,766
18
$65,573
35
$168,360
0
$0
FILES CLOSED FOR INCOMPLETENESS
22
$136,144
7
$150,276
143
$158,228
9
$107,382
4
$111,210
0
$0
Aggregated Statistics For Year 2008 (Based on 10 full and 6 partial tracts)
A) FHA, FSA/RHS & VA Home Purchase Loans
B) Conventional Home Purchase Loans
C) Refinancings
D) Home Improvement Loans
E) Loans on Dwellings For 5+ Families
F) Non-occupant Loans on < 5 Family Dwellings (A B C & D)
G) Loans On Manufactured Home Dwelling (A B C & D)
Number
Average Value
Number
Average Value
Number
Average Value
Number
Average Value
Number
Average Value
Number
Average Value
Number
Average Value
LOANS ORIGINATED
882
$144,151
712
$153,049
1,070
$155,531
69
$48,676
2
$26,213,150
256
$124,570
0
$0
APPLICATIONS APPROVED, NOT ACCEPTED
44
$139,051
104
$153,379
138
$154,182
25
$29,082
0
$0
20
$88,288
3
$49,667
APPLICATIONS DENIED
134
$147,972
236
$168,666
1,157
$172,352
122
$66,728
0
$0
73
$164,323
3
$44,670
APPLICATIONS WITHDRAWN
90
$153,420
97
$181,254
401
$181,191
16
$186,583
0
$0
32
$158,756
0
$0
FILES CLOSED FOR INCOMPLETENESS
17
$177,482
48
$202,109
86
$212,508
5
$24,574
0
$0
6
$81,308
0
$0
Aggregated Statistics For Year 2007 (Based on 10 full and 6 partial tracts)
A) FHA, FSA/RHS & VA Home Purchase Loans
B) Conventional Home Purchase Loans
C) Refinancings
D) Home Improvement Loans
E) Loans on Dwellings For 5+ Families
F) Non-occupant Loans on < 5 Family Dwellings (A B C & D)
G) Loans On Manufactured Home Dwelling (A B C & D)
Number
Average Value
Number
Average Value
Number
Average Value
Number
Average Value
Number
Average Value
Number
Average Value
Number
Average Value
LOANS ORIGINATED
330
$148,385
2,302
$141,508
1,330
$152,795
143
$49,362
1
$20,145,000
304
$149,759
3
$43,767
APPLICATIONS APPROVED, NOT ACCEPTED
13
$149,215
282
$150,139
321
$155,622
23
$47,157
0
$0
23
$140,708
3
$75,000
APPLICATIONS DENIED
63
$154,123
613
$171,086
1,607
$166,846
154
$66,331
0
$0
91
$152,878
5
$122,872
APPLICATIONS WITHDRAWN
34
$149,099
214
$172,430
554
$164,030
16
$129,119
0
$0
38
$171,343
1
$61,000
FILES CLOSED FOR INCOMPLETENESS
1
$186,000
110
$182,621
178
$170,747
13
$115,431
0
$0
15
$108,567
0
$0
Aggregated Statistics For Year 2006 (Based on 10 full and 6 partial tracts)
A) FHA, FSA/RHS & VA Home Purchase Loans
B) Conventional Home Purchase Loans
C) Refinancings
D) Home Improvement Loans
E) Loans on Dwellings For 5+ Families
F) Non-occupant Loans on < 5 Family Dwellings (A B C & D)
G) Loans On Manufactured Home Dwelling (A B C & D)
Number
Average Value
Number
Average Value
Number
Average Value
Number
Average Value
Number
Average Value
Number
Average Value
Number
Average Value
LOANS ORIGINATED
493
$145,282
3,598
$121,705
1,387
$138,827
123
$50,495
6
$14,915,337
414
$126,877
4
$42,470
APPLICATIONS APPROVED, NOT ACCEPTED
6
$152,630
463
$122,028
408
$129,675
34
$30,537
0
$0
64
$148,174
4
$34,555
APPLICATIONS DENIED
31
$137,263
983
$145,567
1,436
$156,050
189
$53,560
0
$0
136
$183,228
9
$36,183
APPLICATIONS WITHDRAWN
34
$144,676
400
$134,664
801
$159,144
37
$63,866
2
$3,192,890
69
$139,126
0
$0
FILES CLOSED FOR INCOMPLETENESS
5
$91,070
147
$130,360
271
$150,784
3
$55,263
0
$0
21
$110,617
0
$0
Aggregated Statistics For Year 2005 (Based on 10 full and 6 partial tracts)
A) FHA, FSA/RHS & VA Home Purchase Loans
B) Conventional Home Purchase Loans
C) Refinancings
D) Home Improvement Loans
E) Loans on Dwellings For 5+ Families
F) Non-occupant Loans on < 5 Family Dwellings (A B C & D)
G) Loans On Manufactured Home Dwelling (A B C & D)
Number
Average Value
Number
Average Value
Number
Average Value
Number
Average Value
Number
Average Value
Number
Average Value
Number
Average Value
LOANS ORIGINATED
347
$142,923
3,853
$120,703
1,872
$143,664
102
$47,175
6
$20,632,972
382
$114,256
0
$0
APPLICATIONS APPROVED, NOT ACCEPTED
6
$140,063
455
$127,476
407
$131,988
29
$34,661
0
$0
31
$108,406
2
$122,000
APPLICATIONS DENIED
39
$129,614
823
$138,727
1,517
$151,465
182
$51,358
0
$0
86
$104,457
13
$87,270
APPLICATIONS WITHDRAWN
29
$134,560
572
$146,836
815
$163,226
53
$152,153
0
$0
57
$190,044
0
$0
FILES CLOSED FOR INCOMPLETENESS
8
$140,492
138
$135,032
373
$169,234
15
$91,850
0
$0
15
$102,467
0
$0
Aggregated Statistics For Year 2004 (Based on 10 full and 6 partial tracts)
A) FHA, FSA/RHS & VA Home Purchase Loans
B) Conventional Home Purchase Loans
C) Refinancings
D) Home Improvement Loans
E) Loans on Dwellings For 5+ Families
F) Non-occupant Loans on < 5 Family Dwellings (A B C & D)
G) Loans On Manufactured Home Dwelling (A B C & D)
Number
Average Value
Number
Average Value
Number
Average Value
Number
Average Value
Number
Average Value
Number
Average Value
Number
Average Value
LOANS ORIGINATED
570
$132,121
3,400
$130,503
2,346
$145,638
102
$43,076
0
$0
442
$116,222
10
$32,550
APPLICATIONS APPROVED, NOT ACCEPTED
10
$144,620
347
$141,648
478
$144,486
23
$20,505
2
$9,079,295
50
$91,120
0
$0
APPLICATIONS DENIED
66
$132,881
581
$128,044
1,319
$138,064
161
$48,409
0
$0
100
$128,370
20
$91,704
APPLICATIONS WITHDRAWN
29
$133,626
348
$165,638
734
$152,626
19
$64,331
0
$0
55
$123,087
4
$189,460
FILES CLOSED FOR INCOMPLETENESS
9
$110,472
126
$137,155
344
$152,503
7
$52,839
0
$0
23
$112,532
0
$0
Aggregated Statistics For Year 2003 (Based on 10 full and 6 partial tracts)
A) FHA, FSA/RHS & VA Home Purchase Loans
B) Conventional Home Purchase Loans
C) Refinancings
D) Home Improvement Loans
E) Loans on Dwellings For 5+ Families
F) Non-occupant Loans on < 5 Family Dwellings (A B C & D)
Number
Average Value
Number
Average Value
Number
Average Value
Number
Average Value
Number
Average Value
Number
Average Value
LOANS ORIGINATED
740
$132,454
2,371
$141,065
5,957
$142,666
113
$35,153
4
$4,500,000
325
$120,201
APPLICATIONS APPROVED, NOT ACCEPTED
13
$143,099
201
$145,079
727
$137,575
44
$78,789
0
$0
24
$108,875
APPLICATIONS DENIED
56
$130,502
347
$144,043
1,533
$138,470
96
$43,319
0
$0
63
$111,624
APPLICATIONS WITHDRAWN
42
$137,045
216
$154,667
894
$151,488
15
$39,586
0
$0
37
$113,928
FILES CLOSED FOR INCOMPLETENESS
6
$103,500
97
$143,282
264
$155,445
5
$36,000
0
$0
8
$107,502
Aggregated Statistics For Year 2002 (Based on 2 full tracts)
A) FHA, FSA/RHS & VA Home Purchase Loans
B) Conventional Home Purchase Loans
C) Refinancings
D) Home Improvement Loans
F) Non-occupant Loans on < 5 Family Dwellings (A B C & D)
Number
Average Value
Number
Average Value
Number
Average Value
Number
Average Value
Number
Average Value
LOANS ORIGINATED
70
$141,415
356
$163,535
768
$166,039
32
$55,046
42
$119,345
APPLICATIONS APPROVED, NOT ACCEPTED
0
$0
20
$127,462
54
$137,588
10
$11,796
4
$110,968
APPLICATIONS DENIED
6
$126,962
28
$189,300
168
$169,663
8
$44,236
6
$119,298
APPLICATIONS WITHDRAWN
8
$138,959
48
$132,502
130
$163,751
4
$28,492
12
$115,298
FILES CLOSED FOR INCOMPLETENESS
0
$0
6
$178,280
30
$174,681
0
$0
0
$0
Aggregated Statistics For Year 2001 (Based on 2 full tracts)
A) FHA, FSA/RHS & VA Home Purchase Loans
B) Conventional Home Purchase Loans
C) Refinancings
D) Home Improvement Loans
F) Non-occupant Loans on < 5 Family Dwellings (A B C & D)
Number
Average Value
Number
Average Value
Number
Average Value
Number
Average Value
Number
Average Value
LOANS ORIGINATED
68
$142,428
310
$182,713
608
$163,931
48
$28,283
26
$89,588
APPLICATIONS APPROVED, NOT ACCEPTED
0
$0
18
$281,916
58
$165,985
8
$30,991
0
$0
APPLICATIONS DENIED
6
$109,633
36
$265,865
166
$161,988
18
$35,323
2
$39,990
APPLICATIONS WITHDRAWN
0
$0
32
$221,121
116
$142,957
6
$30,325
8
$146,956
FILES CLOSED FOR INCOMPLETENESS
2
$140,960
6
$312,240
28
$217,792
2
$19,995
0
$0
Aggregated Statistics For Year 2000 (Based on 2 full tracts)
A) FHA, FSA/RHS & VA Home Purchase Loans
B) Conventional Home Purchase Loans
C) Refinancings
D) Home Improvement Loans
F) Non-occupant Loans on < 5 Family Dwellings (A B C & D)
Number
Average Value
Number
Average Value
Number
Average Value
Number
Average Value
Number
Average Value
LOANS ORIGINATED
48
$145,915
366
$154,019
124
$139,361
36
$23,382
22
$135,868
APPLICATIONS APPROVED, NOT ACCEPTED
2
$106,970
20
$165,850
38
$120,280
4
$39,488
0
$0
APPLICATIONS DENIED
2
$116,965
46
$131,917
92
$117,747
16
$32,365
6
$100,303
APPLICATIONS WITHDRAWN
0
$0
28
$170,449
42
$117,346
8
$118,715
2
$108,965
FILES CLOSED FOR INCOMPLETENESS
0
$0
6
$122,630
14
$100,684
0
$0
0
$0
Aggregated Statistics For Year 1999 (Based on 3 full and 2 partial tracts)
A) FHA, FSA/RHS & VA Home Purchase Loans
B) Conventional Home Purchase Loans
C) Refinancings
D) Home Improvement Loans
F) Non-occupant Loans on < 5 Family Dwellings (A B C & D)
2002 - 2018 National Fire Incident Reporting System (NFIRS) incidents
Based on the data from the years 2002 - 2018 the average number of fires per year is 96. The highest number of fires - 137 took place in 2002, and the least - 60 in 2014. The data has a decreasing trend.
When looking into fire subcategories, the most reports belonged to: Structure Fires (37.3%), and Outside Fires (36.6%).
Fire incident types reported to NFIRS in Zip Code 38018


+$660
-$6,038
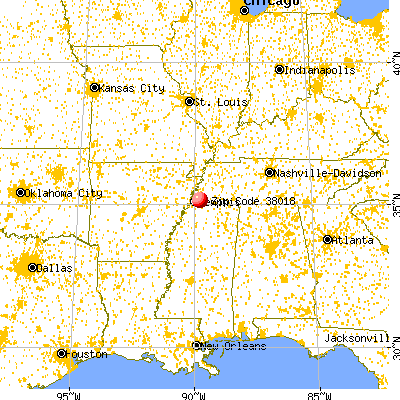
 Nearest zip codes: 38016, 38139, 38138, 38133, 38120, 38119.


 (Students: 1,035, Location: 7600 MACON RD, Grades: PK-12)

 Based on the data from the years 2002 - 2018 the average number of fires per year is 96. The highest number of fires - 137 took place in 2002, and the least - 60 in 2014. The data has a decreasing trend.
 When looking into fire subcategories, the most reports belonged to: Structure Fires (37.3%), and Outside Fires (36.6%).