Estimated zip code population in 2022: 13,803 Zip code population in 2010: 14,237 Zip code population in 2000: 13,693
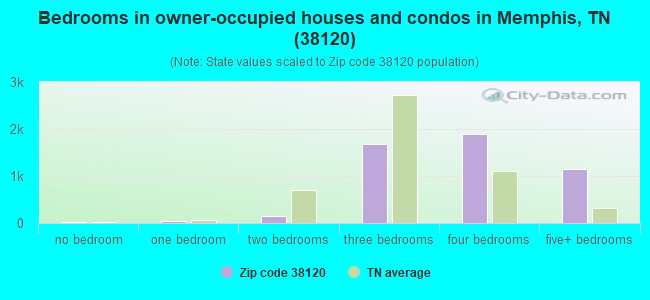
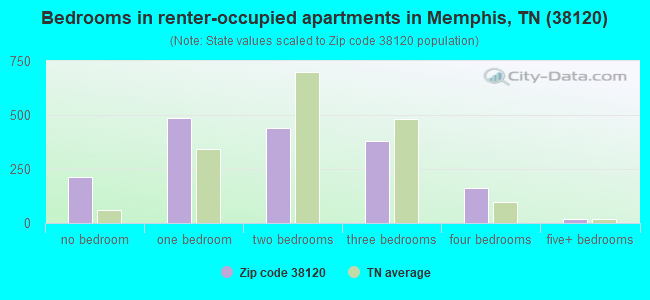
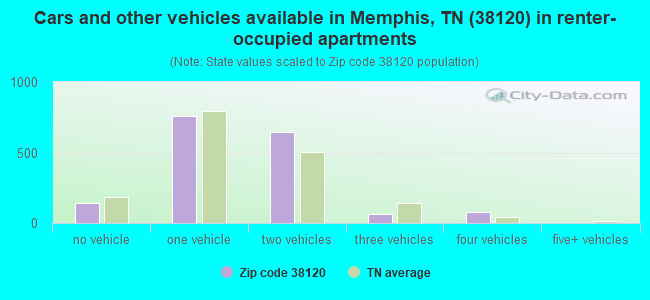
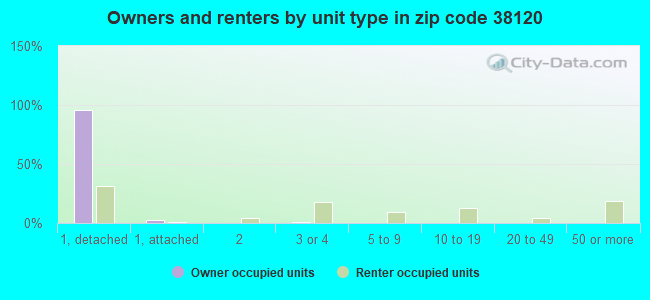
Houses and condos: 6,996 Renter-occupied apartments: 1,679
% of renters here:
26%
State:
33%
March 2022 cost of living index in zip code 38120: 88.4 (less than average, U.S. average is 100)
Land area: 9.6 sq. mi. Water area: 0.0 sq. mi.
Population density: 1,431 people per square mile
(low).
OSM Map
General Map
Google Map
MSN Map
OSM Map
General Map
Google Map
MSN Map
OSM Map
General Map
Google Map
MSN Map
OSM Map
General Map
Google Map
MSN Map
Please wait while loading the map...
Real estate property taxes paid for housing units in 2022:
This zip code:
1.2% ($6,173)
Tennessee:
0.5% ($1,376)
Median real estate property taxes paid for housing units with mortgages in 2022: $5,029 (1.0%) Median real estate property taxes paid for housing units with no mortgage in 2022: $7,396 (1.4%)
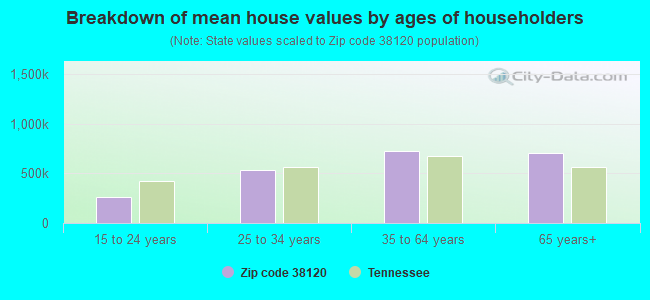
Estimated median house/condo value in 2022: $521,254
38120:
$521,254
Tennessee:
$284,800
According to our research of Tennessee and other state lists, there were 7 registered sex offenders living in 38120 zip code as of April 27, 2024. The ratio of all residents to sex offenders in zip code 38120 is 2,148 to 1. The ratio of registered sex offenders to all residents in this zip code is much lower than the state average.
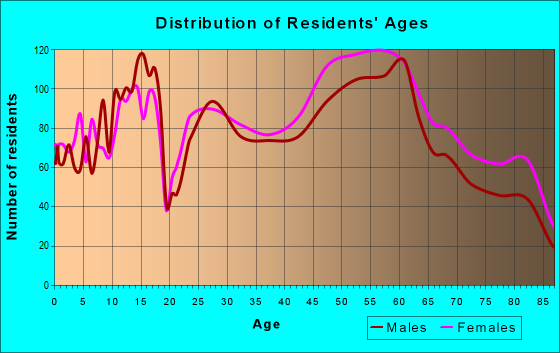
Median resident age:
This zip code:
47.1 years
Tennessee median age:
39.2 years
Average household size:
This zip code:
2.1 people
Tennessee:
2.4 people
Averages for the 2020 tax year for zip code 38120, filed in 2021:
Average Adjusted Gross Income (AGI) in 2020: $242,570 (Individual Income Tax Returns)
Here:
$242,570
State:
$69,014
Salary/wage: $151,142 (reported on 75.6% of returns)
Here:
$151,142
State:
$55,872
(% of AGI for various income ranges: 1169.7% for AGIs below $25k, 3733.8% for AGIs $25k-50k, 6689.2% for AGIs $50k-75k, 9772.6% for AGIs $75k-100k, 18847.9% for AGIs $100k-200k, 124240.4% for AGIs over 200k)
Taxable interest for individuals: $10,293 (reported on 50.6% of returns)
This zip code:
$10,293
Tennessee:
$1,945
(% of AGI for various income ranges: 40.5% for AGIs below $25k, 48.7% for AGIs $25k-50k, 121.9% for AGIs $50k-75k, 136.8% for AGIs $75k-100k, 341.5% for AGIs $100k-200k, 7175.4% for AGIs over 200k)
Ordinary dividends: $26,353 (reported on 45.7% of returns)
Here:
$26,353
State:
$8,105
(% of AGI for various income ranges: 122.1% for AGIs below $25k, 199.4% for AGIs $25k-50k, 293.8% for AGIs $50k-75k, 534.7% for AGIs $75k-100k, 1354.3% for AGIs $100k-200k, 15365.9% for AGIs over 200k)
Net capital gain/loss in AGI: +$133,401 (reported on 42.4% of returns)
Here:
+$133,401
State:
+$33,664
(% of AGI for various income ranges: 52.3% for AGIs below $25k, 98.5% for AGIs $25k-50k, 148.7% for AGIs $50k-75k, 332.9% for AGIs $75k-100k, 1304.8% for AGIs $100k-200k, 85497.2% for AGIs over 200k)
Profit/loss from business: +$56,588 (reported on 24.0% of returns)
Here:
+$56,588
State:
+$18,991
(% of AGI for various income ranges: 168.2% for AGIs below $25k, 152.1% for AGIs $25k-50k, 461.4% for AGIs $50k-75k, 717.6% for AGIs $75k-100k, 1884.0% for AGIs $100k-200k, 16575.9% for AGIs over 200k)
Taxable individual retirement arrangement distribution: $37,133 (reported on 13.7% of returns)
38120:
$37,133
Tennessee:
$20,036
(% of AGI for various income ranges: 85.8% for AGIs below $25k, 164.2% for AGIs $25k-50k, 289.7% for AGIs $50k-75k, 568.7% for AGIs $75k-100k, 1186.4% for AGIs $100k-200k, 4845.0% for AGIs over 200k)
Self-employed (Keogh) retirement plans: $32,678 (reported on 3.8% of returns)
38120:
$32,678
Tennessee:
$28,955
(% of AGI for various income ranges: 223.6% for AGIs $100k-200k, 1592.4% for AGIs over 200k)
Total itemized deductions: $71,536 (reported on 21.1% of returns)
Here:
$71,536
State:
$40,136
(% of AGI for various income ranges: 168.7% for AGIs below $25k, 248.5% for AGIs $25k-50k, 493.5% for AGIs $50k-75k, 666.3% for AGIs $75k-100k, 1507.5% for AGIs $100k-200k, 19269.6% for AGIs over 200k)
Charity contributions: $43,601 (reported on 19.0% of returns)
Here:
$43,601
State:
$19,852
(% of AGI for various income ranges: 17.7% for AGIs below $25k, 34.2% for AGIs $25k-50k, 111.9% for AGIs $50k-75k, 171.3% for AGIs $75k-100k, 474.0% for AGIs $100k-200k, 11807.6% for AGIs over 200k)
Taxes paid: $8,305 (reported on 20.8% of returns)
38120:
$8,305
State:
$6,038
(% of AGI for various income ranges: 33.8% for AGIs below $25k, 39.0% for AGIs $25k-50k, 109.7% for AGIs $50k-75k, 173.4% for AGIs $75k-100k, 355.8% for AGIs $100k-200k, 1739.3% for AGIs over 200k)
Earned income credit: $1,833 (reported on 5.9% of returns)
Here:
$1,833
State:
$2,391
(% of AGI for various income ranges: 58.2% for AGIs below $25k, 28.0% for AGIs $25k-50k)
Percentage of individuals using paid preparers for their 2020 taxes: 92.2%
Here:
92%
State:
93%
(% for various income ranges: 90.1% for AGIs below $25k, 93.0% for AGIs $25k-50k, 91.7% for AGIs $50k-75k, 92.2% for AGIs $75k-100k, 92.1% for AGIs $100k-200k, 94.1% for AGIs over 200k)
Averages for the 2012 tax year for zip code 38120, filed in 2013:
Average Adjusted Gross Income (AGI) in 2012: $197,664 (Individual Income Tax Returns)
Here:
$197,664
State:
$53,767
Salary/wage: $128,717 (reported on 75.6% of returns)
Here:
$128,717
State:
$45,421
(% of AGI for various income ranges: 66.1% for AGIs below $25k, 72.6% for AGIs $25k-50k, 68.4% for AGIs $50k-75k, 67.2% for AGIs $75k-100k, 63.2% for AGIs $100k-200k, 43.9% for AGIs over 200k)
Taxable interest for individuals: $10,037 (reported on 52.5% of returns)
This zip code:
$10,037
Tennessee:
$1,732
(% of AGI for various income ranges: 3.0% for AGIs below $25k, 1.5% for AGIs $25k-50k, 1.6% for AGIs $50k-75k, 2.3% for AGIs $75k-100k, 1.9% for AGIs $100k-200k, 2.9% for AGIs over 200k)
Ordinary dividends: $26,260 (reported on 47.1% of returns)
Here:
$26,260
State:
$6,739
(% of AGI for various income ranges: 8.9% for AGIs below $25k, 3.8% for AGIs $25k-50k, 4.4% for AGIs $50k-75k, 4.0% for AGIs $75k-100k, 5.5% for AGIs $100k-200k, 6.6% for AGIs over 200k)
Net capital gain/loss in AGI: +$86,764 (reported on 41.4% of returns)
Here:
+$86,764
State:
+$19,082
(% of AGI for various income ranges: 0.3% for AGIs below $25k, 1.3% for AGIs $25k-50k, 1.5% for AGIs $50k-75k, 1.9% for AGIs $75k-100k, 3.1% for AGIs $100k-200k, 23.2% for AGIs over 200k)
Profit/loss from business: +$44,344 (reported on 22.5% of returns)
Here:
+$44,344
State:
+$15,240
(% of AGI for various income ranges: 7.1% for AGIs below $25k, 6.0% for AGIs $25k-50k, 5.5% for AGIs $50k-75k, 4.2% for AGIs $75k-100k, 7.0% for AGIs $100k-200k, 4.7% for AGIs over 200k)
Taxable individual retirement arrangement distribution: $38,924 (reported on 17.2% of returns)
38120:
$38,924
Tennessee:
$15,505
(% of AGI for various income ranges: 5.2% for AGIs below $25k, 3.4% for AGIs $25k-50k, 4.3% for AGIs $50k-75k, 4.4% for AGIs $75k-100k, 4.9% for AGIs $100k-200k, 3.0% for AGIs over 200k)
Self-employment retirement plans: $27,233 (reported on 3.8% of returns)
38120:
$27,233
Tennessee:
$22,567
(% of AGI for various income ranges: 0.6% for AGIs $50k-75k, 0.5% for AGIs $100k-200k, 0.6% for AGIs over 200k)
Total itemized deductions: $44,095 (13% of AGI, reported on 50.7% of returns)
Here:
$44,095
State:
$21,976
Here:
12.6% of AGI
State:
17.8% of AGI
(% of AGI for various income ranges: 24.4% for AGIs below $25k, 14.9% for AGIs $25k-50k, 15.0% for AGIs $50k-75k, 16.5% for AGIs $75k-100k, 16.0% for AGIs $100k-200k, 9.8% for AGIs over 200k)
Charity contributions: $15,942 (reported on 46.4% of returns)
Here:
$15,942
State:
$6,709
(% of AGI for various income ranges: 2.0% for AGIs below $25k, 2.2% for AGIs $25k-50k, 2.5% for AGIs $50k-75k, 3.1% for AGIs $75k-100k, 3.5% for AGIs $100k-200k, 4.0% for AGIs over 200k)
Taxes paid: $12,656 (reported on 50.1% of returns)
38120:
$12,656
State:
$4,829
(% of AGI for various income ranges: 5.2% for AGIs below $25k, 4.1% for AGIs $25k-50k, 4.4% for AGIs $50k-75k, 4.8% for AGIs $75k-100k, 5.0% for AGIs $100k-200k, 2.7% for AGIs over 200k)
Earned income credit: $1,812 (reported on 7.1% of returns)
Here:
$1,812
State:
$2,404
(% of AGI for various income ranges: 3.5% for AGIs below $25k, 0.4% for AGIs $25k-50k)
Percentage of individuals using paid preparers for their 2012 taxes: 60.0%
Here:
60%
State:
52%
(% for various income ranges: 53.3% for AGIs below $25k, 48.8% for AGIs $25k-50k, 53.9% for AGIs $50k-75k, 51.6% for AGIs $75k-100k, 65.3% for AGIs $100k-200k, 84.5% for AGIs over 200k)
Averages for the 2004 tax year for zip code 38120, filed in 2005:
Average Adjusted Gross Income (AGI) in 2004: $168,292 (Individual Income Tax Returns)
Here:
$168,292
State:
$44,088
Salary/wage: $116,637 (reported on 72.8% of returns)
Here:
$116,637
State:
$38,825
(% of AGI for various income ranges: 65.6% for AGIs $10k-25k, 71.7% for AGIs $25k-50k, 64.6% for AGIs $50k-75k, 64.3% for AGIs $75k-100k, 47.1% for AGIs over 100k)
Taxable interest for individuals: $8,355 (reported on 63.7% of returns)
This zip code:
$8,355
Tennessee:
$1,802
(% of AGI for various income ranges: 5.9% for AGIs $10k-25k, 3.5% for AGIs $25k-50k, 3.7% for AGIs $50k-75k, 3.3% for AGIs $75k-100k, 2.9% for AGIs over 100k)
Taxable dividends: $20,231 (reported on 54.0% of returns)
Here:
$20,231
State:
$3,727
(% of AGI for various income ranges: 6.1% for AGIs $10k-25k, 4.8% for AGIs $25k-50k, 4.9% for AGIs $50k-75k, 4.5% for AGIs $75k-100k, 6.6% for AGIs over 100k)
Net capital gain/loss: +$74,516 (reported on 48.9% of returns)
Here:
+$74,516
State:
+$15,776
(% of AGI for various income ranges: 1.8% for AGIs $10k-25k, 2.2% for AGIs $25k-50k, 1.9% for AGIs $50k-75k, 3.9% for AGIs $75k-100k, 24.4% for AGIs over 100k)
Profit/loss from business: +$44,214 (reported on 19.7% of returns)
Here:
+$44,214
State:
+$12,882
(% of AGI for various income ranges: 5.7% for AGIs $10k-25k, 4.3% for AGIs $25k-50k, 7.3% for AGIs $50k-75k, 7.1% for AGIs $75k-100k, 5.0% for AGIs over 100k)
IRA payment deduction: $3,790 (reported on 4.0% of returns)
38120:
$3,790
Tennessee:
$2,934
(% of AGI for various income ranges: 0.3% for AGIs $10k-25k, 0.4% for AGIs $25k-50k, 0.3% for AGIs $50k-75k, 0.3% for AGIs $75k-100k, 0.1% for AGIs over 100k)
Self-employed pension: $22,210 (reported on 4.4% of returns)
Here:
$22,210
Tennessee:
$16,857
(% of AGI for various income ranges: 0.2% for AGIs $25k-50k, 0.4% for AGIs $50k-75k, 0.4% for AGIs $75k-100k, 0.6% for AGIs over 100k)
Total itemized deductions: $39,881 (14% of AGI, reported on 50.0% of returns)
Here:
$39,881
State:
$18,035
Here:
13.5% of AGI
State:
19.9% of AGI
(% of AGI for various income ranges: 21.1% for AGIs $10k-25k, 18.9% for AGIs $25k-50k, 18.2% for AGIs $50k-75k, 17.5% for AGIs $75k-100k, 10.6% for AGIs over 100k)
Charity contributions deductions: $15,080 (5% of AGI, reported on 46.3% of returns)
Here:
$15,080
State:
$5,167
Here:
4.9% of AGI
State:
5.3% of AGI
(% of AGI for various income ranges: 2.1% for AGIs $10k-25k, 2.3% for AGIs $25k-50k, 3.2% for AGIs $50k-75k, 3.3% for AGIs $75k-100k, 4.3% for AGIs over 100k)
Total tax: $43,835 (reported on 81.8% of returns)
38120:
$43,835
State:
$7,482
(% of AGI for various income ranges: 4.6% for AGIs $10k-25k, 8.0% for AGIs $25k-50k, 10.5% for AGIs $50k-75k, 11.9% for AGIs $75k-100k, 22.9% for AGIs over 100k)
Earned income credit: $1,501 (reported on 4.9% of returns)
Here:
$1,501
State:
$1,826
Percentage of individuals using paid preparers for their 2004 taxes: 65.4%
Here:
65%
State:
60%
(% for various income ranges: 64.8% for AGIs below $10k, 59.8% for AGIs $10k-25k, 55.2% for AGIs $25k-50k, 61.4% for AGIs $50k-75k, 61.8% for AGIs $75k-100k, 77.5% for AGIs over 100k)
Household received Food Stamps/SNAP in the past 12 months: 161 Household did not receive Food Stamps/SNAP in the past 12 months: 6,409
Women who had a birth in the past 12 months: 92 (94 now married, 0 unmarried) Women who did not have a birth in the past 12 months: 2,662 (1,369 now married, 1,293 unmarried)
Housing units in zip code 38120 with a mortgage: 2,527 (215 second mortgage, 199 both second mortgage and home equity loan) Houses without a mortgage: 204
Median monthly owner costs for units with a mortgage: $2,180 Median monthly owner costs for units without a mortgage: $1,167
Residents with income below the poverty level in 2022:
This zip code:
6.2%
Whole state:
13.3%
Residents with income below 50% of the poverty level in 2022:
This zip code:
4.0%
Whole state:
7.1%
Median number of rooms in houses and condos:
Here:
8.3
State:
6.5
Median number of rooms in apartments:
Here:
4.0
State:
4.4
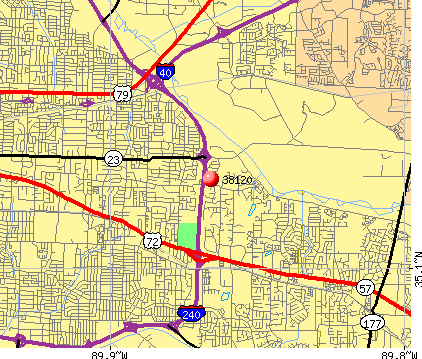
Notable locations in this zip code not listed on our city pages
Notable locations in zip code 38120: Ridgeway Country Club (A), Shelby County Landfill (B), City of Memphis Division of Fire Station 44 (C). Display/hide their locations on the map
Churches in zip code 38120 include: Shady Grove Presbyterian Church (A), First Evangelical Church (B), Brit Hadasha Messianic Jewish Congregation (C), Anshei Sphard-Beth El Emerth Synagogue (D), Richland Baptist Church (E). Display/hide their locations on the map
In group quarters: 52 (-1 institutionalized population)
Size of family households: 2,492 2-persons, 771 3-persons, 601 4-persons, 96 5-persons, 152 6-persons, 64 7-or-more-persons
Size of nonfamily households: 2,070 1-person, 225 2-persons, 43 3-persons
1,944 married couples with children.
340 single-parent households (78 men, 262 women).
95.5% of residents of 38120 zip code speak English at home.
0.5% of residents speak Spanish at home (76% very well, 23% well, 2% not at all).
2.2% of residents speak other Indo-European language at home (100% very well).
1.7% of residents speak Asian or Pacific Island language at home (50% very well, 46% well, 4% not well).
0.3% of residents speak other language at home (57% very well, 43% well).
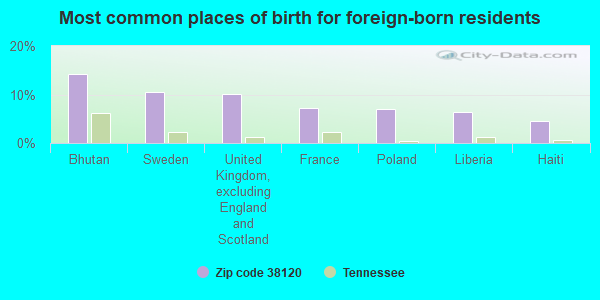
Foreign born population: 892 (6.5%) (69.4% of them are naturalized citizens)
This zip code:
6.5%
Whole state:
5.6%
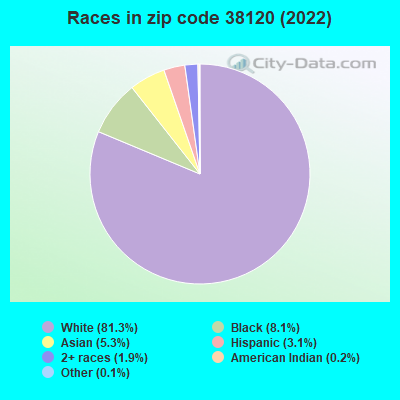
14%Bhutan
11%Sweden
10%United Kingdom, excluding England and Scotland
7%France
7%Poland
6%Liberia
5%Haiti
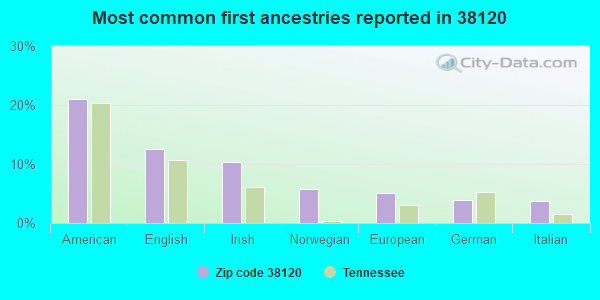
21%American
13%English
10%Irish
6%Norwegian
5%European
4%German
4%Italian
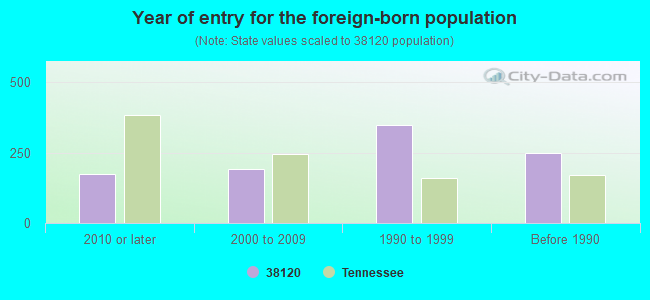
Year of entry for the foreign-born population
1742010 or later
1902000 to 2009
3481990 to 1999
247Before 1990
Private elementary/middle school in in this zip code not listed on the city page:
BRIARCREST CHRISTIAN MIDDLE SCHOOL (Students: 344, Location: 76 S HOUSTON LEVY RD, Grades: 6-8)
Facilities with environmental interests located in this zip code:
BRIARCREST CHRISTIAN SCHOOLS (6000 BRIARCREST in MEMPHIS, TN)
(Resource Conservation and Recovery Act (tracking hazardous waste)) Organizations: JOHN HOUSTON (CONTACT/OPERATOR)
AMERI-CAN PEDIGREED SEED CO (7664 MOORE ROAD in MEMPHIS, TN)
(Resource Conservation and Recovery Act (tracking hazardous waste))
AGROLINZ INC (1669 KIRBY PWY STE 100 in MEMPHIS, TN)
COMPLIANCE ACTIVITY (Tracking inspections of insecticide, fungicide, and rodenticide, and toxic substances)
AUTO CHLOR SYSTEMS OF SEATTLE (1000 REDGEWAY LOOP RD STE 100 in MEMPHIS, TN)
COMPLIANCE ACTIVITY (Tracking inspections of insecticide, fungicide, and rodenticide, and toxic substances)
Housing units lacking complete kitchen facilities: 1.6%
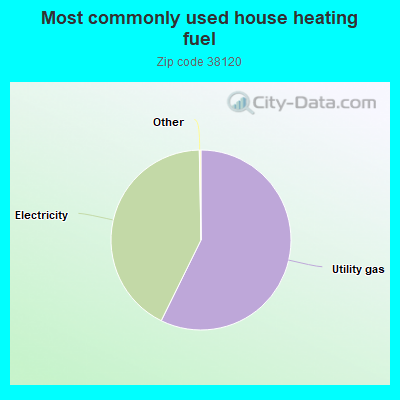
57.3%Utility gas
42.4%Electricity
Population in 1990: 12,552. Population change in the 1990s: +1,141 (+9.1%).
Place of birth for U.S.-born residents:
This state: 7,642
Northeast: 642
Midwest: 1,473
South: 2,422
West: 628
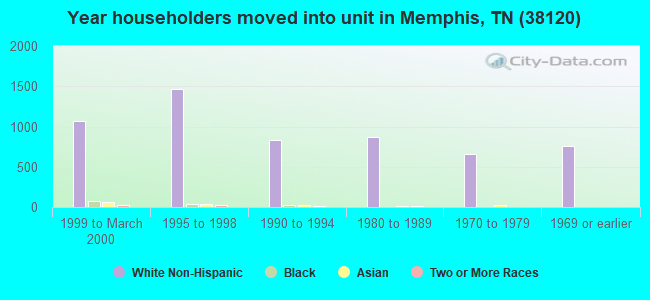
56% of the 38120 zip code residents lived in the same house 5 years ago. Out of people who lived in different houses, 68% lived in this county. Out of people who lived in different counties, 50% lived in Tennessee.
86% of the 38120 zip code residents lived in the same house 1 year ago. Out of people who lived in different houses, 73% moved from this county. Out of people who lived in different houses, 6% moved from different county within same state. Out of people who lived in different houses, 11% moved from different state. Out of people who lived in different houses, 4% moved from abroad.
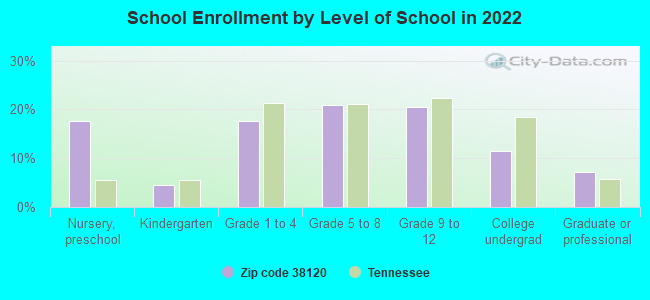
Private vs. public school enrollment:
Students in private schools in grades 1 to 8 (elementary and middle school): 604
Here:
56.4%
Tennessee:
15.0%
Students in private schools in grades 9 to 12 (high school): 338
Here:
59.8%
Tennessee:
16.2%
Students in private undergraduate colleges: 120
Here:
41.1%
Tennessee:
23.5%
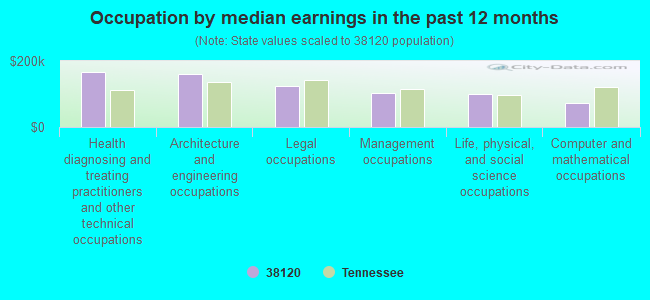
Occupation by median earnings in the past 12 months ($)
167,996Health diagnosing and treating practitioners and other technical occupations
160,384Architecture and engineering occupations
123,263Legal occupations
102,193Management occupations
99,021Life, physical, and social science occupations
72,461Computer and mathematical occupations
Companies with federal contracts located in this zip code (MEMPHIS, TN):
SERVICEMASTER RESIDENTIAL/COMM (860 RIDGE LAKE BLVD) : $6,600,000 in 2 contractsin 2001
$6,600,000 with Department of Defense for Other Housekeeping Services. Taking place in VA. Signed on 2001-11-13. Completion date: 2001-11-16.
$0, same as above.Signed on 2001-11-13. Completion date: 2001-11-16.
ALLEN & HOSHALL INC (1661 INTL DR STE 100; small business) : $2,144,716 in 103 contractsfrom 1999 to 2006
Contracts for Other Architect and Engineering Services, Other Buildings, Administrative and Service Buildings, Architect - Engineer Services (including landscaping, interior layout, and designing), and moreby Navy, Army Signed by year:2000: $1,586,455; 2001: $227,439; 2002: $360,219; 2003: $17,179; 2004: $0; 2005: -$3,527; 2006: -$63,690.
Biggest contracts:
$204,542 with Navy for Other Architect and Engineering Services. Taking place in NC. Signed on 2000-04-24. Completion date: 1999-12-30.
$159,041 with Navy for Other Architect and Engineering Services. Taking place in VA. Signed on 2000-03-21. Completion date: 1998-08-03.
$152,895 with Navy for Other Architect and Engineering Services. Signed on 2000-09-29. Completion date: 2001-02-04.
$145,983, same as above.Signed on 2000-05-12. Completion date: 2000-07-15.
SMPO PROPERTIES, INC (5858 RIDGEWAY CENTER PKY; small business) : $500,328 in 21 contractsfrom 2001 to 2005
Contracts for Installation of Equipment -- Alarm, Signal, and Security Detection Systems, Custodial Janitorial Services, Landscaping/Groundskeeping Services, Construction -- Operational Systems Development (R&D), and moreby Army Signed by year:2000: $0; 2001: $127,049; 2002: $145,825; 2003: $77,400; 2004: $43,656; 2005: $106,398; 2006: $0.
Biggest contracts:
$61,926 with Army for Installation of Equipment -- Alarm, Signal, and Security Detection Systems. Taking place in FL. Signed on 2001-09-28. Completion date: 2001-12-27.
$59,719 with Army for Custodial Janitorial Services. Taking place in FL. Signed on 2002-11-04. Completion date: 2003-09-30.
$43,656 with Army for Landscaping/Groundskeeping Services. Taking place in FL. Signed on 2004-12-09. Completion date: 2004-09-30.
$43,068 with Army for Custodial Janitorial Services. Taking place in GA. Signed on 2003-10-21. Completion date: 2004-09-30.
AEROTEST INTERNATIONAL INCORPO (6755 MASSEY LANE; small business)
$39,900 with Defense Logistics Agency for Miscellaneous Items. Signed on 2003-12-15. Completion date: 2004-03-08.
CENTER FOR EDUCATIONAL DEVELOP (1362 POPLAR RIDGETERM; small business)
$8,500 with Department of Defense for Intelligence Studies. Taking place in DC. Signed on 2005-08-08. Completion date: 2005-09-09.
TEL-XL (5462 MCGILL; small business)
$2,600 with Army for Telephone and Telegraph Equipment. Signed on 2004-06-02. Completion date: 2004-06-30.
SERVICEMASTER CONSUMER SERVICE (860 RIDGE LAKE BLVD FL 3)
$420 with Navy for Insect and Rodent Control Services. Taking place in AL. Signed on 2003-02-26. Completion date: 2004-02-26.
THE TERMINIX INTERNATIONAL CO (860 RIDGE LAKE BLVD) : $420 in 2 contractsin 2004
$420 with Army for Insect and Rodent Control Services. Taking place in UT. Signed on 2004-06-18. Completion date: 2005-06-30.
$0, same as above.Signed on 2004-06-18. Completion date: 2005-06-30.
Top industries in this zip code by the number of employees in 2005:
Health Care and Social Assistance: General Medical and Surgical Hospitals (over 1000: 1, 500-999: 1)
Health Care and Social Assistance: Offices of Physicians (except Mental Health Specialists) (250-499: 1, 100-249: 3, 50-99: 2, 20-49: 15, 10-19: 14, 5-9: 18, 1-4: 39)
Finance and Insurance: Third Party Administration of Insurance and Pension Funds (over 1000: 1, 50-99: 1, 10-19: 1, 1-4: 2)
Finance and Insurance: Claims Adjusting (over 1000: 1, 1-4: 2)
Other Services (except Public Administration): Environment, Conservation and Wildlife Organizations (500-999: 1)
Finance and Insurance: Other Direct Insurance (except Life, Health, and Medical) Carriers (500-999: 1)
2002 - 2018 National Fire Incident Reporting System (NFIRS) incidents
According to the data from the years 2002 - 2018 the average number of fires per year is 23. The highest number of reported fire incidents - 41 took place in 2007, and the least - 4 in 2004. The data has an increasing trend.
When looking into fire subcategories, the most incidents belonged to: Structure Fires (33.4%), and Mobile Property/Vehicle Fires (33.2%).
Fire incident types reported to NFIRS in Zip Code 38120
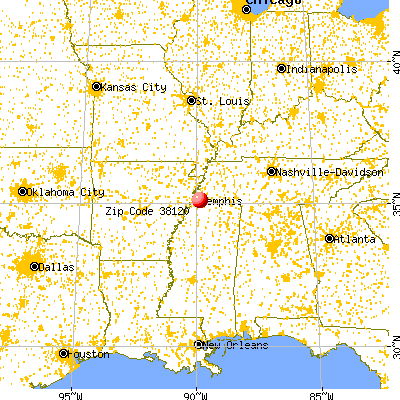


 Nearest zip codes: 38119, 38134, 38117, 38138, 38115, 38122.
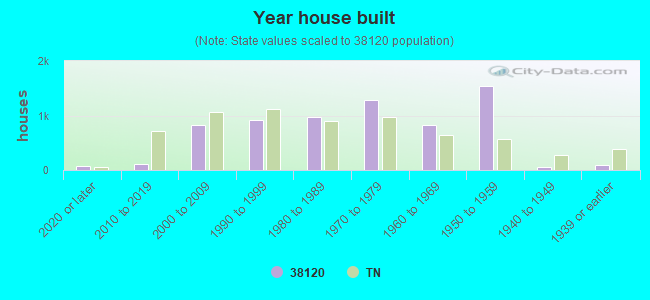


 (Students: 344, Location: 76 S HOUSTON LEVY RD, Grades: 6-8)
 According to the data from the years 2002 - 2018 the average number of fires per year is 23. The highest number of reported fire incidents - 41 took place in 2007, and the least - 4 in 2004. The data has an increasing trend.
 When looking into fire subcategories, the most incidents belonged to: Structure Fires (33.4%), and Mobile Property/Vehicle Fires (33.2%).