Germantown, Tennessee Submit your own pictures of this city and show them to the world
OSM Map
General Map
Google Map
MSN Map
OSM Map
General Map
Google Map
MSN Map
OSM Map
General Map
Google Map
MSN Map
OSM Map
General Map
Google Map
MSN Map
Please wait while loading the map...
Population in 2022: 40,816 (100% urban, 0% rural). Population change since 2000: +9.3%Males: 19,975 Females: 20,841
March 2022 cost of living index in Germantown: 88.0 (less than average, U.S. average is 100) Percentage of residents living in poverty in 2022: 2.4%for White Non-Hispanic residents , 7.3% for Black residents , 9.1% for other race residents , 1.7% for two or more races residents )
Profiles of local businesses
Business Search - 14 Million verified businesses
Data:
Median household income ($)
Median household income (% change since 2000)
Household income diversity
Ratio of average income to average house value (%)
Ratio of average income to average rent
Median household income ($) - White
Median household income ($) - Black or African American
Median household income ($) - Asian
Median household income ($) - Hispanic or Latino
Median household income ($) - American Indian and Alaska Native
Median household income ($) - Multirace
Median household income ($) - Other Race
Median household income for houses/condos with a mortgage ($)
Median household income for apartments without a mortgage ($)
Races - White alone (%)
Races - White alone (% change since 2000)
Races - Black alone (%)
Races - Black alone (% change since 2000)
Races - American Indian alone (%)
Races - American Indian alone (% change since 2000)
Races - Asian alone (%)
Races - Asian alone (% change since 2000)
Races - Hispanic (%)
Races - Hispanic (% change since 2000)
Races - Native Hawaiian and Other Pacific Islander alone (%)
Races - Native Hawaiian and Other Pacific Islander alone (% change since 2000)
Races - Two or more races (%)
Races - Two or more races (% change since 2000)
Races - Other race alone (%)
Races - Other race alone (% change since 2000)
Racial diversity
Unemployment (%)
Unemployment (% change since 2000)
Unemployment (%) - White
Unemployment (%) - Black or African American
Unemployment (%) - Asian
Unemployment (%) - Hispanic or Latino
Unemployment (%) - American Indian and Alaska Native
Unemployment (%) - Multirace
Unemployment (%) - Other Race
Population density (people per square mile)
Population - Males (%)
Population - Females (%)
Population - Males (%) - White
Population - Males (%) - Black or African American
Population - Males (%) - Asian
Population - Males (%) - Hispanic or Latino
Population - Males (%) - American Indian and Alaska Native
Population - Males (%) - Multirace
Population - Males (%) - Other Race
Population - Females (%) - White
Population - Females (%) - Black or African American
Population - Females (%) - Asian
Population - Females (%) - Hispanic or Latino
Population - Females (%) - American Indian and Alaska Native
Population - Females (%) - Multirace
Population - Females (%) - Other Race
Coronavirus confirmed cases (Apr 27, 2024)
Deaths caused by coronavirus (Apr 27, 2024)
Coronavirus confirmed cases (per 100k population) (Apr 27, 2024)
Deaths caused by coronavirus (per 100k population) (Apr 27, 2024)
Daily increase in number of cases (Apr 27, 2024)
Weekly increase in number of cases (Apr 27, 2024)
Cases doubled (in days) (Apr 27, 2024)
Hospitalized patients (Apr 18, 2022)
Negative test results (Apr 18, 2022)
Total test results (Apr 18, 2022)
COVID Vaccine doses distributed (per 100k population) (Sep 19, 2023)
COVID Vaccine doses administered (per 100k population) (Sep 19, 2023)
COVID Vaccine doses distributed (Sep 19, 2023)
COVID Vaccine doses administered (Sep 19, 2023)
Likely homosexual households (%)
Likely homosexual households (% change since 2000)
Likely homosexual households - Lesbian couples (%)
Likely homosexual households - Lesbian couples (% change since 2000)
Likely homosexual households - Gay men (%)
Likely homosexual households - Gay men (% change since 2000)
Cost of living index
Median gross rent ($)
Median contract rent ($)
Median monthly housing costs ($)
Median house or condo value ($)
Median house or condo value ($ change since 2000)
Mean house or condo value by units in structure - 1, detached ($)
Mean house or condo value by units in structure - 1, attached ($)
Mean house or condo value by units in structure - 2 ($)
Mean house or condo value by units in structure by units in structure - 3 or 4 ($)
Mean house or condo value by units in structure - 5 or more ($)
Mean house or condo value by units in structure - Boat, RV, van, etc. ($)
Mean house or condo value by units in structure - Mobile home ($)
Median house or condo value ($) - White
Median house or condo value ($) - Black or African American
Median house or condo value ($) - Asian
Median house or condo value ($) - Hispanic or Latino
Median house or condo value ($) - American Indian and Alaska Native
Median house or condo value ($) - Multirace
Median house or condo value ($) - Other Race
Median resident age
Resident age diversity
Median resident age - Males
Median resident age - Females
Median resident age - White
Median resident age - Black or African American
Median resident age - Asian
Median resident age - Hispanic or Latino
Median resident age - American Indian and Alaska Native
Median resident age - Multirace
Median resident age - Other Race
Median resident age - Males - White
Median resident age - Males - Black or African American
Median resident age - Males - Asian
Median resident age - Males - Hispanic or Latino
Median resident age - Males - American Indian and Alaska Native
Median resident age - Males - Multirace
Median resident age - Males - Other Race
Median resident age - Females - White
Median resident age - Females - Black or African American
Median resident age - Females - Asian
Median resident age - Females - Hispanic or Latino
Median resident age - Females - American Indian and Alaska Native
Median resident age - Females - Multirace
Median resident age - Females - Other Race
Commute - mean travel time to work (minutes)
Travel time to work - Less than 5 minutes (%)
Travel time to work - Less than 5 minutes (% change since 2000)
Travel time to work - 5 to 9 minutes (%)
Travel time to work - 5 to 9 minutes (% change since 2000)
Travel time to work - 10 to 19 minutes (%)
Travel time to work - 10 to 19 minutes (% change since 2000)
Travel time to work - 20 to 29 minutes (%)
Travel time to work - 20 to 29 minutes (% change since 2000)
Travel time to work - 30 to 39 minutes (%)
Travel time to work - 30 to 39 minutes (% change since 2000)
Travel time to work - 40 to 59 minutes (%)
Travel time to work - 40 to 59 minutes (% change since 2000)
Travel time to work - 60 to 89 minutes (%)
Travel time to work - 60 to 89 minutes (% change since 2000)
Travel time to work - 90 or more minutes (%)
Travel time to work - 90 or more minutes (% change since 2000)
Marital status - Never married (%)
Marital status - Now married (%)
Marital status - Separated (%)
Marital status - Widowed (%)
Marital status - Divorced (%)
Median family income ($)
Median family income (% change since 2000)
Median non-family income ($)
Median non-family income (% change since 2000)
Median per capita income ($)
Median per capita income (% change since 2000)
Median family income ($) - White
Median family income ($) - Black or African American
Median family income ($) - Asian
Median family income ($) - Hispanic or Latino
Median family income ($) - American Indian and Alaska Native
Median family income ($) - Multirace
Median family income ($) - Other Race
Median year house/condo built
Median year apartment built
Year house built - Built 2005 or later (%)
Year house built - Built 2000 to 2004 (%)
Year house built - Built 1990 to 1999 (%)
Year house built - Built 1980 to 1989 (%)
Year house built - Built 1970 to 1979 (%)
Year house built - Built 1960 to 1969 (%)
Year house built - Built 1950 to 1959 (%)
Year house built - Built 1940 to 1949 (%)
Year house built - Built 1939 or earlier (%)
Average household size
Household density (households per square mile)
Average household size - White
Average household size - Black or African American
Average household size - Asian
Average household size - Hispanic or Latino
Average household size - American Indian and Alaska Native
Average household size - Multirace
Average household size - Other Race
Occupied housing units (%)
Vacant housing units (%)
Owner occupied housing units (%)
Renter occupied housing units (%)
Vacancy status - For rent (%)
Vacancy status - For sale only (%)
Vacancy status - Rented or sold, not occupied (%)
Vacancy status - For seasonal, recreational, or occasional use (%)
Vacancy status - For migrant workers (%)
Vacancy status - Other vacant (%)
Residents with income below the poverty level (%)
Residents with income below 50% of the poverty level (%)
Children below poverty level (%)
Poor families by family type - Married-couple family (%)
Poor families by family type - Male, no wife present (%)
Poor families by family type - Female, no husband present (%)
Poverty status for native-born residents (%)
Poverty status for foreign-born residents (%)
Poverty among high school graduates not in families (%)
Poverty among people who did not graduate high school not in families (%)
Residents with income below the poverty level (%) - White
Residents with income below the poverty level (%) - Black or African American
Residents with income below the poverty level (%) - Asian
Residents with income below the poverty level (%) - Hispanic or Latino
Residents with income below the poverty level (%) - American Indian and Alaska Native
Residents with income below the poverty level (%) - Multirace
Residents with income below the poverty level (%) - Other Race
Air pollution - Air Quality Index (AQI)
Air pollution - CO
Air pollution - NO2
Air pollution - SO2
Air pollution - Ozone
Air pollution - PM10
Air pollution - PM25
Air pollution - Pb
Crime - Murders per 100,000 population
Crime - Rapes per 100,000 population
Crime - Robberies per 100,000 population
Crime - Assaults per 100,000 population
Crime - Burglaries per 100,000 population
Crime - Thefts per 100,000 population
Crime - Auto thefts per 100,000 population
Crime - Arson per 100,000 population
Crime - City-data.com crime index
Crime - Violent crime index
Crime - Property crime index
Crime - Murders per 100,000 population (5 year average)
Crime - Rapes per 100,000 population (5 year average)
Crime - Robberies per 100,000 population (5 year average)
Crime - Assaults per 100,000 population (5 year average)
Crime - Burglaries per 100,000 population (5 year average)
Crime - Thefts per 100,000 population (5 year average)
Crime - Auto thefts per 100,000 population (5 year average)
Crime - Arson per 100,000 population (5 year average)
Crime - City-data.com crime index (5 year average)
Crime - Violent crime index (5 year average)
Crime - Property crime index (5 year average)
1996 Presidential Elections Results (%) - Democratic Party (Clinton)
1996 Presidential Elections Results (%) - Republican Party (Dole)
1996 Presidential Elections Results (%) - Other
2000 Presidential Elections Results (%) - Democratic Party (Gore)
2000 Presidential Elections Results (%) - Republican Party (Bush)
2000 Presidential Elections Results (%) - Other
2004 Presidential Elections Results (%) - Democratic Party (Kerry)
2004 Presidential Elections Results (%) - Republican Party (Bush)
2004 Presidential Elections Results (%) - Other
2008 Presidential Elections Results (%) - Democratic Party (Obama)
2008 Presidential Elections Results (%) - Republican Party (McCain)
2008 Presidential Elections Results (%) - Other
2012 Presidential Elections Results (%) - Democratic Party (Obama)
2012 Presidential Elections Results (%) - Republican Party (Romney)
2012 Presidential Elections Results (%) - Other
2016 Presidential Elections Results (%) - Democratic Party (Clinton)
2016 Presidential Elections Results (%) - Republican Party (Trump)
2016 Presidential Elections Results (%) - Other
2020 Presidential Elections Results (%) - Democratic Party (Biden)
2020 Presidential Elections Results (%) - Republican Party (Trump)
2020 Presidential Elections Results (%) - Other
Ancestries Reported - Arab (%)
Ancestries Reported - Czech (%)
Ancestries Reported - Danish (%)
Ancestries Reported - Dutch (%)
Ancestries Reported - English (%)
Ancestries Reported - French (%)
Ancestries Reported - French Canadian (%)
Ancestries Reported - German (%)
Ancestries Reported - Greek (%)
Ancestries Reported - Hungarian (%)
Ancestries Reported - Irish (%)
Ancestries Reported - Italian (%)
Ancestries Reported - Lithuanian (%)
Ancestries Reported - Norwegian (%)
Ancestries Reported - Polish (%)
Ancestries Reported - Portuguese (%)
Ancestries Reported - Russian (%)
Ancestries Reported - Scotch-Irish (%)
Ancestries Reported - Scottish (%)
Ancestries Reported - Slovak (%)
Ancestries Reported - Subsaharan African (%)
Ancestries Reported - Swedish (%)
Ancestries Reported - Swiss (%)
Ancestries Reported - Ukrainian (%)
Ancestries Reported - United States (%)
Ancestries Reported - Welsh (%)
Ancestries Reported - West Indian (%)
Ancestries Reported - Other (%)
Educational Attainment - No schooling completed (%)
Educational Attainment - Less than high school (%)
Educational Attainment - High school or equivalent (%)
Educational Attainment - Less than 1 year of college (%)
Educational Attainment - 1 or more years of college (%)
Educational Attainment - Associate degree (%)
Educational Attainment - Bachelor's degree (%)
Educational Attainment - Master's degree (%)
Educational Attainment - Professional school degree (%)
Educational Attainment - Doctorate degree (%)
School Enrollment - Nursery, preschool (%)
School Enrollment - Kindergarten (%)
School Enrollment - Grade 1 to 4 (%)
School Enrollment - Grade 5 to 8 (%)
School Enrollment - Grade 9 to 12 (%)
School Enrollment - College undergrad (%)
School Enrollment - Graduate or professional (%)
School Enrollment - Not enrolled in school (%)
School enrollment - Public schools (%)
School enrollment - Private schools (%)
School enrollment - Not enrolled (%)
Median number of rooms in houses and condos
Median number of rooms in apartments
Housing units lacking complete plumbing facilities (%)
Housing units lacking complete kitchen facilities (%)
Density of houses
Urban houses (%)
Rural houses (%)
Households with people 60 years and over (%)
Households with people 65 years and over (%)
Households with people 75 years and over (%)
Households with one or more nonrelatives (%)
Households with no nonrelatives (%)
Population in households (%)
Family households (%)
Nonfamily households (%)
Population in families (%)
Family households with own children (%)
Median number of bedrooms in owner occupied houses
Mean number of bedrooms in owner occupied houses
Median number of bedrooms in renter occupied houses
Mean number of bedrooms in renter occupied houses
Median number of vehichles in owner occupied houses
Mean number of vehichles in owner occupied houses
Median number of vehichles in renter occupied houses
Mean number of vehichles in renter occupied houses
Mortgage status - with mortgage (%)
Mortgage status - with second mortgage (%)
Mortgage status - with home equity loan (%)
Mortgage status - with both second mortgage and home equity loan (%)
Mortgage status - without a mortgage (%)
Average family size
Average family size - White
Average family size - Black or African American
Average family size - Asian
Average family size - Hispanic or Latino
Average family size - American Indian and Alaska Native
Average family size - Multirace
Average family size - Other Race
Geographical mobility - Same house 1 year ago (%)
Geographical mobility - Moved within same county (%)
Geographical mobility - Moved from different county within same state (%)
Geographical mobility - Moved from different state (%)
Geographical mobility - Moved from abroad (%)
Place of birth - Born in state of residence (%)
Place of birth - Born in other state (%)
Place of birth - Native, outside of US (%)
Place of birth - Foreign born (%)
Housing units in structures - 1, detached (%)
Housing units in structures - 1, attached (%)
Housing units in structures - 2 (%)
Housing units in structures - 3 or 4 (%)
Housing units in structures - 5 to 9 (%)
Housing units in structures - 10 to 19 (%)
Housing units in structures - 20 to 49 (%)
Housing units in structures - 50 or more (%)
Housing units in structures - Mobile home (%)
Housing units in structures - Boat, RV, van, etc. (%)
House/condo owner moved in on average (years ago)
Renter moved in on average (years ago)
Year householder moved into unit - Moved in 1999 to March 2000 (%)
Year householder moved into unit - Moved in 1995 to 1998 (%)
Year householder moved into unit - Moved in 1990 to 1994 (%)
Year householder moved into unit - Moved in 1980 to 1989 (%)
Year householder moved into unit - Moved in 1970 to 1979 (%)
Year householder moved into unit - Moved in 1969 or earlier (%)
Means of transportation to work - Drove car alone (%)
Means of transportation to work - Carpooled (%)
Means of transportation to work - Public transportation (%)
Means of transportation to work - Bus or trolley bus (%)
Means of transportation to work - Streetcar or trolley car (%)
Means of transportation to work - Subway or elevated (%)
Means of transportation to work - Railroad (%)
Means of transportation to work - Ferryboat (%)
Means of transportation to work - Taxicab (%)
Means of transportation to work - Motorcycle (%)
Means of transportation to work - Bicycle (%)
Means of transportation to work - Walked (%)
Means of transportation to work - Other means (%)
Working at home (%)
Industry diversity
Most Common Industries - Agriculture, forestry, fishing and hunting, and mining (%)
Most Common Industries - Agriculture, forestry, fishing and hunting (%)
Most Common Industries - Mining, quarrying, and oil and gas extraction (%)
Most Common Industries - Construction (%)
Most Common Industries - Manufacturing (%)
Most Common Industries - Wholesale trade (%)
Most Common Industries - Retail trade (%)
Most Common Industries - Transportation and warehousing, and utilities (%)
Most Common Industries - Transportation and warehousing (%)
Most Common Industries - Utilities (%)
Most Common Industries - Information (%)
Most Common Industries - Finance and insurance, and real estate and rental and leasing (%)
Most Common Industries - Finance and insurance (%)
Most Common Industries - Real estate and rental and leasing (%)
Most Common Industries - Professional, scientific, and management, and administrative and waste management services (%)
Most Common Industries - Professional, scientific, and technical services (%)
Most Common Industries - Management of companies and enterprises (%)
Most Common Industries - Administrative and support and waste management services (%)
Most Common Industries - Educational services, and health care and social assistance (%)
Most Common Industries - Educational services (%)
Most Common Industries - Health care and social assistance (%)
Most Common Industries - Arts, entertainment, and recreation, and accommodation and food services (%)
Most Common Industries - Arts, entertainment, and recreation (%)
Most Common Industries - Accommodation and food services (%)
Most Common Industries - Other services, except public administration (%)
Most Common Industries - Public administration (%)
Occupation diversity
Most Common Occupations - Management, business, science, and arts occupations (%)
Most Common Occupations - Management, business, and financial occupations (%)
Most Common Occupations - Management occupations (%)
Most Common Occupations - Business and financial operations occupations (%)
Most Common Occupations - Computer, engineering, and science occupations (%)
Most Common Occupations - Computer and mathematical occupations (%)
Most Common Occupations - Architecture and engineering occupations (%)
Most Common Occupations - Life, physical, and social science occupations (%)
Most Common Occupations - Education, legal, community service, arts, and media occupations (%)
Most Common Occupations - Community and social service occupations (%)
Most Common Occupations - Legal occupations (%)
Most Common Occupations - Education, training, and library occupations (%)
Most Common Occupations - Arts, design, entertainment, sports, and media occupations (%)
Most Common Occupations - Healthcare practitioners and technical occupations (%)
Most Common Occupations - Health diagnosing and treating practitioners and other technical occupations (%)
Most Common Occupations - Health technologists and technicians (%)
Most Common Occupations - Service occupations (%)
Most Common Occupations - Healthcare support occupations (%)
Most Common Occupations - Protective service occupations (%)
Most Common Occupations - Fire fighting and prevention, and other protective service workers including supervisors (%)
Most Common Occupations - Law enforcement workers including supervisors (%)
Most Common Occupations - Food preparation and serving related occupations (%)
Most Common Occupations - Building and grounds cleaning and maintenance occupations (%)
Most Common Occupations - Personal care and service occupations (%)
Most Common Occupations - Sales and office occupations (%)
Most Common Occupations - Sales and related occupations (%)
Most Common Occupations - Office and administrative support occupations (%)
Most Common Occupations - Natural resources, construction, and maintenance occupations (%)
Most Common Occupations - Farming, fishing, and forestry occupations (%)
Most Common Occupations - Construction and extraction occupations (%)
Most Common Occupations - Installation, maintenance, and repair occupations (%)
Most Common Occupations - Production, transportation, and material moving occupations (%)
Most Common Occupations - Production occupations (%)
Most Common Occupations - Transportation occupations (%)
Most Common Occupations - Material moving occupations (%)
People in Group quarters - Institutionalized population (%)
People in Group quarters - Correctional institutions (%)
People in Group quarters - Federal prisons and detention centers (%)
People in Group quarters - Halfway houses (%)
People in Group quarters - Local jails and other confinement facilities (including police lockups) (%)
People in Group quarters - Military disciplinary barracks (%)
People in Group quarters - State prisons (%)
People in Group quarters - Other types of correctional institutions (%)
People in Group quarters - Nursing homes (%)
People in Group quarters - Hospitals/wards, hospices, and schools for the handicapped (%)
People in Group quarters - Hospitals/wards and hospices for chronically ill (%)
People in Group quarters - Hospices or homes for chronically ill (%)
People in Group quarters - Military hospitals or wards for chronically ill (%)
People in Group quarters - Other hospitals or wards for chronically ill (%)
People in Group quarters - Hospitals or wards for drug/alcohol abuse (%)
People in Group quarters - Mental (Psychiatric) hospitals or wards (%)
People in Group quarters - Schools, hospitals, or wards for the mentally retarded (%)
People in Group quarters - Schools, hospitals, or wards for the physically handicapped (%)
People in Group quarters - Institutions for the deaf (%)
People in Group quarters - Institutions for the blind (%)
People in Group quarters - Orthopedic wards and institutions for the physically handicapped (%)
People in Group quarters - Wards in general hospitals for patients who have no usual home elsewhere (%)
People in Group quarters - Wards in military hospitals for patients who have no usual home elsewhere (%)
People in Group quarters - Juvenile institutions (%)
People in Group quarters - Long-term care (%)
People in Group quarters - Homes for abused, dependent, and neglected children (%)
People in Group quarters - Residential treatment centers for emotionally disturbed children (%)
People in Group quarters - Training schools for juvenile delinquents (%)
People in Group quarters - Short-term care, detention or diagnostic centers for delinquent children (%)
People in Group quarters - Type of juvenile institution unknown (%)
People in Group quarters - Noninstitutionalized population (%)
People in Group quarters - College dormitories (includes college quarters off campus) (%)
People in Group quarters - Military quarters (%)
People in Group quarters - On base (%)
People in Group quarters - Barracks, unaccompanied personnel housing (UPH), (Enlisted/Officer), ;and similar group living quarters for military personnel (%)
People in Group quarters - Transient quarters for temporary residents (%)
People in Group quarters - Military ships (%)
People in Group quarters - Group homes (%)
People in Group quarters - Homes or halfway houses for drug/alcohol abuse (%)
People in Group quarters - Homes for the mentally ill (%)
People in Group quarters - Homes for the mentally retarded (%)
People in Group quarters - Homes for the physically handicapped (%)
People in Group quarters - Other group homes (%)
People in Group quarters - Religious group quarters (%)
People in Group quarters - Dormitories (%)
People in Group quarters - Agriculture workers' dormitories on farms (%)
People in Group quarters - Job Corps and vocational training facilities (%)
People in Group quarters - Other workers' dormitories (%)
People in Group quarters - Crews of maritime vessels (%)
People in Group quarters - Other nonhousehold living situations (%)
People in Group quarters - Other noninstitutional group quarters (%)
Residents speaking English at home (%)
Residents speaking English at home - Born in the United States (%)
Residents speaking English at home - Native, born elsewhere (%)
Residents speaking English at home - Foreign born (%)
Residents speaking Spanish at home (%)
Residents speaking Spanish at home - Born in the United States (%)
Residents speaking Spanish at home - Native, born elsewhere (%)
Residents speaking Spanish at home - Foreign born (%)
Residents speaking other language at home (%)
Residents speaking other language at home - Born in the United States (%)
Residents speaking other language at home - Native, born elsewhere (%)
Residents speaking other language at home - Foreign born (%)
Class of Workers - Employee of private company (%)
Class of Workers - Self-employed in own incorporated business (%)
Class of Workers - Private not-for-profit wage and salary workers (%)
Class of Workers - Local government workers (%)
Class of Workers - State government workers (%)
Class of Workers - Federal government workers (%)
Class of Workers - Self-employed workers in own not incorporated business and Unpaid family workers (%)
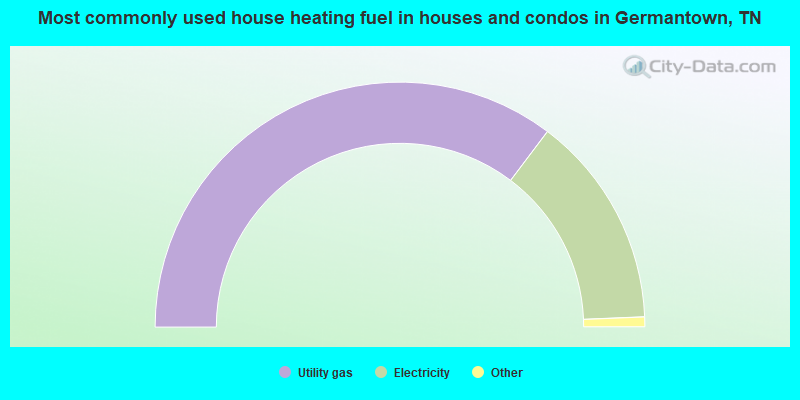
House heating fuel used in houses and condos - Utility gas (%)
House heating fuel used in houses and condos - Bottled, tank, or LP gas (%)
House heating fuel used in houses and condos - Electricity (%)
House heating fuel used in houses and condos - Fuel oil, kerosene, etc. (%)
House heating fuel used in houses and condos - Coal or coke (%)
House heating fuel used in houses and condos - Wood (%)
House heating fuel used in houses and condos - Solar energy (%)
House heating fuel used in houses and condos - Other fuel (%)
House heating fuel used in houses and condos - No fuel used (%)
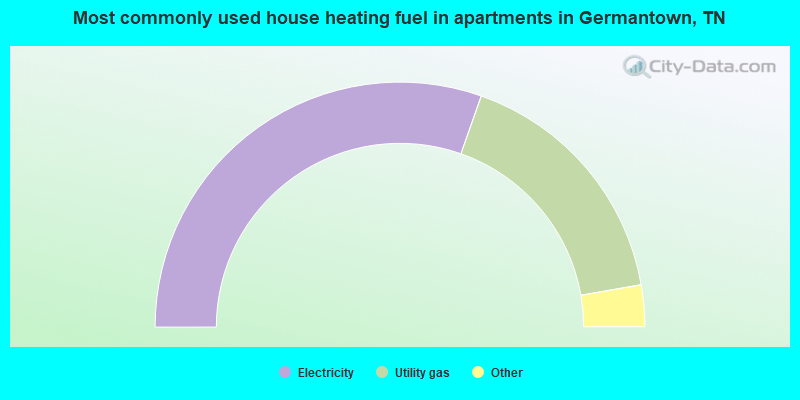
House heating fuel used in apartments - Utility gas (%)
House heating fuel used in apartments - Bottled, tank, or LP gas (%)
House heating fuel used in apartments - Electricity (%)
House heating fuel used in apartments - Fuel oil, kerosene, etc. (%)
House heating fuel used in apartments - Coal or coke (%)
House heating fuel used in apartments - Wood (%)
House heating fuel used in apartments - Solar energy (%)
House heating fuel used in apartments - Other fuel (%)
House heating fuel used in apartments - No fuel used (%)
Armed forces status - In Armed Forces (%)
Armed forces status - Civilian (%)
Armed forces status - Civilian - Veteran (%)
Armed forces status - Civilian - Nonveteran (%)
Fatal accidents locations in years 2005-2021
Fatal accidents locations in 2005
Fatal accidents locations in 2006
Fatal accidents locations in 2007
Fatal accidents locations in 2008
Fatal accidents locations in 2009
Fatal accidents locations in 2010
Fatal accidents locations in 2011
Fatal accidents locations in 2012
Fatal accidents locations in 2013
Fatal accidents locations in 2014
Fatal accidents locations in 2015
Fatal accidents locations in 2016
Fatal accidents locations in 2017
Fatal accidents locations in 2018
Fatal accidents locations in 2019
Fatal accidents locations in 2020
Fatal accidents locations in 2021
Alcohol use - People drinking some alcohol every month (%)
Alcohol use - People not drinking at all (%)
Alcohol use - Average days/month drinking alcohol
Alcohol use - Average drinks/week
Alcohol use - Average days/year people drink much
Audiometry - Average condition of hearing (%)
Audiometry - People that can hear a whisper from across a quiet room (%)
Audiometry - People that can hear normal voice from across a quiet room (%)
Audiometry - Ears ringing, roaring, buzzing (%)
Audiometry - Had a job exposure to loud noise (%)
Audiometry - Had off-work exposure to loud noise (%)
Blood Pressure & Cholesterol - Has high blood pressure (%)
Blood Pressure & Cholesterol - Checking blood pressure at home (%)
Blood Pressure & Cholesterol - Frequently checking blood cholesterol (%)
Blood Pressure & Cholesterol - Has high cholesterol level (%)
Consumer Behavior - Money monthly spent on food at supermarket/grocery store
Consumer Behavior - Money monthly spent on food at other stores
Consumer Behavior - Money monthly spent on eating out
Consumer Behavior - Money monthly spent on carryout/delivered foods
Consumer Behavior - Income spent on food at supermarket/grocery store (%)
Consumer Behavior - Income spent on food at other stores (%)
Consumer Behavior - Income spent on eating out (%)
Consumer Behavior - Income spent on carryout/delivered foods (%)
Current Health Status - General health condition (%)
Current Health Status - Blood donors (%)
Current Health Status - Has blood ever tested for HIV virus (%)
Current Health Status - Left-handed people (%)
Dermatology - People using sunscreen (%)
Diabetes - Diabetics (%)
Diabetes - Had a blood test for high blood sugar (%)
Diabetes - People taking insulin (%)
Diet Behavior & Nutrition - Diet health (%)
Diet Behavior & Nutrition - Milk product consumption (# of products/month)
Diet Behavior & Nutrition - Meals not home prepared (#/week)
Diet Behavior & Nutrition - Meals from fast food or pizza place (#/week)
Diet Behavior & Nutrition - Ready-to-eat foods (#/month)
Diet Behavior & Nutrition - Frozen meals/pizza (#/month)
Drug Use - People that ever used marijuana or hashish (%)
Drug Use - Ever used hard drugs (%)
Drug Use - Ever used any form of cocaine (%)
Drug Use - Ever used heroin (%)
Drug Use - Ever used methamphetamine (%)
Health Insurance - People covered by health insurance (%)
Kidney Conditions-Urology - Avg. # of times urinating at night
Medical Conditions - People with asthma (%)
Medical Conditions - People with anemia (%)
Medical Conditions - People with psoriasis (%)
Medical Conditions - People with overweight (%)
Medical Conditions - Elderly people having difficulties in thinking or remembering (%)
Medical Conditions - People who ever received blood transfusion (%)
Medical Conditions - People having trouble seeing even with glass/contacts (%)
Medical Conditions - People with arthritis (%)
Medical Conditions - People with gout (%)
Medical Conditions - People with congestive heart failure (%)
Medical Conditions - People with coronary heart disease (%)
Medical Conditions - People with angina pectoris (%)
Medical Conditions - People who ever had heart attack (%)
Medical Conditions - People who ever had stroke (%)
Medical Conditions - People with emphysema (%)
Medical Conditions - People with thyroid problem (%)
Medical Conditions - People with chronic bronchitis (%)
Medical Conditions - People with any liver condition (%)
Medical Conditions - People who ever had cancer or malignancy (%)
Mental Health - People who have little interest in doing things (%)
Mental Health - People feeling down, depressed, or hopeless (%)
Mental Health - People who have trouble sleeping or sleeping too much (%)
Mental Health - People feeling tired or having little energy (%)
Mental Health - People with poor appetite or overeating (%)
Mental Health - People feeling bad about themself (%)
Mental Health - People who have trouble concentrating on things (%)
Mental Health - People moving or speaking slowly or too fast (%)
Mental Health - People having thoughts they would be better off dead (%)
Oral Health - Average years since last visit a dentist
Oral Health - People embarrassed because of mouth (%)
Oral Health - People with gum disease (%)
Oral Health - General health of teeth and gums (%)
Oral Health - Average days a week using dental floss/device
Oral Health - Average days a week using mouthwash for dental problem
Oral Health - Average number of teeth
Pesticide Use - Households using pesticides to control insects (%)
Pesticide Use - Households using pesticides to kill weeds (%)
Physical Activity - People doing vigorous-intensity work activities (%)
Physical Activity - People doing moderate-intensity work activities (%)
Physical Activity - People walking or bicycling (%)
Physical Activity - People doing vigorous-intensity recreational activities (%)
Physical Activity - People doing moderate-intensity recreational activities (%)
Physical Activity - Average hours a day doing sedentary activities
Physical Activity - Average hours a day watching TV or videos
Physical Activity - Average hours a day using computer
Physical Functioning - People having limitations keeping them from working (%)
Physical Functioning - People limited in amount of work they can do (%)
Physical Functioning - People that need special equipment to walk (%)
Physical Functioning - People experiencing confusion/memory problems (%)
Physical Functioning - People requiring special healthcare equipment (%)
Prescription Medications - Average number of prescription medicines taking
Preventive Aspirin Use - Adults 40+ taking low-dose aspirin (%)
Reproductive Health - Vaginal deliveries (%)
Reproductive Health - Cesarean deliveries (%)
Reproductive Health - Deliveries resulted in a live birth (%)
Reproductive Health - Pregnancies resulted in a delivery (%)
Reproductive Health - Women breastfeeding newborns (%)
Reproductive Health - Women that had a hysterectomy (%)
Reproductive Health - Women that had both ovaries removed (%)
Reproductive Health - Women that have ever taken birth control pills (%)
Reproductive Health - Women taking birth control pills (%)
Reproductive Health - Women that have ever used Depo-Provera or injectables (%)
Reproductive Health - Women that have ever used female hormones (%)
Sexual Behavior - People 18+ that ever had sex (vaginal, anal, or oral) (%)
Sexual Behavior - Males 18+ that ever had vaginal sex with a woman (%)
Sexual Behavior - Males 18+ that ever performed oral sex on a woman (%)
Sexual Behavior - Males 18+ that ever had anal sex with a woman (%)
Sexual Behavior - Males 18+ that ever had any sex with a man (%)
Sexual Behavior - Females 18+ that ever had vaginal sex with a man (%)
Sexual Behavior - Females 18+ that ever performed oral sex on a man (%)
Sexual Behavior - Females 18+ that ever had anal sex with a man (%)
Sexual Behavior - Females 18+ that ever had any kind of sex with a woman (%)
Sexual Behavior - Average age people first had sex
Sexual Behavior - Average number of female sex partners in lifetime (males 18+)
Sexual Behavior - Average number of female vaginal sex partners in lifetime (males 18+)
Sexual Behavior - Average age people first performed oral sex on a woman (18+)
Sexual Behavior - Average number of woman performed oral sex on in lifetime (18+)
Sexual Behavior - Average number of male sex partners in lifetime (males 18+)
Sexual Behavior - Average number of male anal sex partners in lifetime (males 18+)
Sexual Behavior - Average age people first performed oral sex on a man (18+)
Sexual Behavior - Average number of male oral sex partners in lifetime (18+)
Sexual Behavior - People using protection when performing oral sex (%)
Sexual Behavior - Average number of times people have vaginal or anal sex a year
Sexual Behavior - People having sex without condom (%)
Sexual Behavior - Average number of male sex partners in lifetime (females 18+)
Sexual Behavior - Average number of male vaginal sex partners in lifetime (females 18+)
Sexual Behavior - Average number of female sex partners in lifetime (females 18+)
Sexual Behavior - Circumcised males 18+ (%)
Sleep Disorders - Average hours sleeping at night
Sleep Disorders - People that has trouble sleeping (%)
Smoking-Cigarette Use - People smoking cigarettes (%)
Taste & Smell - People 40+ having problems with smell (%)
Taste & Smell - People 40+ having problems with taste (%)
Taste & Smell - People 40+ that ever had wisdom teeth removed (%)
Taste & Smell - People 40+ that ever had tonsils teeth removed (%)
Taste & Smell - People 40+ that ever had a loss of consciousness because of a head injury (%)
Taste & Smell - People 40+ that ever had a broken nose or other serious injury to face or skull (%)
Taste & Smell - People 40+ that ever had two or more sinus infections (%)
Weight - Average height (inches)
Weight - Average weight (pounds)
Weight - Average BMI
Weight - People that are obese (%)
Weight - People that ever were obese (%)
Weight - People trying to lose weight (%)
According to our research of Tennessee and other state lists, there were 10 registered sex offenders living in Germantown, Tennessee as of April 27, 2024 . The ratio of all residents to sex offenders in Germantown is 3,911 to 1.The ratio of registered sex offenders to all residents in this city is much lower than the state average.
Officers per 1,000 residents here:
2.70Tennessee average:
2.57
Latest news from Germantown, TN collected exclusively by city-data.com from local newspapers, TV, and radio stations
Germantown, TN City Guides: Ancestries: American (29.8%), English (14.2%), Irish (5.3%), German (4.8%), Italian (4.1%), European (3.6%).
Current Local Time:
Land area: 17.6 square miles.
Population density: 2,321 people per square mile (low).
3,451 residents are foreign born (4.9% Asia , 1.1% Latin America , 1.0% Europe ).
This city:
8.5%Tennessee:
5.4%
Median real estate property taxes paid for housing units with mortgages in 2022: $4,497 (0.9%)Median real estate property taxes paid for housing units with no mortgage in 2022: $4,649 (0.9%)
Nearest city with pop. 50,000+: Memphis, TN
Nearest city with pop. 1,000,000+: Dallas, TX
Nearest cities:
Latitude: 35.09 N, Longitude: 89.79 W
Daytime population change due to commuting: +1,893 (+4.7%)Workers who live and work in this city: 5,665 (29.7%)
Area code commonly used in this area: 901
Property values in Germantown, TN
Germantown tourist attractions:
Unemployment in December 2023:
Population change in the 1990s: +4,206 (+12.7%).
Most common occupations in Germantown, TN (%)
Both Males Females
Sales representatives, services, wholesale and manufacturing (7.7%)
Other management occupations, except farmers and farm managers (7.3%)
Top executives (6.0%)
Other sales and related occupations, including supervisors (5.4%)
Retail sales workers, except cashiers (4.6%)
Preschool, kindergarten, elementary, and middle school teachers (3.6%)
Other office and administrative support workers, including supervisors (3.2%)
Sales representatives, services, wholesale and manufacturing (10.3%)
Top executives (9.0%)
Other management occupations, except farmers and farm managers (8.9%)
Other sales and related occupations, including supervisors (5.6%)
Aircraft and traffic control occupations (4.6%)
Advertising, marketing, promotions, public relations, and sales managers (4.4%)
Physicians and surgeons (3.8%)
Preschool, kindergarten, elementary, and middle school teachers (8.2%)
Secretaries and administrative assistants (6.8%)
Retail sales workers, except cashiers (6.0%)
Other office and administrative support workers, including supervisors (5.1%)
Other sales and related occupations, including supervisors (5.1%)
Other management occupations, except farmers and farm managers (5.0%)
Registered nurses (4.7%)
Tornado activity:
Germantown-area historical tornado activity is slightly above Tennessee state average. It is 96% greater than the overall U.S. average.
On 3/21/1952, a category F4 (max. wind speeds 207-260 mph) tornado 16.5 miles away from the Germantown city center killed 16 people and injured 74 people and caused between $50,000 and $500,000 in damages.
On 4/24/1970, a category F3 (max. wind speeds 158-206 mph) tornado 1.4 miles away from the city center injured 3 people and caused between $500,000 and $5,000,000 in damages.
Earthquake activity:
Germantown-area historical earthquake activity is significantly above Tennessee state average. It is 362% greater than the overall U.S. average. On 3/25/1976 at 00:41:20, a magnitude 5.0 (4.9 MB, 5.0 LG, Class: Moderate, Intensity: VI - VII) earthquake occurred 48.4 miles away from the city center On 5/4/1991 at 01:18:54, a magnitude 5.0 (4.4 MB, 4.6 LG, 5.0 LG, Depth: 3.1 mi) earthquake occurred 102.0 miles away from the city center On 4/27/1989 at 16:47:49, a magnitude 4.7 (4.6 MB, 4.7 LG, 4.3 LG, Class: Light, Intensity: IV - V) earthquake occurred 63.4 miles away from Germantown center On 9/26/1990 at 13:18:51, a magnitude 5.0 (4.7 MB, 4.8 LG, 5.0 LG, Depth: 7.7 mi) earthquake occurred 144.5 miles away from Germantown center On 3/25/1976 at 01:00:11, a magnitude 4.5 (4.1 MB, 4.5 LG) earthquake occurred 52.9 miles away from Germantown center On 4/18/2008 at 09:36:59, a magnitude 5.4 (5.1 MB, 4.8 MS, 5.4 MW, 5.2 MW) earthquake occurred 255.5 miles away from Germantown center Magnitude types: regional Lg-wave magnitude (LG), body-wave magnitude (MB), surface-wave magnitude (MS), moment magnitude (MW) Natural disasters: The number of natural disasters in Shelby County (18) is near the US average (15).Major Disasters (Presidential) Declared: 14Emergencies Declared: 2Floods: 13, Storms: 13, Tornadoes: 8, Winds: 8, Winter Storms: 2, Flash Flood: 1, Heavy Rain: 1, Hurricane: 1, Ice Storm: 1, Other: 1 (Note: some incidents may be assigned to more than one category). Main business address for: EQUITY INNS INC REAL ESTATE INVESTMENT TRUSTS ).
Hospitals and medical centers in Germantown: BAPTIST REHABILITATION GERMANTOWN (Voluntary non-profit - Private, provides emergency services, 2100 EXETER ROAD) GERMANTOWN COMMUNITY HOSPITAL (provides emergency services, 7691 POPLAR AVE) THE VILLAGE AT GERMANTOWN (7930 WALKING HORSE CIRCLE)
FMC MEMPHIS GERMANTOWN (7640 WOLF RIVER CIRCLE)
Heliports located in Germantown: Amtrak station near Germantown: 16 miles: MEMPHIS (545 S. MAIN ST.) Services: ticket office, partially wheelchair accessible, enclosed waiting area, public restrooms, public payphones, vending machines, free short-term parking, free long-term parking, call for car rental service, call for taxi service, public transit connection.
Colleges/universities with over 2000 students nearest to Germantown:
University of Memphis (about 11 miles; Memphis, TN ; Full-time enrollment: 17,427)
Rhodes College (about 12 miles; Memphis, TN ; FT enrollment: 2,052)
Southwest Tennessee Community College (about 15 miles; Memphis, TN ; FT enrollment: 8,043)
Northwest Mississippi Community College (about 34 miles; Senatobia, MS ; FT enrollment: 6,607)
University of Mississippi (about 53 miles; University, MS ; FT enrollment: 17,642)
Union University (about 67 miles; Jackson, TN ; FT enrollment: 4,051)
Jackson State Community College (about 69 miles; Jackson, TN ; FT enrollment: 2,958)
Public high school in Germantown:
Private high schools in Germantown: THE PHOENIX SCHOOL FOR CREATIVE LEARNING Students: 24, Location: 2404 ARTHUR RD, Grades: UG-12)
DAYBREAK SPECIALIZED SCHOOL Students: 22, Location: 2262 S GERMANTOWN RD, Grades: UG-11)
Public elementary/middle schools in Germantown:
Private elementary/middle school in Germantown: THE BODINE SCHOOL Students: 81, Location: 2432 YESTER OAKS DR, Grades: 1-8)
See full list of schools located in Germantown Library in Germantown: GERMANTOWN COMMUNITY LIBRARY Operating income: $1,344,235; Location: 1925 EXETER ROAD; 122,351 books ; 4,105 audio materials ; 3,541 video materials ; 25 local licensed databases ; 32 state licensed databases ; 211 print serial subscriptions )
Notable locations in Germantown: (A) , Germantown United Methodist Church Owing Life Enrichment Center (B) , Germantown Branch Memphis Public Library (C) , Germantown Fire Department Station 1 (D) , Germantown Fire Department Station 2 (E) , Germantown Fire Department Station 4 (F) , Baptist Rehabilitation - Germantown (G) , Neshoba Community Center (H) , Germantown Fire Department Station 3 (I) . Display/hide their locations on the map
Shopping Centers: (1) , Exeter Village Shopping Center (2) , Schaeffer Center of Germantown Shopping Center (3) , Saddle Creek North Shopping Center (4) . Display/hide their locations on the map
Main business address in Germantown: (A) . Display/hide its location on the map
Churches in Germantown include: (A) , Forest Hill Baptist Church (B) , Germantown Presbyterian Church (C) , Germantown United Methodist Church (D) , Grace Presbyterian Church (E) , The Church of Our Lady (F) , Taylor Chapel Christian Methodist Episcopal Church (G) , Samaritans Heart International Church (H) , Riveroaks Reformed Presbyterian Church (I) . Display/hide their locations on the map
Cemetery: (1) . Display/hide its location on the map
Reservoirs: (A) , Hunt Lake (B) . Display/hide their locations on the map
Parks in Germantown include: (1) , Poplar Estates Parkway (2) , Howard McVay Park (3) , Hacks Cross Road Park (4) , Farmington Park (5) , Riverdale Park (6) , Cameron-Brown Park (7) . Display/hide their locations on the map
Tourist attractions: (1) , Germantown Festival (Tours & Charters; 1618 Old Mill Road) (2) . Display/hide their approximate locations on the map
Hotels: (1) , Courtyard by Marriott Germantown (7750 Wolf River Boulevard) (2) , Continental Design & Supplies (8596 Farmington Boulevard Suite 6) (3) , Homewood Suites Memphis/Germantown (7855 Wolf River Boulevard) (4) , Comfort Inn & Suites (7787 Wolf River Boulevard) (5) . Display/hide their approximate locations on the map
Courts: (1) , Germantown City - City Court (1930 South Germantown Road) (2) . Display/hide their approximate locations on the map
Birthplace of: Tony Williams - 2005 NFL player (Jacksonville Jaguars, born : Jul 9, 1975), Brad Cottam - Football player, Justin Jones - College basketball player (Hofstra Flying Dutchmen), Olivia Holt - Actor, Todd Vinson - College football player (Tennessee Volunteers), Tony Williams (American football) - Football player, Walter Andrews - College football player (Arkansas Razorbacks).
Shelby County has a predicted average indoor radon screening level less than 2 pCi/L (pico curies per liter) - Low Potential Drinking water stations with addresses in Germantown and their reported violations in the past:
GERMANTOWN WATER DEPT (Population served: 36,841, Groundwater):
Past monitoring violations:
Monitoring of Treatment (SWTR-Unfilt/GWR) - In JUN-2011, Contaminant: GROUNDWATER RULE. Follow-up actions: St Violation/Reminder Notice (JUN-17-2011), St Compliance achieved (JUL-31-2011)
Monitoring and Reporting (DBP) - Between OCT-2005 and DEC-2005, Contaminant: Chlorine. Follow-up actions: St Compliance achieved (JAN-01-2006), St Public Notif requested (JAN-31-2006), St Violation/Reminder Notice (JAN-31-2006)
69 regular monitoring violations
Average household size: This city:
2.6 peopleTennessee:
2.5 people
Percentage of family households: This city:
78.1%Whole state:
67.3%
Percentage of households with unmarried partners: This city:
1.8%Whole state:
5.8%
Likely homosexual households (counted as self-reported same-sex unmarried-partner households)
Lesbian couples: 0.2% of all households Gay men: 0.2% of all households
43 people in nursing facilities/skilled-nursing facilities in 2010People in group quarters in Germantown in 2000:
29 people in nursing homes
3 people in religious group quarters
2 people in homes for the mentally retarded
Banks with most branches in Germantown (2011 data):
First Tennessee Bank, National Association: The Village Of Germantown Financial, Kirby Woods Branch, Germantown Branch, Farmington Branch. Info updated 2009/09/08: Bank assets: $24,563.4 mil, Deposits: $16,402.1 mil, headquarters in Memphis, TN, positive income , Commercial Lending Specialization, 180 total offices , Holding Company: First Horizon National Corporation
SunTrust Bank: Germantown Branch - 719, Germantown Kroger Branch, Poplar & Johnson Branch. Info updated 2010/05/27: Bank assets: $171,291.7 mil, Deposits: $129,833.2 mil, headquarters in Atlanta, GA, positive income , Commercial Lending Specialization, 1716 total offices , Holding Company: Suntrust Banks, Inc.
Synovus Bank: Wolf River Branch at 7860 Wolf River Parkway, branch established on 2008/01/22; Forest Hill-Irene Branch at 3100 Forest Hill-Irene Road, branch established on 1996/07/22. Info updated 2011/01/25: Bank assets: $26,863.3 mil, Deposits: $22,415.0 mil, headquarters in Columbus, GA, positive income , Commercial Lending Specialization, 296 total offices , Holding Company: Synovus Financial Corp.
Bank of Bartlett: Germantown Branch at 7708 Poplar Avenue, branch established on 1997/06/10; Kirby Woods Branch at 1870 Kirby Parkway, branch established on 1986/11/12. Info updated 2006/11/03: Bank assets: $373.2 mil, Deposits: $319.5 mil, headquarters in Bartlett, TN, negative income in the last year , Mortgage Lending Specialization, 8 total offices , Holding Company: West Tennessee Bancshares, Inc.
Landmark Community Bank: - Germantown at 1227 S. Germantown Parkway #101, branch established on 2006/10/30; - Old German at 2241 Germantown Road South, branch established on 2010/06/16. Info updated 2010/07/15: Bank assets: $289.8 mil, Deposits: $209.9 mil, headquarters in Collierville, TN, positive income , Commercial Lending Specialization, 4 total offices
Regions Bank: Germantown Branch at 7744 Poplar Avenue, branch established on 1928/01/01; Germantown Branch at 7550 West Farmington Boulevard, branch established on 1994/12/23. Info updated 2011/02/24: Bank assets: $123,368.2 mil, Deposits: $98,301.3 mil, headquarters in Birmingham, AL, positive income , Commercial Lending Specialization, 1778 total offices , Holding Company: Regions Financial Corporation
Magna Bank: Germantown Branch at 1264 Germantown Road, branch established on 2007/10/26; Germantown-Forrest Hill Branch at 9057 Poplar Avenue, branch established on 2008/08/12. Info updated 2011/07/21: Bank assets: $440.6 mil, Deposits: $330.4 mil, headquarters in Memphis, TN, positive income , Commercial Lending Specialization, 5 total offices
Triumph Bank: at 2171 Judicial Drive, Suite 101, branch established on 2006/06/05. Info updated 2011/05/17: Bank assets: $308.1 mil, Deposits: $277.5 mil, local headquarters , positive income , Commercial Lending Specialization, 4 total offices , Holding Company: Triumph Bancshares, Inc.
BankTennessee: Forest Hill Branch at 2915 Forest Hill Irene, branch established on 2007/08/01. Info updated 2006/11/03: Bank assets: $246.8 mil, Deposits: $220.4 mil, headquarters in Collierville, TN, positive income , Commercial Lending Specialization, 7 total offices , Holding Company: Banktennessee Bancshares, Inc.
8 other banks with 8 local branches
For population 15 years and over in Germantown:
Never married: 17.4%Now married: 67.7%Separated: 1.1%Widowed: 6.9%Divorced: 7.0% For population 25 years and over in Germantown:
High school or higher: 98.5%Bachelor's degree or higher: 69.6%Graduate or professional degree: 33.3%Unemployed: 1.9%Mean travel time to work (commute): 16.6 minutes
Education Gini index (Inequality in education) Here:
8.6Tennessee average:
11.4
Religion statistics for Germantown, TN (based on Shelby County data)
Religion Adherents Congregations Evangelical Protestant 260,401 504 Black Protestant 150,894 292 Mainline Protestant 87,990 127 Catholic 61,202 29 Other 26,520 68 Orthodox 1,125 6 None 339,512 -
Source: Clifford Grammich, Kirk Hadaway, Richard Houseal, Dale E.Jones, Alexei Krindatch, Richie Stanley and Richard H.Taylor. 2012. 2010 U.S.Religion Census: Religious Congregations & Membership Study. Association of Statisticians of American Religious Bodies. Jones, Dale E., et al. 2002. Congregations and Membership in the United States 2000. Nashville, TN: Glenmary Research Center. Graphs represent county-level data
Food Environment Statistics: Number of grocery stores : 186Shelby County :
2.05 / 10,000 pop.Tennessee :
1.99 / 10,000 pop.
Number of supercenters and club stores : 13Shelby County :
0.14 / 10,000 pop.Tennessee :
0.17 / 10,000 pop.
Number of convenience stores (no gas) : 49Shelby County :
0.54 / 10,000 pop.Tennessee :
0.65 / 10,000 pop.
Number of convenience stores (with gas) : 386Shelby County :
4.25 / 10,000 pop.Tennessee :
5.16 / 10,000 pop.
Number of full-service restaurants : 556Shelby County :
6.12 / 10,000 pop.Tennessee :
6.56 / 10,000 pop.
Adult diabetes rate : Shelby County :
11.3%Tennessee :
11.4%
Adult obesity rate : Shelby County :
32.8%State :
30.2%
Low-income preschool obesity rate : Shelby County :
9.2%State :
13.5%
Health and Nutrition:
Average overall health of teeth and gums : This city:
58.5%Tennessee:
46.1%
People feeling badly about themselves : Germantown:
18.0%Tennessee:
21.0%
People not drinking alcohol at all : Germantown:
7.3%Tennessee:
10.5%
Average hours sleeping at night : Overweight people : This city:
35.7%Tennessee:
33.9%
General health condition : Here:
63.2%Tennessee:
55.9%
Average condition of hearing : Germantown:
81.2%State:
79.1%
More about Health and Nutrition of Germantown, TN Residents
Local government employment and payroll (March 2022)
Function
Full-time employees
Monthly full-time payroll
Average yearly full-time wage
Part-time employees
Monthly part-time payroll
Elementary and Secondary - Instruction
579 $2,785,746 $57,736 9 $22,222 Police Protection - Officers
106 $700,593 $79,312 0 $0 Firefighters
79 $551,437 $83,763 1 $222 Elementary and Secondary - Other Total
66 $298,958 $54,356 13 $8,120 Streets and Highways
34 $158,029 $55,775 0 $0 Parks and Recreation
34 $191,983 $67,759 90 $69,679 Other and Unallocable
28 $115,652 $49,565 1 $957 Financial Administration
26 $161,083 $74,346 0 $0 Police - Other
24 $125,681 $62,841 9 $10,053 Other Government Administration
20 $112,756 $67,654 0 $0 Water Supply
15 $65,616 $52,493 0 $0 Fire - Other
11 $40,412 $44,086 0 $0 Housing and Community Development (Local)
10 $66,542 $79,850 0 $0 Judicial and Legal
9 $40,601 $54,135 0 $0 Health
6 $19,729 $39,458 2 $2,316 Sewerage
5 $29,273 $70,255 0 $0
Totals for Government
1,052 $5,464,090 $62,328 125 $113,568
Germantown government finances - Expenditure in 2021 (per resident):
Current Operations - Police Protection: $14,531,000 ($356.01)
Parks and Recreation: $11,981,000 ($293.54)Local Fire Protection: $10,337,000 ($253.26)Central Staff Services: $8,808,000 ($215.80)Water Utilities: $5,517,000 ($135.17)General - Other: $5,418,000 ($132.74)Solid Waste Management: $4,570,000 ($111.97)Regular Highways: $2,564,000 ($62.82)Health - Other: $2,371,000 ($58.09)Financial Administration: $2,313,000 ($56.67)General Public Buildings: $2,213,000 ($54.22)Libraries: $1,399,000 ($34.28)Judicial and Legal Services: $828,000 ($20.29)Sewerage: $811,000 ($19.87)Other Capital Outlay - General - Other: $4,842,000 ($118.63)
Parks and Recreation: $2,762,000 ($67.67)Regular Highways: $1,186,000 ($29.06)Police Protection: $689,000 ($16.88)Sewerage: $566,000 ($13.87)General Public Building: $222,000 ($5.44)Local Fire Protection: $53,000 ($1.30)Financial Administration: $20,000 ($0.49)Total Salaries and Wages: $27,032,000 ($662.29)
Water Utilities - Interest on Debt: $2,289,000 ($56.08)
Germantown government finances - Revenue in 2021 (per resident):
Charges - Solid Waste Management: $5,038,000 ($123.43)
Other: $4,929,000 ($120.76)Sewerage: $1,048,000 ($25.68)Miscellaneous Commercial Activities: $704,000 ($17.25)Parks and Recreation: $32,000 ($0.78)Miscellaneous - Donations From Private Sources: $2,477,000 ($60.69)
Fines and Forfeits: $884,000 ($21.66)General Revenue - Other: $682,000 ($16.71)Rents: $237,000 ($5.81)Interest Earnings: $115,000 ($2.82)Revenue - Water Utilities: $6,152,000 ($150.73)
State Intergovernmental - Other: $19,145,000 ($469.06)
General Local Government Support: $3,483,000 ($85.33)Highways: $3,228,000 ($79.09)Tax - Property: $33,655,000 ($824.55)
General Sales and Gross Receipts: $13,733,000 ($336.46)Alcoholic Beverage Sales: $1,435,000 ($35.16)Motor Vehicle License: $1,224,000 ($29.99)Other Selective Sales: $663,000 ($16.24)Other License: $115,000 ($2.82)Alcoholic Beverage License: $28,000 ($0.69)
Germantown government finances - Debt in 2021 (per resident):
Long Term Debt - Beginning Outstanding - Unspecified Public Purpose: $64,365,000 ($1576.96)
Outstanding Unspecified Public Purpose: $61,172,000 ($1498.73)Retired Unspecified Public Purpose: $3,193,000 ($78.23)Short Term Debt Outstanding - End of Fiscal Year: $3,488,000 ($85.46)
Beginning: $3,028,000 ($74.19)
Germantown government finances - Cash and Securities in 2021 (per resident):
Other Funds - Cash and Securities: $73,039,000 ($1789.47)
4.35% of this county's 2021 resident taxpayers lived in other counties in 2020 ($59,303 average adjusted gross income )
Here:
4.35%Tennessee average:
8.49%
0.02% of residents moved from foreign countries ($242 average AGI )Shelby County:
0.02%Tennessee average:
0.02%
Top counties from which taxpayers relocated into this county between 2020 and 2021:
5.27% of this county's 2020 resident taxpayers moved to other counties in 2021 ($68,956 average adjusted gross income )
Here:
5.27%Tennessee average:
7.40%
0.02% of residents moved to foreign countries ($220 average AGI )Shelby County:
0.02%Tennessee average:
0.01%
Top counties to which taxpayers relocated from this county between 2020 and 2021:
Businesses in Germantown, TN
Name Count Name Count
Ann Taylor 2 JoS. A. Bank 1 Apple Store 1 Jones New York 1 Arby's 1 Kroger 1 AutoZone 1 Lane Furniture 1 Banana Republic 1 Little Caesars Pizza 1 Baskin-Robbins 1 Marriott 3 Bed Bath & Beyond 1 Marshalls 1 Chick-Fil-A 1 MasterBrand Cabinets 12 Chico's 1 McDonald's 1 Circle K 1 New Balance 1 Coldwater Creek 1 Nike 4 Comfort Inn 1 Office Depot 1 Curves 1 OfficeMax 1 Decora Cabinetry 4 Panera Bread 1 Domino's Pizza 1 Pier 1 Imports 1 Dunkin Donuts 1 Pizza Hut 1 Eddie Bauer 1 Quiznos 1 FedEx 9 Rite Aid 1 Firestone Complete Auto Care 1 Sprint Nextel 1 GNC 2 Starbucks 3 Gap 1 Subway 3 Gymboree 1 Taco Bell 1 Hilton 1 Talbots 2 Hobby Lobby 1 Target 1 Holiday Inn 1 U-Haul 1 Hyatt 1 UPS 7 J. Jill 1 Waffle House 1 J.Crew 1 Walgreens 3 Jimmy John's 1 Wendy's 2
Strongest AM radio stations in Germantown:
WCRV (640 AM; 50 kW; COLLIERVILLE, TN; Owner: BOTT BROADCASTING COMPANY/TENNESSEE)
WGSF (1030 AM; 50 kW; MEMPHIS, TN; Owner: FLINN BROADCASTING CORPORATION)
WMQM (1600 AM; 50 kW; LAKELAND, TN; Owner: WMQM, INC.)
WDIA (1070 AM; 50 kW; MEMPHIS, TN; Owner: CLEAR CHANNEL BROADCASTING LICENSES, INC.)
WOWW (1430 AM; 2 kW; GERMANTOWN, TN; Owner: FLINN BROADCASTING CORPORATION)
WMC (790 AM; 5 kW; MEMPHIS, TN; Owner: INFINITY RADIO OPERATIONS INC.)
WPLX (1170 AM; 10 kW; GERMANTOWN, TN; Owner: EDUCATIONAL MEDIA FOUNDATION)
KWAM (990 AM; 10 kW; MEMPHIS, TN; Owner: CONCORD MEDIA GROUP, INC.)
WJCE (680 AM; 10 kW; MEMPHIS, TN; Owner: ENTERCOM MEMPHIS LICENSE, LLC)
WREC (600 AM; 5 kW; MEMPHIS, TN; Owner: CLEAR CHANNEL BROADCASTING LICENSES, INC.)
WHBQ (560 AM; 5 kW; MEMPHIS, TN; Owner: FLINN BROADCASTING CORPORATION)
WBBP (1480 AM; 5 kW; MEMPHIS, TN)
WCPC (940 AM; 50 kW; HOUSTON, MS; Owner: WCPC BROADCASTING CO., INC.)
Strongest FM radio stations in Germantown:
WSRR-FM (98.1 FM; MILLINGTON, TN; Owner: KOOL BROADCASTING, INC.)
WGKX (105.9 FM; MEMPHIS, TN; Owner: KIX BROADCASTING, INC.)
WRVR-FM (104.5 FM; MEMPHIS, TN; Owner: ENTERCOM MEMPHIS LICENSE, LLC)
WKNO-FM (91.1 FM; MEMPHIS, TN; Owner: MID-SOUTH PUBLIC COMMUNICATIONS FOUNDATION)
WEVL (89.9 FM; MEMPHIS, TN; Owner: SOUTHERN COMMUNICATION VOLUNTEERS, INC.)
WMC-FM (99.7 FM; MEMPHIS, TN; Owner: INFINITY RADIO OPERATIONS INC.)
WQOX (88.5 FM; MEMPHIS, TN; Owner: MEMPHIS CITY SCHOOLS)
WUMR (91.7 FM; MEMPHIS, TN; Owner: THE UNIVERSITY OF MEMPHIS)
WMPS (107.5 FM; GERMANTOWN, TN; Owner: FLINN BROADCASTING CORPORATION)
WEGR (102.7 FM; MEMPHIS, TN; Owner: CLEAR CHANNEL BROADCASTING LICENSES, INC.)
WMBZ (94.1 FM; GERMANTOWN, TN; Owner: ENTERCOM MEMPHIS LICENSE, LLC)
WHAL-FM (95.7 FM; OLIVE BRANCH, MS; Owner: CLEAR CHANNEL BROADCASTING LICENSES, INC.)
WMFS (92.9 FM; BARTLETT, TN; Owner: INFINITY BROADCASTING CORP. OF ILLINOIS)
WKVF (94.9 FM; BYHALIA, MS; Owner: EDUCATIONAL MEDIA FOUNDATION)
KJMS (101.1 FM; MEMPHIS, TN; Owner: CLEAR CHANNEL BROADCASTING LICENSES, INC.)
WHRK (97.1 FM; MEMPHIS, TN; Owner: CLEAR CHANNEL BROADCASTING LICENSES, INC.)
WYPL (89.3 FM; MEMPHIS, TN; Owner: MEMPHIS/SHELBY COUNTY PUBLIC LIBRARY & INFO CNTR.)
KXHT (107.1 FM; MARION, AR; Owner: FLINN BROADCASTING CORPORATION)
WVIM-FM (95.3 FM; COLDWATER, MS; Owner: DESOTO COUNTY B/CING. CO.)
TV broadcast stations around Germantown:
WKNO (Channel 10; MEMPHIS, TN; Owner: MID-SOUTH PUBLIC COMMUNICATIONS FOUNDATION)
WREG-TV (Channel 3; MEMPHIS, TN; Owner: NEW YORK TIMES MANAGEMENT SERVICES)
WHBQ-TV (Channel 13; MEMPHIS, TN; Owner: FOX TELEVISION STATIONS, INC.)
WPXX-TV (Channel 50; MEMPHIS, TN; Owner: FLINN BROADCASTING CORPORATION)
WMC-TV (Channel 5; MEMPHIS, TN; Owner: RAYCOM AMERICA, INC.)
WLMT (Channel 30; MEMPHIS, TN; Owner: CLEAR CHANNEL BROADCASTING LICENSES, INC.)
WPTY-TV (Channel 24; MEMPHIS, TN; Owner: CLEAR CHANNEL BROADCASTING LICENSES, INC.)
W57CG (Channel 57; MEMPHIS, TN; Owner: GEORGE S. FLINN, JR.)
WBUY (Channel 40; HOLLY SPRINGS, MS; Owner: TRINITY BROADCASTING NETWORK)
W67CV (Channel 67; MEMPHIS, TN; Owner: GEORGE S. FLINN, JR.)
WBXP-CA (Channel 44; MEMPHIS, TN; Owner: THE BOX WORLDWIDE LLC)
W42BY (Channel 42; MEMPHIS, TN; Owner: THREE ANGELS BROADCASTING NETWORK, INC,)
WJRJ-LP (Channel 59; MEMPHIS, TN; Owner: WORD OF GOD FELLOWSHIP, INC.)
W61BP (Channel 61; MEMPHIS, TN; Owner: JIMMY BOYD)
National Bridge Inventory (NBI) Statistics 23 Number of bridges236ft / 71.8m Total length $1,768,000 Total costs257,240 Total average daily traffic15,993 Total average daily truck traffic
New bridges - historical statistics
2 1950-1959 2 1970-1979 3 1980-1989 11 1990-1999 3 2000-2009 2 2010-2019
See full National Bridge Inventory statistics for Germantown, TN
Home Mortgage Disclosure Act Aggregated Statistics For Year 2009(Based on 6 full and 3 partial tracts) A) FHA, FSA/RHS & VA B) Conventional C) Refinancings D) Home Improvement Loans F) Non-occupant Loans on Number Average Value Number Average Value Number Average Value Number Average Value Number Average Value
LOANS ORIGINATED 167 $200,699 342 $254,710 1,234 $235,411 20 $108,079 36 $198,406 APPLICATIONS APPROVED, NOT ACCEPTED 3 $197,483 12 $243,842 66 $250,462 4 $57,268 2 $226,200 APPLICATIONS DENIED 14 $189,070 12 $227,177 208 $251,069 8 $83,738 4 $125,135 APPLICATIONS WITHDRAWN 17 $174,324 38 $246,380 210 $238,128 5 $138,854 5 $260,912 FILES CLOSED FOR INCOMPLETENESS 2 $115,300 6 $249,563 41 $267,845 1 $41,280 2 $237,160
Aggregated Statistics For Year 2008(Based on 6 full and 3 partial tracts) A) FHA, FSA/RHS & VA B) Conventional C) Refinancings D) Home Improvement Loans F) Non-occupant Loans on G) Loans On Manufactured Number Average Value Number Average Value Number Average Value Number Average Value Number Average Value Number Average Value
LOANS ORIGINATED 68 $193,569 435 $253,859 490 $238,009 34 $69,175 57 $221,315 0 $0 APPLICATIONS APPROVED, NOT ACCEPTED 1 $235,940 30 $297,342 58 $239,191 12 $97,601 6 $206,920 1 $65,000 APPLICATIONS DENIED 5 $149,170 29 $264,342 189 $272,916 22 $117,059 6 $257,642 0 $0 APPLICATIONS WITHDRAWN 8 $246,366 61 $317,400 105 $249,775 8 $118,171 4 $140,520 1 $35,310 FILES CLOSED FOR INCOMPLETENESS 3 $254,843 6 $286,103 26 $247,136 3 $158,727 0 $0 0 $0
Aggregated Statistics For Year 2007(Based on 6 full and 3 partial tracts) A) FHA, FSA/RHS & VA B) Conventional C) Refinancings D) Home Improvement Loans F) Non-occupant Loans on G) Loans On Manufactured Number Average Value Number Average Value Number Average Value Number Average Value Number Average Value Number Average Value
LOANS ORIGINATED 16 $173,329 785 $238,463 497 $228,767 69 $119,180 69 $199,731 0 $0 APPLICATIONS APPROVED, NOT ACCEPTED 0 $0 55 $217,920 85 $208,031 13 $63,323 3 $89,597 0 $0 APPLICATIONS DENIED 2 $165,440 89 $270,523 239 $275,940 32 $78,418 11 $201,495 1 $492,480 APPLICATIONS WITHDRAWN 5 $170,230 70 $247,964 109 $239,429 8 $140,654 6 $172,748 0 $0 FILES CLOSED FOR INCOMPLETENESS 0 $0 17 $303,336 38 $269,646 2 $52,000 2 $66,700 0 $0
Aggregated Statistics For Year 2006(Based on 6 full and 3 partial tracts) A) FHA, FSA/RHS & VA B) Conventional C) Refinancings D) Home Improvement Loans F) Non-occupant Loans on G) Loans On Manufactured Number Average Value Number Average Value Number Average Value Number Average Value Number Average Value Number Average Value
LOANS ORIGINATED 31 $163,090 955 $221,249 508 $214,076 56 $68,943 75 $173,913 2 $137,780 APPLICATIONS APPROVED, NOT ACCEPTED 0 $0 81 $236,586 123 $188,535 13 $21,202 9 $232,571 1 $44,000 APPLICATIONS DENIED 6 $172,827 132 $250,124 254 $247,905 33 $86,848 20 $231,960 1 $46,640 APPLICATIONS WITHDRAWN 2 $248,185 82 $237,591 177 $273,976 8 $206,675 8 $199,598 0 $0 FILES CLOSED FOR INCOMPLETENESS 0 $0 21 $177,279 58 $252,118 3 $100,163 2 $91,780 0 $0
Aggregated Statistics For Year 2005(Based on 6 full and 3 partial tracts) A) FHA, FSA/RHS & VA B) Conventional C) Refinancings D) Home Improvement Loans E) Loans on Dwellings For 5+ Families F) Non-occupant Loans on G) Loans On Manufactured Number Average Value Number Average Value Number Average Value Number Average Value Number Average Value Number Average Value Number Average Value
LOANS ORIGINATED 24 $153,403 949 $221,833 633 $203,601 42 $80,460 2 $16,595,000 56 $183,132 0 $0 APPLICATIONS APPROVED, NOT ACCEPTED 0 $0 63 $246,861 98 $183,271 9 $51,938 0 $0 5 $303,518 0 $0 APPLICATIONS DENIED 1 $148,970 108 $222,813 272 $228,804 41 $89,715 0 $0 17 $172,808 0 $0 APPLICATIONS WITHDRAWN 5 $206,146 155 $189,209 201 $244,604 21 $199,987 0 $0 13 $147,727 1 $278,580 FILES CLOSED FOR INCOMPLETENESS 0 $0 16 $207,404 99 $225,351 3 $90,317 0 $0 2 $242,000 0 $0
Aggregated Statistics For Year 2004(Based on 6 full and 3 partial tracts) A) FHA, FSA/RHS & VA B) Conventional C) Refinancings D) Home Improvement Loans E) Loans on Dwellings For 5+ Families F) Non-occupant Loans on G) Loans On Manufactured Number Average Value Number Average Value Number Average Value Number Average Value Number Average Value Number Average Value Number Average Value
LOANS ORIGINATED 16 $139,395 940 $230,843 825 $204,684 31 $55,470 3 $7,020,667 62 $165,492 0 $0 APPLICATIONS APPROVED, NOT ACCEPTED 1 $48,000 68 $202,670 122 $199,059 6 $117,278 0 $0 3 $152,370 0 $0 APPLICATIONS DENIED 3 $99,593 83 $209,003 282 $202,529 29 $81,499 0 $0 13 $124,062 0 $0 APPLICATIONS WITHDRAWN 2 $163,680 79 $218,064 194 $194,754 4 $79,755 0 $0 10 $88,205 1 $106,000 FILES CLOSED FOR INCOMPLETENESS 1 $184,310 16 $172,066 67 $212,259 1 $38,050 0 $0 3 $122,550 0 $0
Aggregated Statistics For Year 2003(Based on 6 full and 3 partial tracts) A) FHA, FSA/RHS & VA B) Conventional C) Refinancings D) Home Improvement Loans F) Non-occupant Loans on Number Average Value Number Average Value Number Average Value Number Average Value Number Average Value
LOANS ORIGINATED 45 $147,976 772 $209,270 2,452 $192,561 38 $43,404 66 $119,955 APPLICATIONS APPROVED, NOT ACCEPTED 1 $202,050 50 $227,561 208 $181,051 8 $46,319 3 $216,400 APPLICATIONS DENIED 3 $131,363 63 $228,959 410 $200,323 24 $26,332 13 $151,973 APPLICATIONS WITHDRAWN 4 $183,172 62 $219,954 272 $190,855 6 $115,140 7 $144,784 FILES CLOSED FOR INCOMPLETENESS 0 $0 16 $191,449 61 $212,890 4 $63,250 2 $136,955
Aggregated Statistics For Year 2002(Based on 5 full and 1 partial tracts) A) FHA, FSA/RHS & VA B) Conventional C) Refinancings D) Home Improvement Loans E) Loans on Dwellings For 5+ Families F) Non-occupant Loans on Number Average Value Number Average Value Number Average Value Number Average Value Number Average Value Number Average Value
LOANS ORIGINATED 43 $148,994 589 $208,025 1,359 $192,595 35 $72,492 1 $12,416,000 57 $138,861 APPLICATIONS APPROVED, NOT ACCEPTED 1 $102,000 19 $270,437 102 $173,580 7 $67,381 0 $0 6 $106,333 APPLICATIONS DENIED 2 $113,000 47 $214,744 181 $195,497 14 $65,443 0 $0 10 $76,956 APPLICATIONS WITHDRAWN 3 $121,000 53 $198,411 136 $189,144 3 $6,000 0 $0 2 $116,495 FILES CLOSED FOR INCOMPLETENESS 0 $0 9 $262,976 42 $175,530 0 $0 0 $0 2 $74,000
Aggregated Statistics For Year 2001(Based on 5 full and 1 partial tracts) A) FHA, FSA/RHS & VA B) Conventional C) Refinancings D) Home Improvement Loans E) Loans on Dwellings For 5+ Families F) Non-occupant Loans on Number Average Value Number Average Value Number Average Value Number Average Value Number Average Value Number Average Value
LOANS ORIGINATED 43 $127,015 628 $205,300 971 $189,022 60 $49,276 1 $328,000 26 $155,797 APPLICATIONS APPROVED, NOT ACCEPTED 0 $0 21 $231,232 71 $154,063 6 $29,038 0 $0 3 $286,763 APPLICATIONS DENIED 3 $115,333 42 $221,414 159 $152,320 29 $34,148 0 $0 6 $73,667 APPLICATIONS WITHDRAWN 1 $158,000 45 $214,429 137 $164,760 5 $36,800 0 $0 4 $236,315 FILES CLOSED FOR INCOMPLETENESS 1 $175,000 8 $173,750 40 $172,195 0 $0 0 $0 1 $182,000
Aggregated Statistics For Year 2000(Based on 5 full and 1 partial tracts) A) FHA, FSA/RHS & VA B) Conventional C) Refinancings D) Home Improvement Loans F) Non-occupant Loans on Number Average Value Number Average Value Number Average Value Number Average Value Number Average Value
LOANS ORIGINATED 26 $125,154 564 $203,032 186 $159,844 70 $36,211 18 $147,608 APPLICATIONS APPROVED, NOT ACCEPTED 0 $0 42 $208,858 45 $157,014 19 $21,196 1 $138,000 APPLICATIONS DENIED 6 $104,333 41 $192,749 96 $160,698 22 $44,298 13 $157,648 APPLICATIONS WITHDRAWN 1 $56,000 48 $190,659 67 $133,154 12 $94,262 3 $62,890 FILES CLOSED FOR INCOMPLETENESS 1 $86,000 16 $240,376 26 $182,155 1 $9,700 1 $14,000
Aggregated Statistics For Year 1999(Based on 5 full and 3 partial tracts) A) FHA, FSA/RHS & VA B) Conventional C) Refinancings D) Home Improvement Loans F) Non-occupant Loans on Number Average Value Number Average Value Number Average Value Number Average Value Number Average Value
LOANS ORIGINATED 65 $126,143 754 $207,584 511 $163,772 82 $37,720 40 $104,433 APPLICATIONS APPROVED, NOT ACCEPTED 2 $116,970 46 $181,469 88 $129,224 15 $31,919 5 $109,696 APPLICATIONS DENIED 9 $127,453 76 $220,393 148 $142,721 34 $34,093 7 $97,504 APPLICATIONS WITHDRAWN 3 $72,547 74 $204,990 136 $133,198 23 $85,043 13 $92,619 FILES CLOSED FOR INCOMPLETENESS 0 $0 19 $157,871 41 $150,752 0 $0 0 $0
Detailed mortgage data for all 9 tracts in Germantown, TN
Private Mortgage Insurance Companies Aggregated Statistics For Year 2009(Based on 6 full and 3 partial tracts) A) Conventional B) Refinancings C) Non-occupant Loans on Number Average Value Number Average Value Number Average Value
LOANS ORIGINATED 58 $259,432 44 $271,352 0 $0 APPLICATIONS APPROVED, NOT ACCEPTED 12 $271,275 14 $251,775 0 $0 APPLICATIONS DENIED 7 $263,056 7 $276,517 0 $0 APPLICATIONS WITHDRAWN 2 $390,885 9 $281,613 0 $0 FILES CLOSED FOR INCOMPLETENESS 2 $191,000 3 $305,283 1 $175,000
Aggregated Statistics For Year 2008(Based on 6 full and 3 partial tracts) A) Conventional B) Refinancings C) Non-occupant Loans on Number Average Value Number Average Value Number Average Value
LOANS ORIGINATED 119 $248,225 42 $257,841 6 $200,268 APPLICATIONS APPROVED, NOT ACCEPTED 22 $260,726 19 $288,555 1 $247,190 APPLICATIONS DENIED 2 $290,150 5 $244,264 0 $0 APPLICATIONS WITHDRAWN 3 $281,137 1 $210,000 0 $0 FILES CLOSED FOR INCOMPLETENESS 0 $0 0 $0 0 $0
Aggregated Statistics For Year 2007(Based on 6 full and 3 partial tracts) A) Conventional B) Refinancings C) Non-occupant Loans on Number Average Value Number Average Value Number Average Value
LOANS ORIGINATED 158 $224,017 43 $246,728 13 $132,120 APPLICATIONS APPROVED, NOT ACCEPTED 14 $226,211 12 $252,747 1 $136,000 APPLICATIONS DENIED 1 $378,960 1 $394,850 0 $0 APPLICATIONS WITHDRAWN 5 $277,800 0 $0 0 $0 FILES CLOSED FOR INCOMPLETENESS 0 $0 0 $0 0 $0
Aggregated Statistics For Year 2006(Based on 6 full and 3 partial tracts) A) Conventional B) Refinancings C) Non-occupant Loans on Number Average Value Number Average Value Number Average Value
LOANS ORIGINATED 108 $227,447 28 $224,008 2 $198,440 APPLICATIONS APPROVED, NOT ACCEPTED 8 $255,634 9 $194,858 0 $0 APPLICATIONS DENIED 0 $0 0 $0 0 $0 APPLICATIONS WITHDRAWN 3 $183,280 2 $375,520 0 $0 FILES CLOSED FOR INCOMPLETENESS 2 $748,000 0 $0 0 $0
Aggregated Statistics For Year 2005(Based on 6 full and 3 partial tracts) A) Conventional B) Refinancings C) Non-occupant Loans on Number Average Value Number Average Value Number Average Value
LOANS ORIGINATED 92 $217,694 43 $230,420 7 $98,610 APPLICATIONS APPROVED, NOT ACCEPTED 20 $208,368 10 $198,651 1 $125,000 APPLICATIONS DENIED 1 $97,000 0 $0 0 $0 APPLICATIONS WITHDRAWN 5 $237,700 1 $170,000 0 $0 FILES CLOSED FOR INCOMPLETENESS 1 $262,570 0 $0 0 $0
Aggregated Statistics For Year 2004(Based on 6 full and 3 partial tracts) A) Conventional B) Refinancings C) Non-occupant Loans on Number Average Value Number Average Value Number Average Value
LOANS ORIGINATED 112 $199,436 65 $195,967 12 $150,482 APPLICATIONS APPROVED, NOT ACCEPTED 14 $211,996 39 $205,032 1 $276,930 APPLICATIONS DENIED 0 $0 1 $267,760 0 $0 APPLICATIONS WITHDRAWN 3 $120,557 6 $242,737 1 $90,000 FILES CLOSED FOR INCOMPLETENESS 2 $253,000 0 $0 0 $0
Aggregated Statistics For Year 2003(Based on 6 full and 3 partial tracts) A) Conventional B) Refinancings C) Non-occupant Loans on Number Average Value Number Average Value Number Average Value
LOANS ORIGINATED 151 $198,867 206 $196,172 10 $116,552 APPLICATIONS APPROVED, NOT ACCEPTED 22 $209,072 32 $238,581 3 $127,630 APPLICATIONS DENIED 0 $0 1 $234,000 0 $0 APPLICATIONS WITHDRAWN 3 $261,453 11 $228,447 1 $401,000 FILES CLOSED FOR INCOMPLETENESS 0 $0 0 $0 0 $0
Aggregated Statistics For Year 2002(Based on 5 full and 1 partial tracts) A) Conventional B) Refinancings C) Non-occupant Loans on Number Average Value Number Average Value Number Average Value
LOANS ORIGINATED 134 $193,739 114 $189,817 5 $102,000 APPLICATIONS APPROVED, NOT ACCEPTED 11 $255,480 15 $184,439 0 $0 APPLICATIONS DENIED 1 $59,000 1 $185,000 0 $0 APPLICATIONS WITHDRAWN 4 $170,000 9 $188,863 0 $0 FILES CLOSED FOR INCOMPLETENESS 1 $149,000 0 $0 0 $0
Aggregated Statistics For Year 2001(Based on 5 full and 1 partial tracts) A) Conventional B) Refinancings C) Non-occupant Loans on Number Average Value Number Average Value Number Average Value
LOANS ORIGINATED 169 $194,917 94 $198,493 6 $106,000 APPLICATIONS APPROVED, NOT ACCEPTED 7 $175,513 13 $217,187 1 $116,000 APPLICATIONS DENIED 1 $122,000 2 $202,000 1 $122,000 APPLICATIONS WITHDRAWN 0 $0 1 $46,000 0 $0 FILES CLOSED FOR INCOMPLETENESS 1 $159,000 2 $214,500 1 $154,000
Aggregated Statistics For Year 2000(Based on 5 full and 1 partial tracts) A) Conventional B) Refinancings C) Non-occupant Loans on Number Average Value Number Average Value Number Average Value
LOANS ORIGINATED 153 $202,651 17 $202,553 2 $89,000 APPLICATIONS APPROVED, NOT ACCEPTED 12 $215,170 6 $121,875 0 $0 APPLICATIONS DENIED 0 $0 1 $450,000 0 $0 APPLICATIONS WITHDRAWN 4 $119,305 0 $0 0 $0 FILES CLOSED FOR INCOMPLETENESS 1 $168,000 0 $0 0 $0
Aggregated Statistics For Year 1999(Based on 5 full and 3 partial tracts) A) Conventional B) Refinancings C) Non-occupant Loans on Number Average Value Number Average Value Number Average Value
LOANS ORIGINATED 236 $191,895 53 $168,204 3 $186,597 APPLICATIONS APPROVED, NOT ACCEPTED 16 $188,423 8 $152,999 0 $0 APPLICATIONS DENIED 2 $217,800 5 $255,722 0 $0 APPLICATIONS WITHDRAWN 3 $177,530 3 $179,783 1 $55,320 FILES CLOSED FOR INCOMPLETENESS 0 $0 0 $0 0 $0
Fire-safe hotels and motels in Germantown, Tennessee:
Fairfield Inn, 9320 Poplar Pike, Germantown, Tennessee 38138 Phone: (901) 757-9100, Fax: (901) 312-0559
Hyatt Place Germantown, 9161 Winchester Rd, Germantown, Tennessee 38138 Phone: (901) 759-1174, Fax: (901) 759-1175
Holiday Inn Express & Suites, 7784 Wolf Trail Cv, Germantown, Tennessee 38138 Phone: (901) 309-6700, Fax: (901) 309-6800
Hampton Inn & Suites Memphis Germantown, 1680 S Germantown Rd, Germantown, Tennessee 38138 Phone: (901) 309-0555
Quality Inn & Suites, 7787 Wolf River Blvd, Germantown, Tennessee 38138 Phone: (901) 757-7800
Residence Inn, 9314 Poplar Pike, Germantown, Tennessee 38138 Phone: (901) 752-0900, Fax: (901) 312-0579
Courtyard By Marriott, 7750 Wolf River Blvd, Germantown, Tennessee 38139 Phone: (901) 751-0230, Fax: (901) 751-0061
Homewood Suites By Hilton, 7855 Wolf River Blvd, Germantown, Tennessee 38138 Phone: (901) 751-2500, Fax: (901) 751-2557
All 8 fire-safe hotels and motels in Germantown, Tennessee
Most common first names in Germantown, TN among deceased individuals Name Count Lived (average)
Mary 140 80.8 years William 128 75.1 years John 117 73.5 years James 101 72.3 years Robert 87 72.4 years Charles 65 71.7 years Dorothy 58 81.3 years George 54 76.0 years Thomas 51 71.9 years Ruth 51 84.3 years
Most common last names in Germantown, TN among deceased individuals Last name Count Lived (average)
Smith 51 77.1 years Williams 37 80.1 years Johnson 34 83.4 years Brown 34 79.0 years Miller 29 79.1 years Jones 28 77.9 years Thompson 28 78.3 years Davis 22 78.9 years Moore 22 78.9 years Taylor 22 75.1 years
Germantown compared to Tennessee state average:
Median household income above state average. Median house value above state average. Unemployed percentage significantly below state average. Black race population percentage significantly below state average. Hispanic race population percentage below state average. Median age above state average. Foreign-born population percentage above state average. Renting percentage significantly below state average. Number of rooms per house above state average. Percentage of population with a bachelor's degree or higher significantly above state average. Germantown on our top lists :
#5 on the list of "Top 101 cities with the largest percentage of high school students in private schools (3,000+ students)"
#79 on the list of "Top 101 cities where residents moved in more then 10 years ago (10,000+ households)"
#91 on the list of "Top 100 cities with biggest houses (pop. 5,000+)"
#96 on the list of "Top 101 cities with the largest percentage of high school students in private schools (500+ students)"
#1 on the list of "Top 101 counties with the most Black Protestant adherents"
#2 on the list of "Top 101 counties with the most Black Protestant congregations"
#3 on the list of "Top 101 counties with the highest number of infant deaths per 1000 residents 2007-2013 (pop. 50,000+)"
#9 on the list of "Top 101 counties with the lowest percentage of residents that drank alcohol in the past 30 days"
#10 on the list of "Top 101 counties with the highest average weight of females"
Top Patent Applicants
Ole Petter Skaaksrud (59)
Keith E Miller (56)
Kevin T. Foley (44)
Robert T. Rozbicki (36)
Jeff R. Justis (35)
Duane D. Miller (32)
Zachary Christopher Wilkinson (27)
Mark R. Drane (27)
Anthony J. Melkent (24)
Mitchell S. Steiner (19)
Total of 1163 patent applications in 2008-2024.


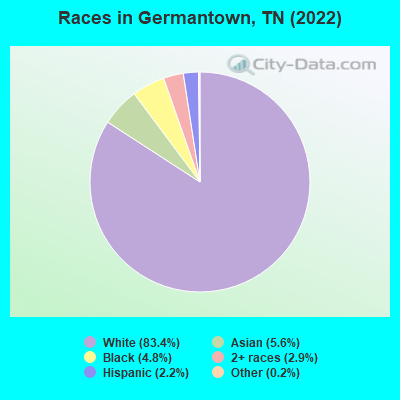
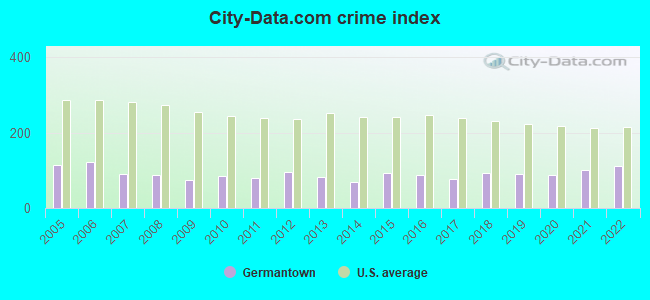
 Recent articles from our blog. Our writers, many of them Ph.D. graduates or candidates, create easy-to-read articles on a wide variety of topics.

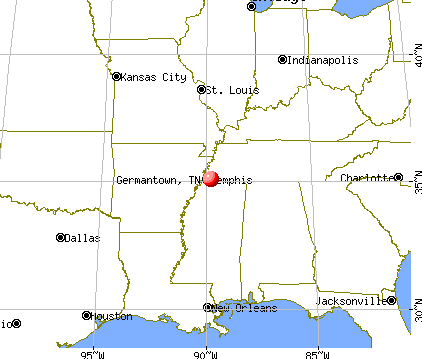
 (10.2 miles
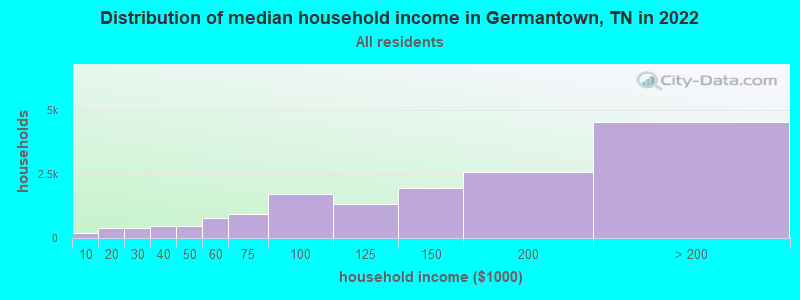
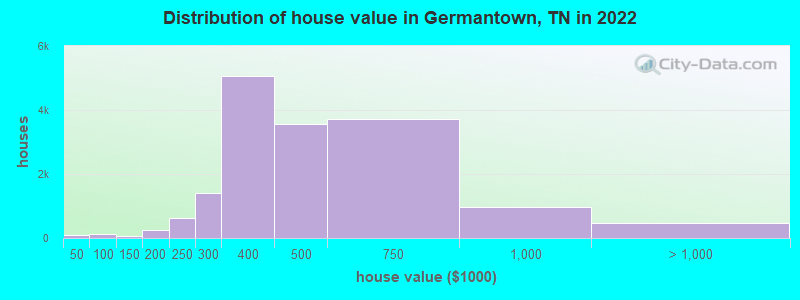
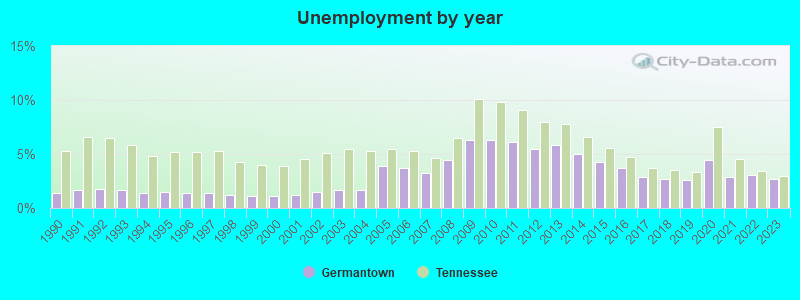
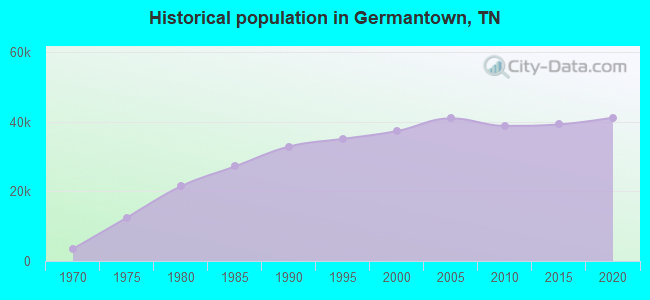
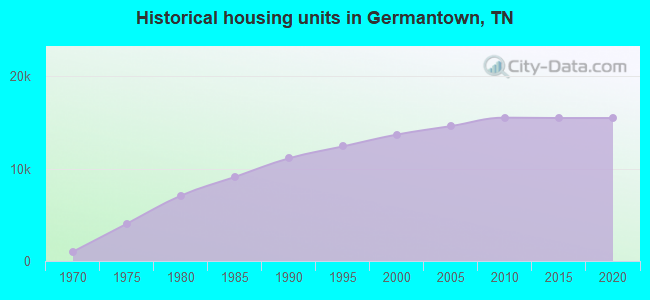
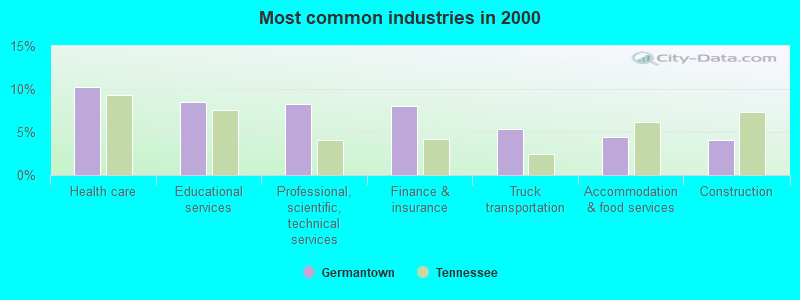
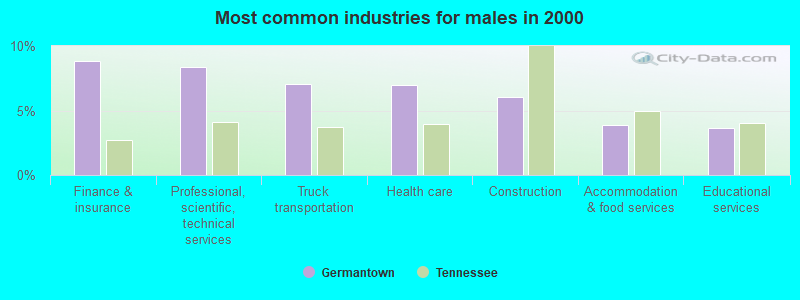
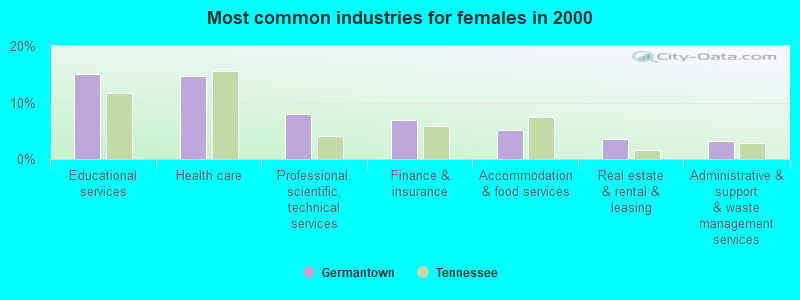
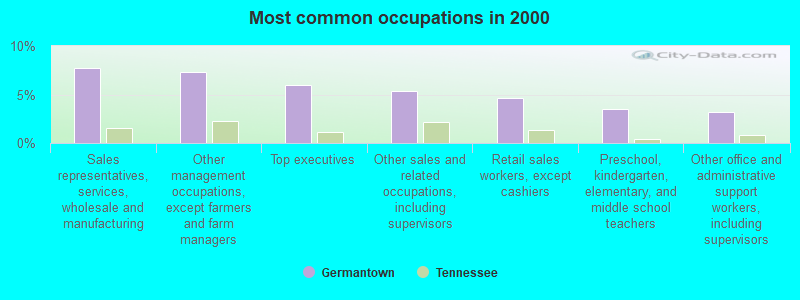
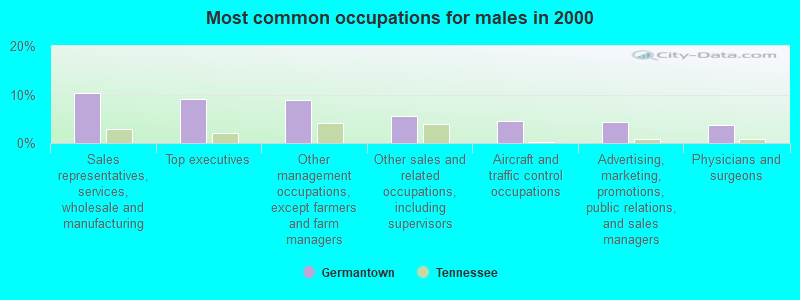
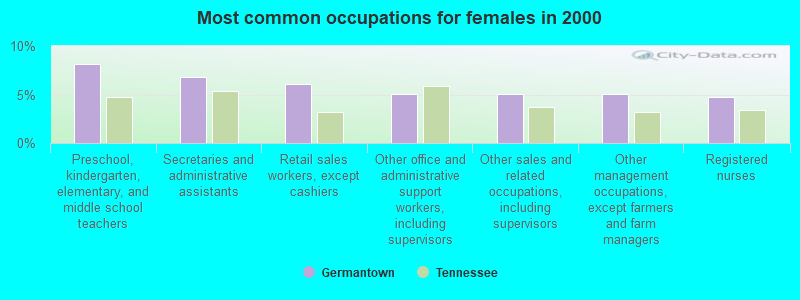
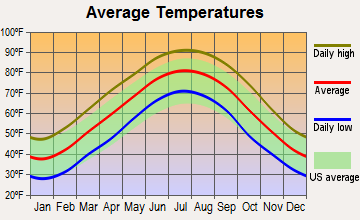
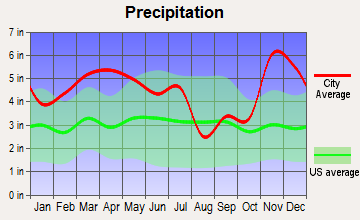
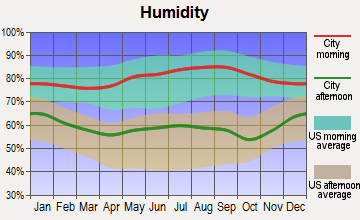
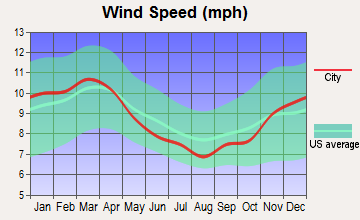
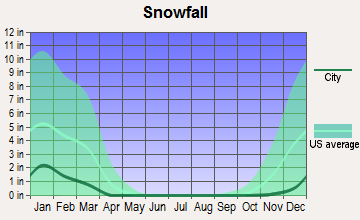
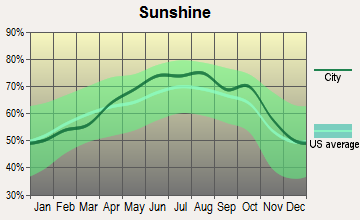
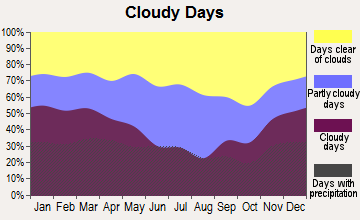
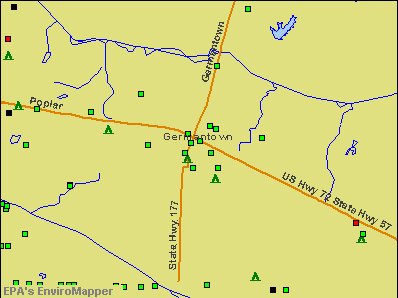

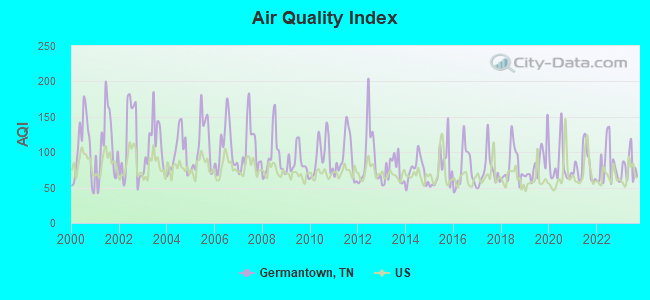
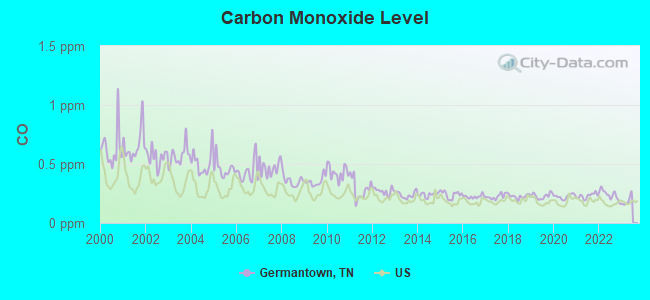
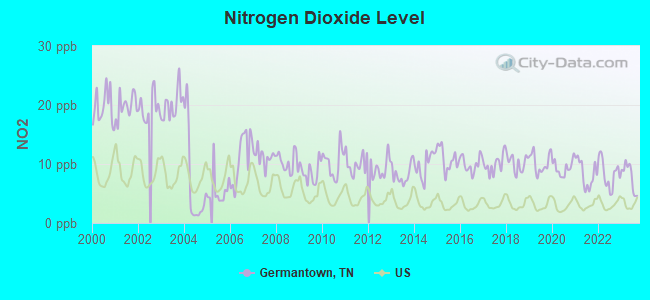
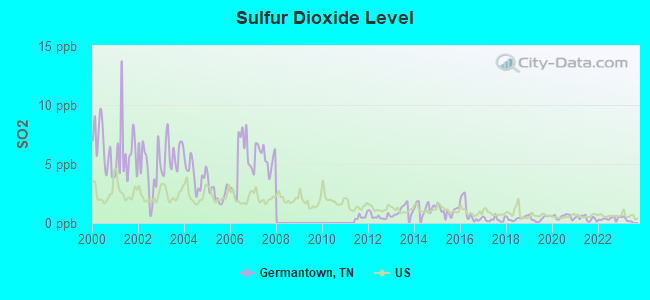
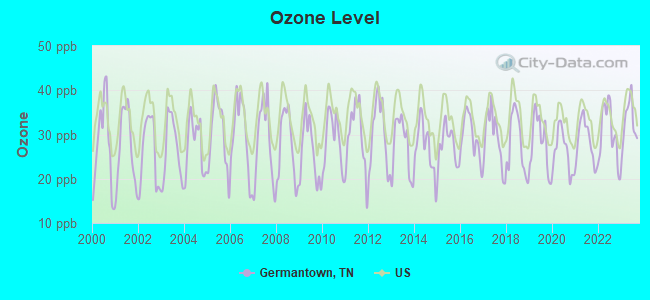
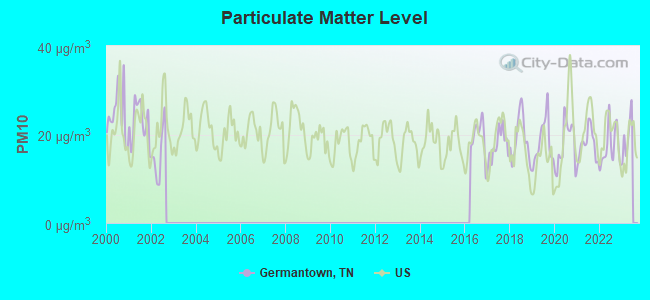
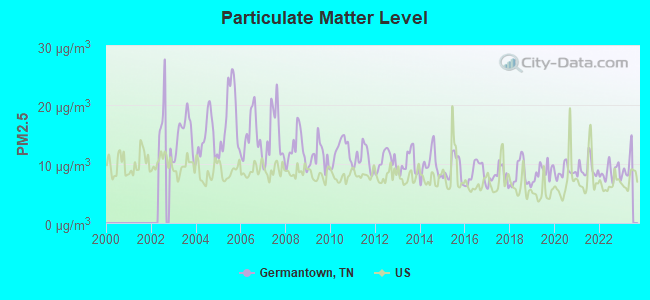

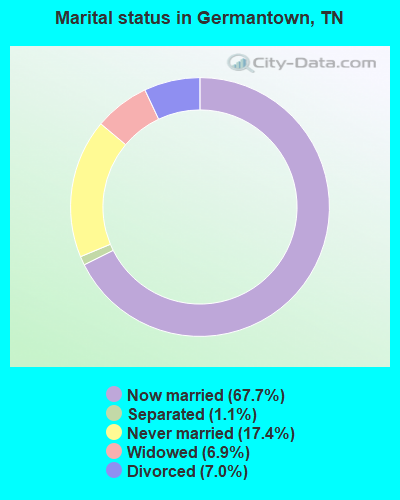
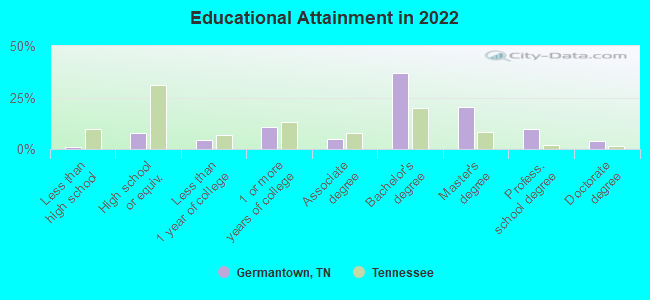
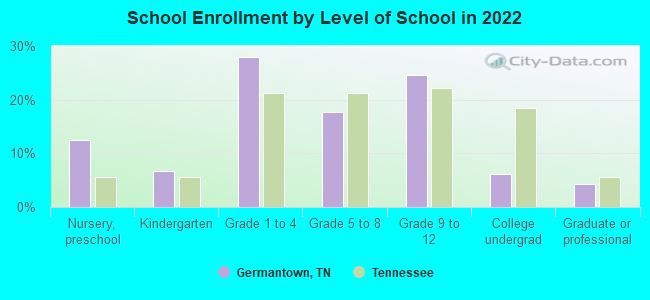
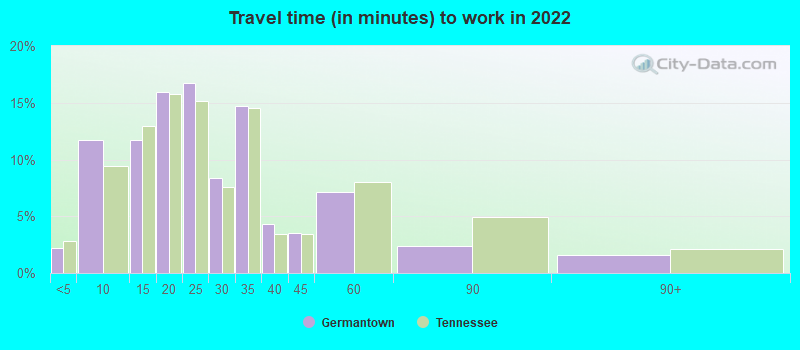
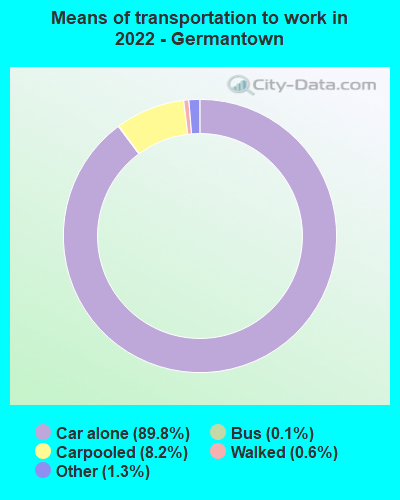
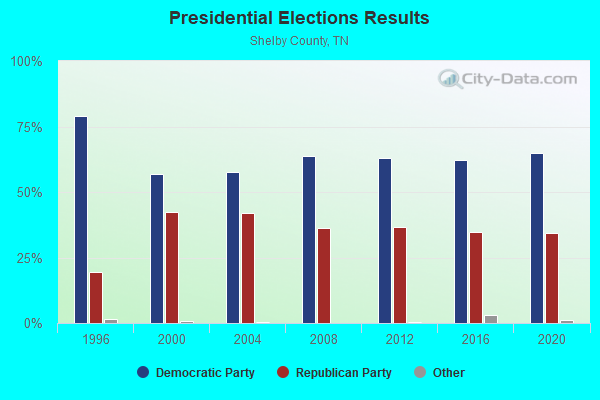
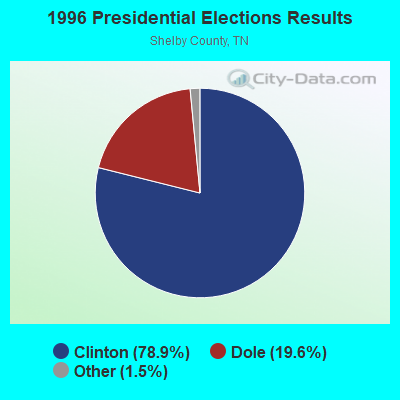
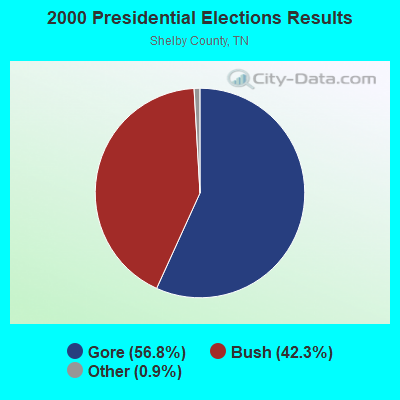
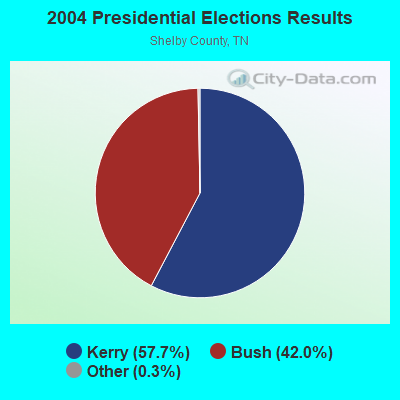
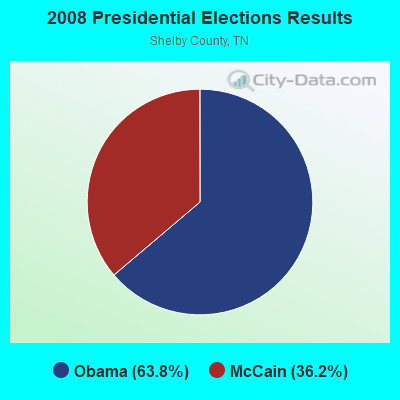
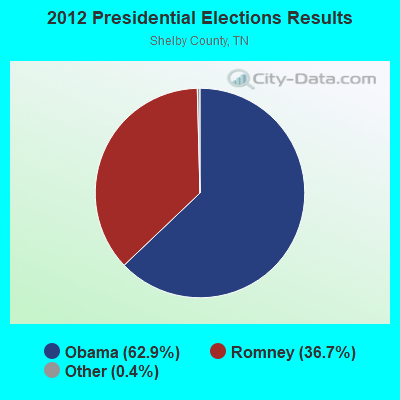
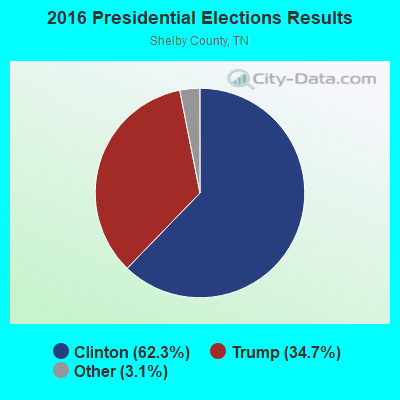
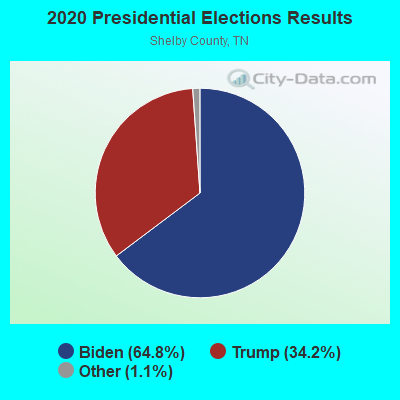
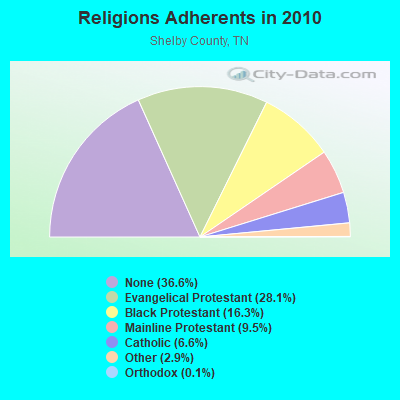
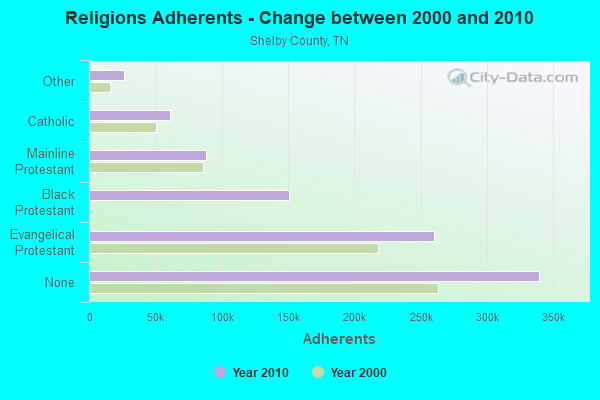
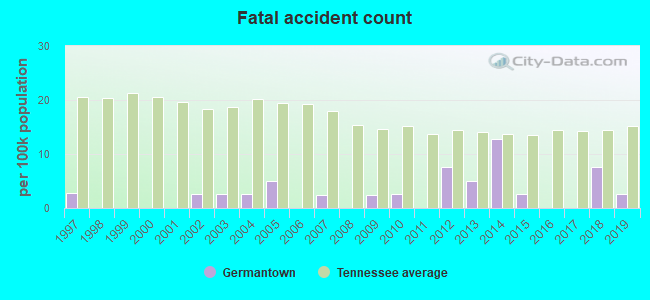
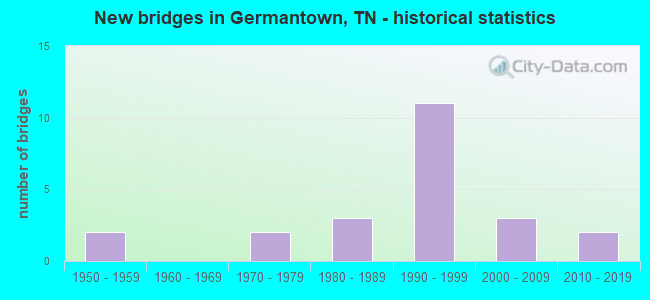
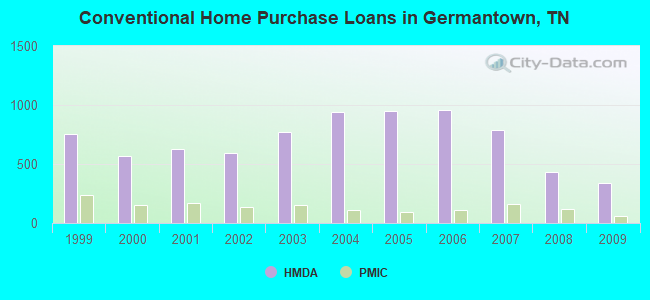
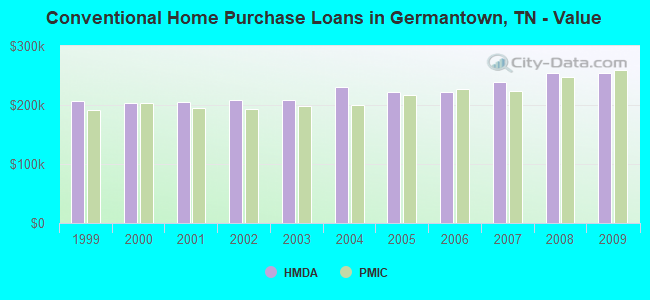
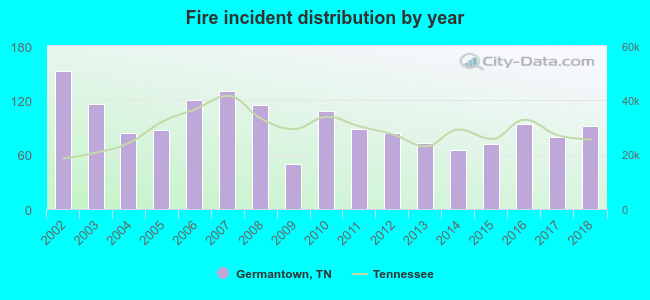 Based on the data from the years 2002 - 2018 the average number of fires per year is 95. The highest number of reported fires - 152 took place in 2002, and the least - 50 in 2009. The data has a declining trend.
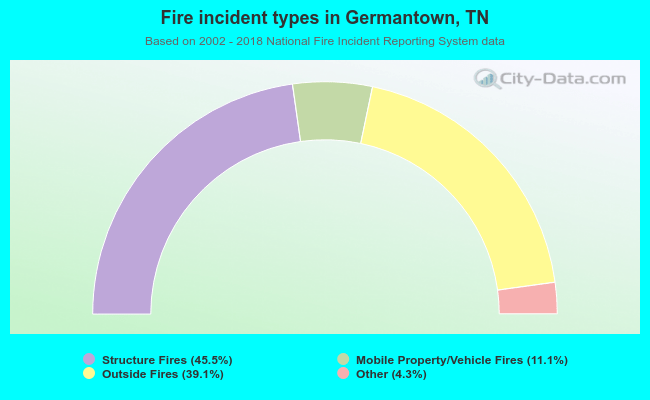 When looking into fire subcategories, the most reports belonged to: Structure Fires (45.5%), and Outside Fires (39.1%).