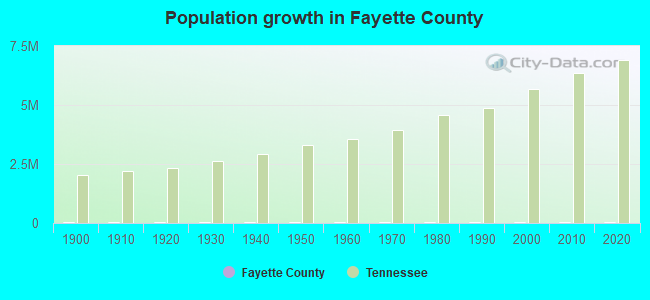
Fayette County, Tennessee (TN)
County owner-occupied free and clear houses and condos in 2010: 3,403
County owner-occupied houses and condos in 2000: 8,409
Renter-occupied apartments: 2,592 (it was 2,058 in 2000)
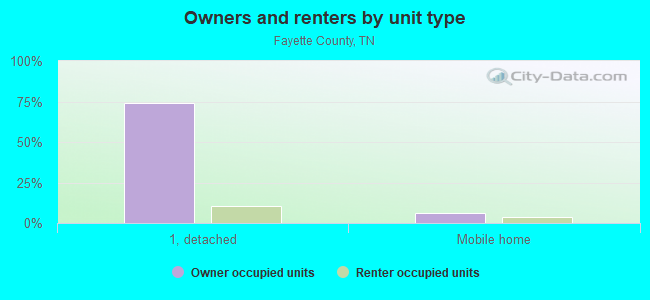
| % of renters here: | 20% |
| State: | 32% |
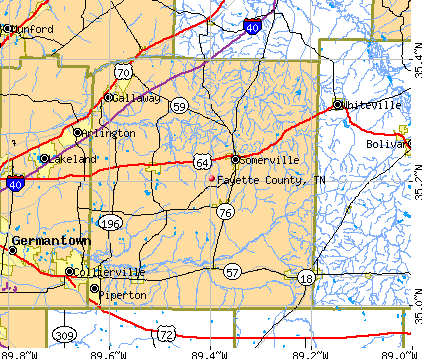
Land area: 704 sq. mi.
Water area: 1.7 sq. mi.
Population density: 61 people per square mile (average).
Industries providing employment: Educational, health and social services (18.1%), Manufacturing (13.0%), Retail trade (11.2%), Transportation and warehousing,and utilities (10.8%).
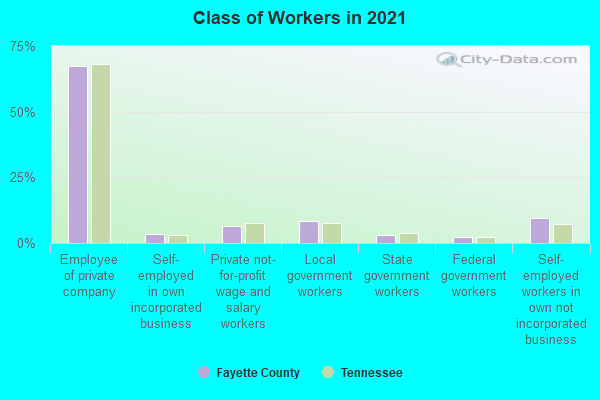
Type of workers:
- Private wage or salary: 78%
- Government: 13%
- Self-employed, not incorporated: 9%
- Unpaid family work: 0%
- OSM Map
- General Map
- Google Map
- MSN Map

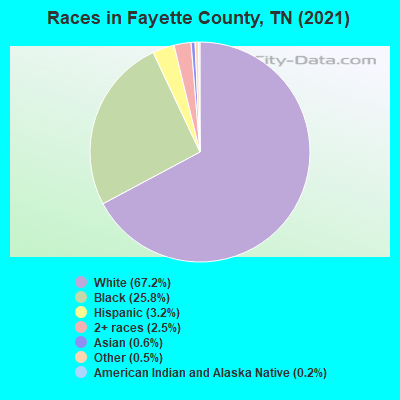
- 28,43766.7%White Non-Hispanic Alone
- 11,08326.0%Black Non-Hispanic Alone
- 1,4323.4%Hispanic or Latino
- 1,2753.0%Two or more races
- 2880.7%Asian alone
- 1220.3%Some other race alone
- 140.03%American Indian and Alaska Native alone
| Median resident age: | 47.2 years |
| Tennessee median age: | 39.2 years |
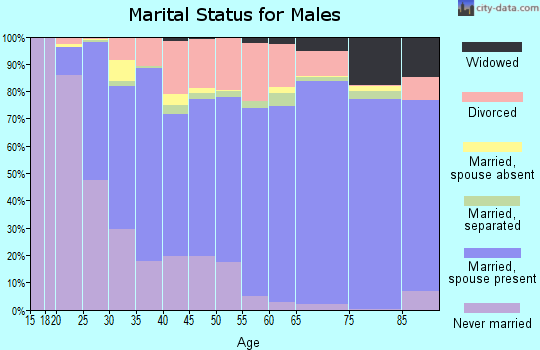
| Males: 21,449 | |
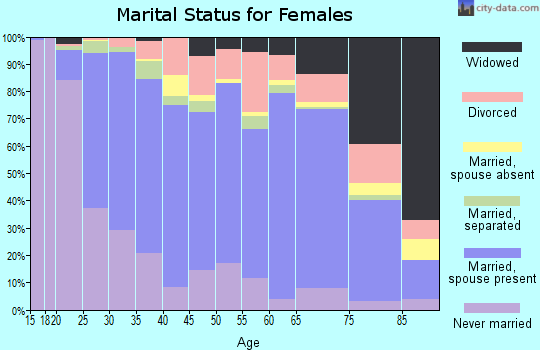
| Females: 21,557 |

 | New metro area definitions and populations (19 replies) |
| Tennessee's 2020 Census results (70 replies) |
| COVID-19 in Tennessee (237 replies) |
| Eads but closest to shopping (2 replies) |
| Tennessee vs texas (37 replies) |
| Collierville or Germantown better for a young family? (35 replies) |
| Fayette County: | 2.0 people |
| Tennessee: | 2 people |
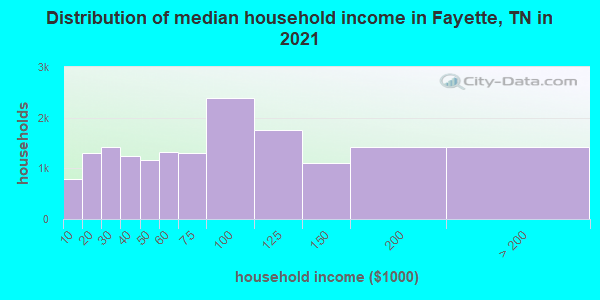
Estimated median household income in 2022: $82,617 ($40,279 in 1999)
| This county: | $82,617 |
| Tennessee: | $65,254 |
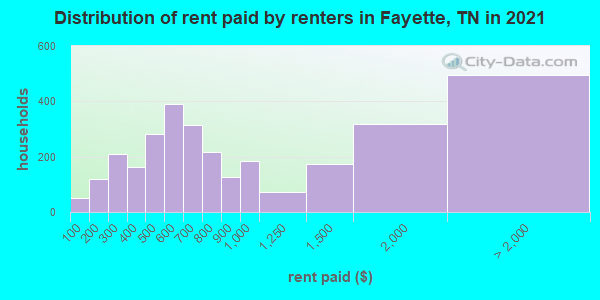
Median contract rent in 2022 for apartments: $690 (lower quartile is $507, upper quartile is $989)
| This county: | $690 |
| State: | $884 |
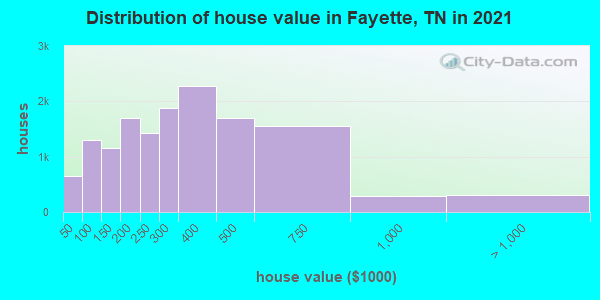
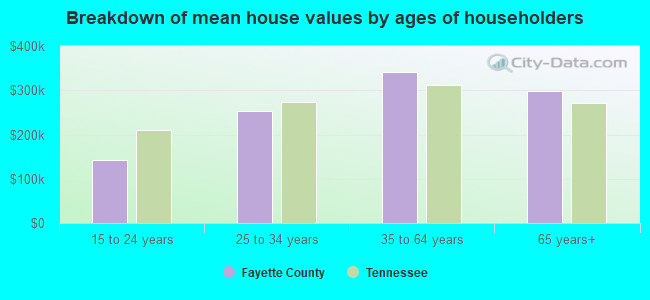
Estimated median house or condo value in 2022: $346,766 (it was $96,800 in 2000)
| Fayette: | $346,766 |
| Tennessee: | $284,800 |
Mean price in 2022:
Median monthly housing costs for homes and condos with a mortgage: $1,566Detached houses: $392,642
Here: $392,642 State: $374,382 Townhouses or other attached units: $490,223
Here: $490,223 State: $354,101 Mobile homes: $101,378
Here: $101,378 State: $101,421
Median monthly housing costs for units without a mortgage: $443
Institutionalized population: 388
Crime in 2021 (reported by the sheriff's office or county police, not the county total):
- Murders: 2
- Rapes: 0
- Robberies: 2
- Assaults: 38
- Burglaries: 28
- Thefts: 77
- Auto thefts: 20
Crime in 2020 (reported by the sheriff's office or county police, not the county total):
- Murders: 0
- Rapes: 1
- Robberies: 4
- Assaults: 59
- Burglaries: 29
- Thefts: 81
- Auto thefts: 34
Health of residents in Fayette County based on CDC Behavioral Risk Factor Surveillance System Survey Questionnaires from 2013 to 2021:
General health status score of residents in this county from 1 (poor) to 5 (excellent) is 3.2. This is significantly worse than average.64.6% of residents exercised in the past month. This is less than average.
41.4% of residents smoked 100+ cigarettes in their lives. This is about average.
42.2% of adult residents drank alcohol in the past 30 days. This is less than average.
60.4% of residents visited a dentist within the past year. This is less than average.
Average weight of males is 203 pounds. This is more than average.
Average weight of females is 171 pounds. This is more than average.
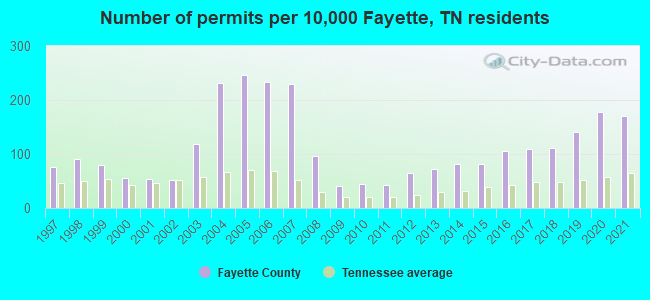
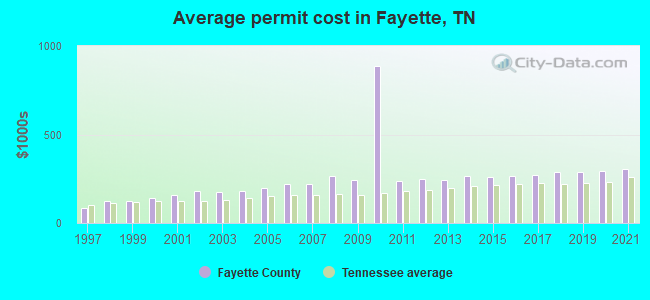
Single-family new house construction building permits:
- 2022: 459 buildings, average cost: $328,000
- 2021: 490 buildings, average cost: $305,500
- 2020: 510 buildings, average cost: $292,800
- 2019: 406 buildings, average cost: $286,000
- 2018: 323 buildings, average cost: $286,100
- 2017: 315 buildings, average cost: $273,800
- 2016: 304 buildings, average cost: $267,100
- 2015: 236 buildings, average cost: $258,000
- 2014: 235 buildings, average cost: $266,100
- 2013: 210 buildings, average cost: $243,100
- 2012: 187 buildings, average cost: $246,600
- 2011: 125 buildings, average cost: $238,800
- 2010: 127 buildings, average cost: $888,300
- 2009: 119 buildings, average cost: $244,400
- 2008: 277 buildings, average cost: $266,200
- 2007: 660 buildings, average cost: $220,700
- 2006: 670 buildings, average cost: $222,800
- 2005: 708 buildings, average cost: $199,400
- 2004: 664 buildings, average cost: $180,000
- 2003: 341 buildings, average cost: $174,800
- 2002: 150 buildings, average cost: $181,100
- 2001: 156 buildings, average cost: $157,300
- 2000: 162 buildings, average cost: $139,300
- 1999: 231 buildings, average cost: $126,700
- 1998: 262 buildings, average cost: $121,600
- 1997: 219 buildings, average cost: $82,900
Median real estate property taxes paid for housing units with mortgages in 2022: $1,120 (0.3%)
Median real estate property taxes paid for housing units with no mortgage in 2022: $899 (0.3%)
| Fayette County: | 9.2% |
| Tennessee: | 13.3% |
Median age of residents in 2022: 47.2 years old
(Males: 46.3 years old, Females: 48.2 years old)
(Median age for: White residents: 51.1 years old, Black residents: 41.5 years old, American Indian residents: 18.9 years old, Asian residents: 43.9 years old, Hispanic or Latino residents: 26.5 years old, Other race residents: 29.8 years old)
Area name: Memphis, TN-MS-AR HUD Metro FMR Area
Fair market rent in 2006 for a 1-bedroom apartment in Fayette County is $572 a month.
Fair market rent for a 2-bedroom apartment is $636 a month.
Fair market rent for a 3-bedroom apartment is $847 a month.
Cities in this county include: Hickory Withe, Somerville, Oakland, Fayette Corners, Gallaway, Piperton, Moscow, Rossville, Williston, Braden.
Notable locations in this county outside city limits:
Notable locations in Fayette County: Pleasant Site (A), McNairy County Farm (B), McNairy County Landfill (C), Martin Camp (D), McNairy County Fire Department Station 33 Big Hill Pond Fire Department (E), McNairy County Fire Department Station 12 Leapwood Fire Department (F), McNairy County Fire Department Station 23 Pleasant Site Fire Department (G), McNairy County Fire Department Station 41 Sulphur Springs Fire Department (H), McNairy County Fire Department Station 13 Beauty Hill Fire Department (I), McNairy County Fire Department Station 42 Byrd Locke Fire Department (J), McNairy County Fire Department Station 31 Chewalla Fire Department (K), McNairy County Fire Department Station 22 Lawton Fire Department (L), McNairy County Fire Department Station 11 McNairy Fire Department (M), McNairy County Fire Department Station 43 Rose Creek Fire Department (N), McNairy County Fire Department Station 32 Wolf Pen Fire Department (O). Display/hide their locations on the map
Churches in Fayette County include: Eureka Church (A), Falcon Church (B), West Shiloh Baptist Church (C), Pleasant Site Baptist Church (D), Good Hope Baptist Church (E), Prices Chapel (F), Prospect Church (G), Liberty Church (H), Refuge Church (I). Display/hide their locations on the map
Cemeteries: Houston Cemetery (1), Sanders Cemetery (2), Indian Creek Cemetery (3), Turner Cemetery (4), Warren Cemetery (5), Mount Zion Cemetery (6), Kirk Cemetery (7). Display/hide their locations on the map
Lakes, reservoirs, and swamps: Big Hill Pond (A), Turner Lake (B), Pocahontas Lake (C), J J Madison Lake (D), Logans Lake (E), Twin Springs Lake (F), Big Hill Pond Lake (G), Dismal Swamp (H). Display/hide their locations on the map
Streams, rivers, and creeks: Little White Oak Creek (A), Little Snake Creek (B), Little Owl Creek (C), Lick Creek (D), Liberty Branch (E), Larue Branch (F), Kise Creek (G), Kirk Branch (H), King Branch (I). Display/hide their locations on the map
Neighboring counties: Crittenden County, Arkansas  , Limestone County, Alabama
  , Lenoir County, North Carolina , Wayne County, North Carolina .
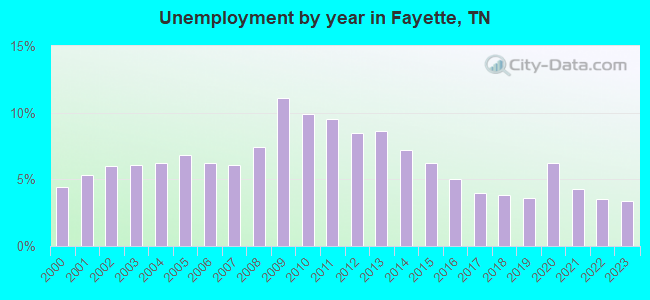
| Here: | 3.8% |
| Tennessee: | 3.0% |
Current college students: 775
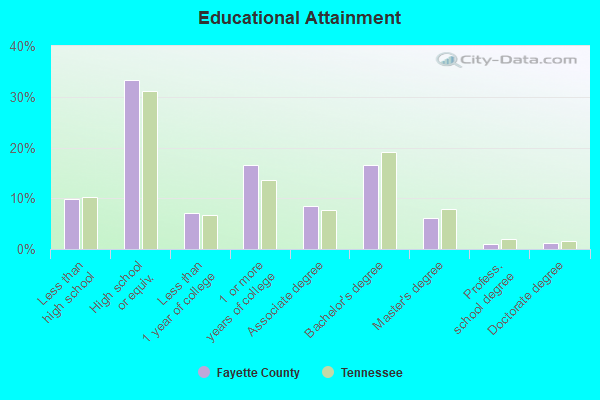
People 25 years of age or older with a high school degree or higher: 90.3%
People 25 years of age or older with a bachelor's degree or higher: 25.7%
Number of foreign born residents: 1,076 (47.8% naturalized citizens)
| Fayette County: | 2.5% |
| Whole state: | 5.6% |
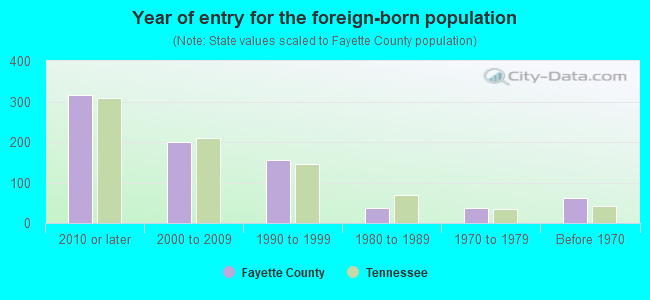
- Year of entry for the foreign-born population
- 3712010 or later
- 3122000 to 2009
- 1831990 to 1999
- 381980 to 1989
- 381970 to 1979
- 61Before 1970
Mean travel time to work (commute): " minutes
Percentage of county residents living and working in this county: 96.1%
Housing units in structures:
- One, detached: 15,206
- One, attached: 246
- Two: 200
- 3 or 4: 190
- 5 to 9: 201
- 10 to 19: 108
- 20 to 49: 57
- 50 or more: 1
- Mobile homes: 1,982
- Boats, RVs, vans, etc.: 10
Housing units in Fayette County with a mortgage: 8,387 (783 second mortgage, 111 home equity loan, 394 both second mortgage and home equity loan)
Houses without a mortgage: 111
| Here: | 6.7% with mortgage |
| State: | 97.8% with mortgage |
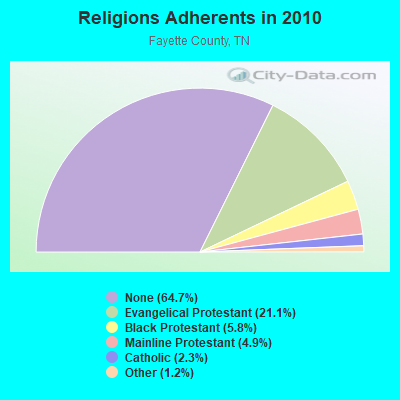
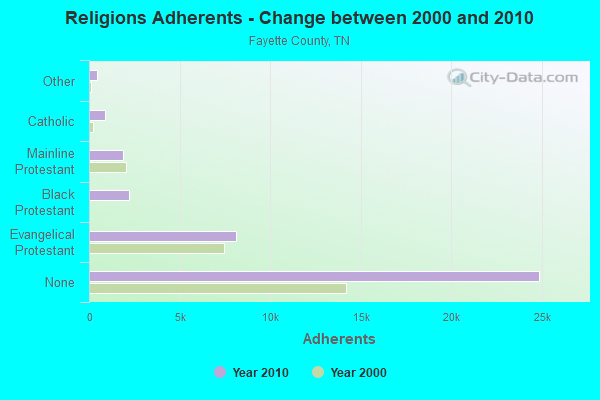
Religion statistics for Fayette County
| Religion | Adherents | Congregations |
|---|---|---|
| Evangelical Protestant | 8,093 | 40 |
| Black Protestant | 2,221 | 17 |
| Mainline Protestant | 1,882 | 20 |
| Catholic | 900 | 1 |
| Other | 458 | 2 |
| None | 24,859 | - |
Source: Clifford Grammich, Kirk Hadaway, Richard Houseal, Dale E.Jones, Alexei Krindatch, Richie Stanley and Richard H.Taylor. 2012. 2010 U.S.Religion Census: Religious Congregations & Membership Study. Association of Statisticians of American Religious Bodies. Jones, Dale E., et al. 2002. Congregations and Membership in the United States 2000. Nashville, TN: Glenmary Research Center.
Food Environment Statistics:
| Fayette County: | 1.08 / 10,000 pop. |
| State: | 1.99 / 10,000 pop. |
| This county: | 0.81 / 10,000 pop. |
| Tennessee: | 0.65 / 10,000 pop. |
| Fayette County: | 4.31 / 10,000 pop. |
| Tennessee: | 5.16 / 10,000 pop. |
| This county: | 5.12 / 10,000 pop. |
| State: | 6.56 / 10,000 pop. |
| Fayette County: | 11.1% |
| Tennessee: | 11.4% |
| Fayette County: | 33.8% |
| State: | 30.2% |
| Here: | 12.5% |
| State: | 13.5% |
Agriculture in Fayette County:
Average size of farms: 306 acresAverage value of agricultural products sold per farm: $42,543
Average value of crops sold per acre for harvested cropland: $236.31
The value of nursery, greenhouse, floriculture, and sod as a percentage of the total market value of agricultural products sold: 1.62%
The value of livestock, poultry, and their products as a percentage of the total market value of agricultural products sold: 22.85%
Average total farm production expenses per farm: $40,591
Harvested cropland as a percentage of land in farms: 45.35%
Average market value of all machinery and equipment per farm: $62,943
The percentage of farms operated by a family or individual: 92.28%
Average age of principal farm operators: 56 years
Average number of cattle and calves per 100 acres of all land in farms: 6.89
Milk cows as a percentage of all cattle and calves: 3.88%
Corn for grain: 12291 harvested acres
All wheat for grain: 6649 harvested acres
Upland cotton: 46115 harvested acres
Soybeans for beans: 33132 harvested acres
Tornado activity:
Fayette County historical area-adjusted tornado activity is significantly below Tennessee state average. It is 3179211.3 times below overall U.S. average.Tornadoes in this county have caused 4 fatalities and 98 injuries recorded between 1950 and 2004.
On 3/22/1991, a category 3 (max. wind speeds 158-206 mph) tornado killed 4 people and injured 45 people and caused between $5,000,000 and $50,000,000 in damages.
Earthquake activity:
Fayette County-area historical earthquake activity is significantly above Tennessee state average. It is 346% greater than the overall U.S. average.On 3/25/1976 at 00:41:20, a magnitude 5.0 (4.9 MB, 5.0 LG, Class: Moderate, Intensity: VI - VII) earthquake occurred 60.3 miles away from Fayette County center
On 5/4/1991 at 01:18:54, a magnitude 5.0 (4.4 MB, 4.6 LG, 5.0 LG, Depth: 3.1 mi) earthquake occurred 97.0 miles away from the county center
On 4/27/1989 at 16:47:49, a magnitude 4.7 (4.6 MB, 4.7 LG, 4.3 LG, Class: Light, Intensity: IV - V) earthquake occurred 59.2 miles away from the county center
On 9/26/1990 at 13:18:51, a magnitude 5.0 (4.7 MB, 4.8 LG, 5.0 LG, Depth: 7.7 mi) earthquake occurred 135.9 miles away from the county center
On 4/18/2008 at 09:36:59, a magnitude 5.4 (5.1 MB, 4.8 MS, 5.4 MW, 5.2 MW) earthquake occurred 239.7 miles away from Fayette County center
On 3/25/1976 at 01:00:11, a magnitude 4.5 (4.1 MB, 4.5 LG) earthquake occurred 67.1 miles away from the county center
Magnitude types: regional Lg-wave magnitude (LG), body-wave magnitude (MB), surface-wave magnitude (MS), moment magnitude (MW)
Most recent natural disasters:
- Tennessee Covid-19 Pandemic, Incident Period: January 20, 2020, FEMA Id: 4514, Natural disaster type: Other
- Tennessee Severe Storms, Straight-line Winds, And Flooding, Incident Period: May 27, 2017 - May 28, 2017, FEMA Id: 4320, Natural disaster type: Storm, Flood, Wind
- Tennessee Severe Winter Storm, Incident Period: March 02, 2014 to March 04, 2014, Major Disaster (Presidential) Declared DR-4171: April 11, 2014, FEMA Id: 4171, Natural disaster type: Winter Storm
- Tennessee Severe Storms, Tornadoes, Straight-line Winds, and Associated Flooding, Incident Period: April 25, 2011 to April 28, 2011, Major Disaster (Presidential) Declared DR-1974: May 01, 2011, FEMA Id: 1974, Natural disaster type: Storm, Tornado, Flood, Wind
- Tennessee Severe Storms, Flooding, Straight-Line Winds, and Tornadoes, Incident Period: April 30, 2010 to May 18, 2010, Major Disaster (Presidential) Declared DR-1909: May 04, 2010, FEMA Id: 1909, Natural disaster type: Storm, Tornado, Flood, Wind
- Tennessee Severe Storms, Tornadoes, Straight-Line Winds, and Flooding, Incident Period: June 12, 2009 to June 14, 2009, Major Disaster (Presidential) Declared DR-1851: July 13, 2009, FEMA Id: 1851, Natural disaster type: Storm, Tornado, Flood, Wind
- Tennessee Severe Storms, Tornadoes, Straight-line Winds, and Flooding, Incident Period: February 05, 2008 to February 06, 2008, Major Disaster (Presidential) Declared DR-1745: February 07, 2008, FEMA Id: 1745, Natural disaster type: Storm, Tornado, Flood, Wind
- Tennessee Severe Storms and Tornadoes, Incident Period: April 02, 2006 to April 08, 2006, Major Disaster (Presidential) Declared DR-1634: April 05, 2006, FEMA Id: 1634, Natural disaster type: Storm, Tornado
- Tennessee Hurricane Katrina Evacuation, Incident Period: August 29, 2005 to October 01, 2005, Emergency Declared EM-3217: September 05, 2005, FEMA Id: 3217, Natural disaster type: Hurricane
- Tennessee Severe Storms, High Winds, and Heavy Rain, Incident Period: July 21, 2003 to July 22, 2003, Major Disaster (Presidential) Declared DR-1482: July 29, 2003, FEMA Id: 1482, Natural disaster type: Storm, Wind, Heavy Rain
- 3 other natural disasters have been reported since 1953.
The number of natural disasters in Fayette County (13) is near the US average (15).
Major Disasters (Presidential) Declared: 10
Emergencies Declared: 1
Causes of natural disasters: Storms: 9, Tornadoes: 7, Winds: 7, Floods: 6, Winter Storms: 2, Flash Flood: 1, Heavy Rain: 1, Hurricane: 1, Ice Storm: 1, Other: 1 (Note: some incidents may be assigned to more than one category).
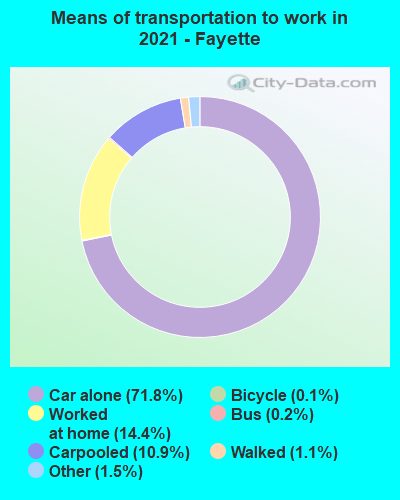
Means of transportation to work:
- Drove a car alone: 6,962 (67.9%)
- Carpooled: 932 (9.1%)
- Bus: 11 (0.1%)
- Taxicab, motorcycle, or other means: 171 (1.7%)
- Bicycle: 13 (0.1%)
- Walked: 94 (0.9%)
- Worked at home: 2,406 (23.5%)

- Health care and social assistance (18%)
- Retail trade (11%)
- Manufacturing (8%)
- Educational services (7%)
- Professional, scientific, and technical services (6%)
- Other services, except public administration (5%)
- Finance and insurance (5%)
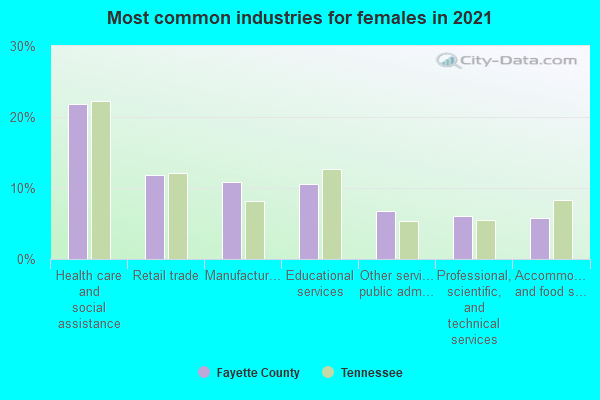
- Health care and social assistance (22%)
- Retail trade (13%)
- Manufacturing (10%)
- Educational services (9%)
- Professional, scientific, and technical services (7%)
- Other services, except public administration (6%)
- Finance and insurance (6%)
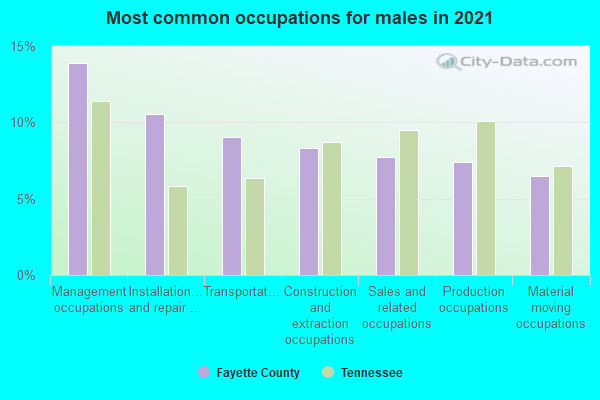
- Management occupations (13%)
- Installation, maintenance, and repair occupations (11%)
- Transportation occupations (10%)
- Construction and extraction occupations (9%)
- Sales and related occupations (8%)
- Production occupations (8%)
- Material moving occupations (7%)
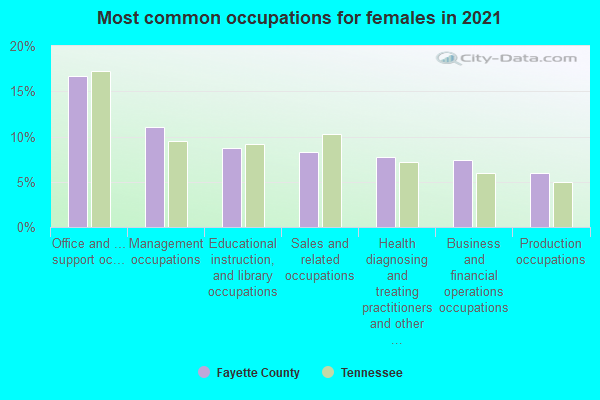
- Office and administrative support occupations (20%)
- Sales and related occupations (10%)
- Management occupations (10%)
- Health diagnosing and treating practitioners and other technical occupations (8%)
- Educational instruction, and library occupations (7%)
- Business and financial operations occupations (7%)
- Production occupations (6%)
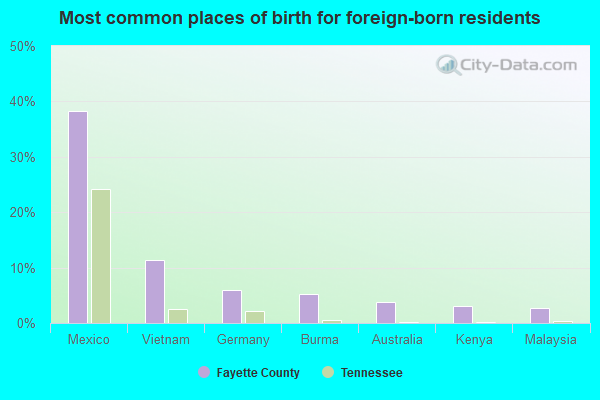
- Mexico (36%)
- Germany (9%)
- Vietnam (9%)
- Iraq (5%)
- Dominican Republic (4%)
- Burma (Myanmar) (4%)
- Malaysia (2%)
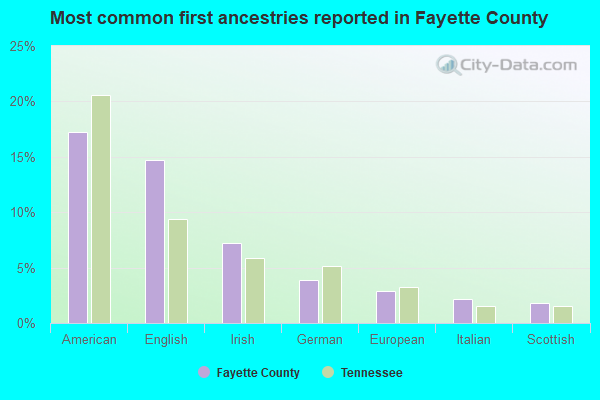
- American (16%)
- English (14%)
- Irish (8%)
- German (4%)
- Italian (2%)
- European (2%)
- Scottish (2%)
People in group quarters in Fayette County, Tennessee in 2010:
- 172 people in nursing facilities/skilled-nursing facilities
- 103 people in local jails and other municipal confinement facilities
- 93 people in correctional facilities intended for juveniles
- 20 people in residential treatment centers for juveniles (non-correctional)
- 17 people in emergency and transitional shelters (with sleeping facilities) for people experiencing homelessness
- 7 people in workers' group living quarters and job corps centers
- 6 people in group homes intended for adults
- 3 people in other noninstitutional facilities
People in group quarters in Fayette County, Tennessee in 2000:
- 155 people in nursing homes
- 136 people in residential treatment centers for emotionally disturbed children
- 94 people in local jails and other confinement facilities (including police lockups)
- 7 people in homes for the mentally ill
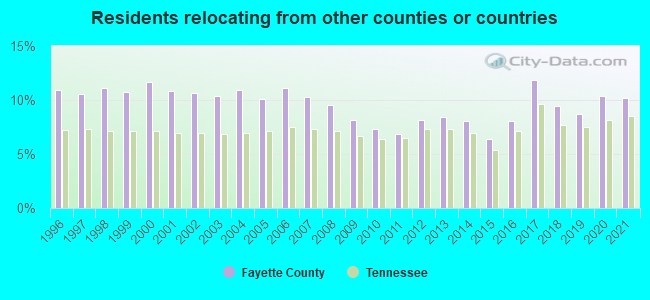
10.18% of this county's 2021 resident taxpayers lived in other counties in 2020 ($85,558 average adjusted gross income)
| Here: | 10.18% |
| Tennessee average: | 8.49% |
10 or fewer of this county's residents moved from foreign countries.
7.51% relocated from other counties in Tennessee ($61,915 average AGI)
2.67% relocated from other states ($23,643 average AGI)
Fayette County: 2.67% Tennessee average: 4.34%
Top counties from which taxpayers relocated into this county between 2020 and 2021:
| from Shelby County, TN | |
| from DeSoto County, MS | |
| from Hardeman County, TN | |
| from Tipton County, TN | |
| from Haywood County, TN | |
| from Marshall County, MS |
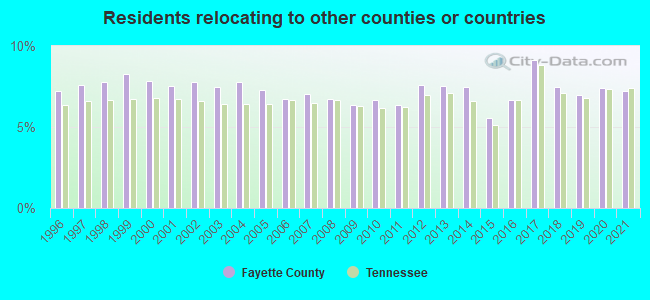
7.19% of this county's 2020 resident taxpayers moved to other counties in 2021 ($71,519 average adjusted gross income)
| Here: | 7.19% |
| Tennessee average: | 7.40% |
10 or fewer of this county's residents moved to foreign countries.
5.16% relocated to other counties in Tennessee ($51,808 average AGI)
2.04% relocated to other states ($19,711 average AGI)
Fayette County: 2.04% Tennessee average: 3.20%
Top counties to which taxpayers relocated from this county between 2020 and 2021:
| to Shelby County, TN | |
| to Hardeman County, TN | |
| to DeSoto County, MS | |
| to Tipton County, TN | |
| to Haywood County, TN |
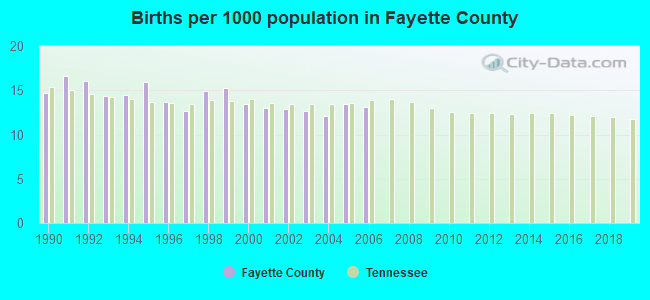
Births per 1000 population from 1990 to 1999: 14.9
Births per 1000 population from 2000 to 2006: 13.0
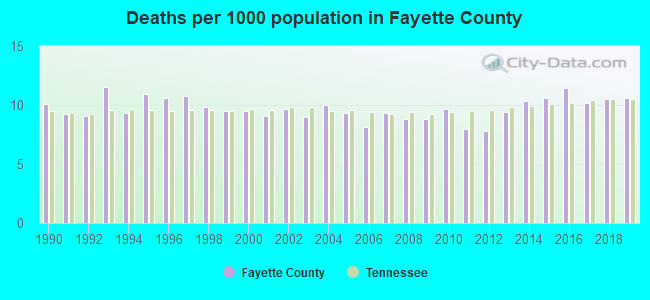
Deaths per 1000 population from 1990 to 1999: 10.1
Deaths per 1000 population from 2000 to 2009: 9.2
Deaths per 1000 population from 2010 to 2020: 10.1
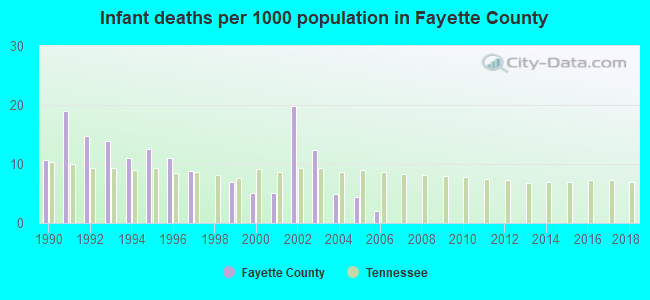
Infant deaths per 1000 live births from 1990 to 1999: 10.9
Infant deaths per 1000 live births from 2000 to 2006: 7.7
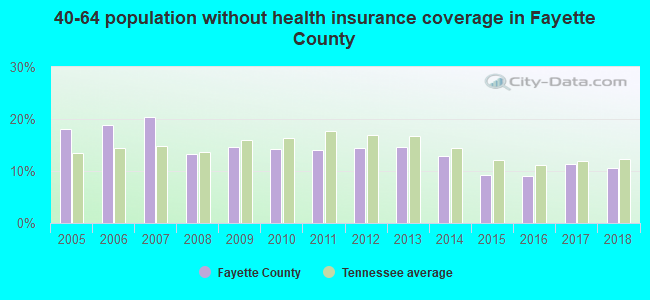
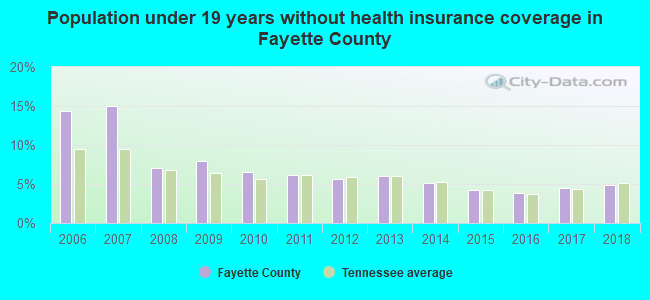
Persons under 19 years old without health insurance coverage in 2018: 4.9%
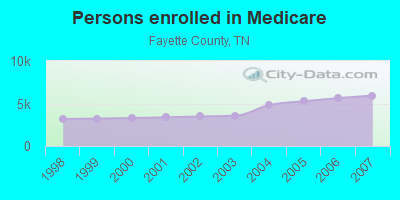
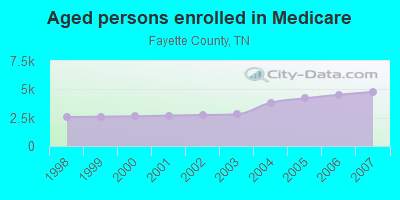
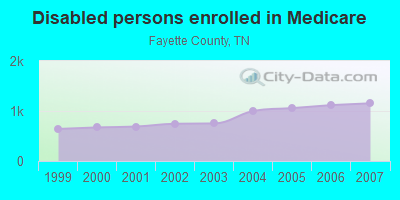
Persons enrolled in hospital insurance and/or supplemental medical insurance (Medicare) in July 1, 2007: 5,934 (4,780 aged, 1,154 disabled)
Children under 18 without health insurance coverage in 2007: 1,083 (11%)
Most common underlying causes of death in Fayette County, Tennessee in 1999 - 2019:
- Acute myocardial infarction, unspecified (589)
- Atherosclerotic heart disease (510)
- Bronchus or lung, unspecified - Malignant neoplasms (464)
- Atherosclerotic cardiovascular disease, so described (268)
- Chronic obstructive pulmonary disease, unspecified (243)
- Unspecified dementia (151)
- Stroke, not specified as haemorrhage or infarction (114)
- Alzheimer disease, unspecified (112)
- Unspecified diabetes mellitus, without complications (109)
- Congestive heart failure (65)
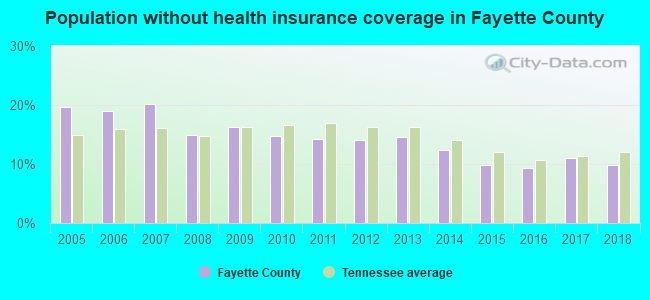
Population without health insurance coverage in 2000: 13%
Children under 18 without health insurance coverage in 2000: 8%
Short term general hospital admissions per 100,000 population in 2004: 2,275
Short term general hospital beds per 100,000 population in 2004: 30
Emergency room visits per 100,000 population in 2004: 21,836
General practice office based MDs per 100,000 population in 2005: 1,286
Medical specialist MDs per 100,000 population in 2005: 949
Dentists per 100,000 population in 1998: 3
Total births per 100,000 population, July 2005 - July 2006 : 10
Total deaths per 100,000 population, July 2005 - July 2006: 23
Limited-service eating places per 100,000 population in 2005 : 9
Suicides per 1,000,000 population from 2000 to 2006: 93.3. This is less than state average.
Household type by relationship:
Households: 43,006- Male householders: 9,164 (2,050 living alone), Female householders: 8,043 (2,049 living alone)
9,631 spouses (9,573 opposite-sex spouses), 768 unmarried partners, (768 opposite-sex unmarried partners), 10,957 children (10,048 natural, 291 adopted, 611 stepchildren), 1,212 grandchildren, 739 brothers or sisters, 637 parents, 1 foster children, 833 other relatives, 558 non-relatives
- In group quarters: 541
Size of family households: 6,148 2-persons, 2,860 3-persons, 1,953 4-persons, 1,096 5-persons, 279 6-persons, 162 7-or-more-persons.
Size of nonfamily households: 4,092 1-person, 578 2-persons, 38 3-persons.
4,793 married couples with children.
1,902 single-parent households (545 men, 1,357 women).
96.5% of residents of Fayette speak English at home.
2.5% of residents speak Spanish at home (50% speak English very well, 21% speak English well, 22% speak English not well, 7% don't speak English at all).
0.2% of residents speak other Indo-European language at home (100% speak English very well).
0.6% of residents speak Asian or Pacific Island language at home (40% speak English very well, 29% speak English well, 29% speak English not well, 3% don't speak English at all).
0.3% of residents speak other language at home (53% speak English very well, 19% speak English well, 16% speak English not well, 12% don't speak English at all).
In fiscal year 2004:
Federal Government expenditure: $169,111,000 ($5,029 per capita)
Department of Defense expenditure: $2,669,000
Federal direct payments to individuals for retirement and disability: $58,537,000
Federal other direct payments to individuals: $31,142,000
Federal direct payments not to individuals: $7,623,000
Federal grants: $67,479,000
Federal procurement contracts: $822,000 ($20,000 Department of Defense)
Federal salaries and wages: $3,509,000 ($1,000 Department of Defense)
Federal Government direct loans: $2,554,000
Federal guaranteed/insured loans: $22,545,000
Federal Government insurance: $15,712,000
Population change from April 1, 2000 to July 1, 2005:
Births: 2,160| Here: | 63 per 1000 residents |
| State: | 69 per 1000 residents |
Deaths: 1,515
| Here: | 44 per 1000 residents |
| State: | 50 per 1000 residents |
Net international migration: +37
| Here: | +1 per 1000 residents |
| State: | +8 per 1000 residents |
Net internal migration: +5,026
| Here: | +146 per 1000 residents |
| State: | +18 per 1000 residents |
Total withdrawal of fresh water for public supply: 1.56 millions of gallons per day (all from ground)
| Here: | 7.2 |
| State: | 6.5 |
| Here: | 5.1 |
| State: | 4.4 |
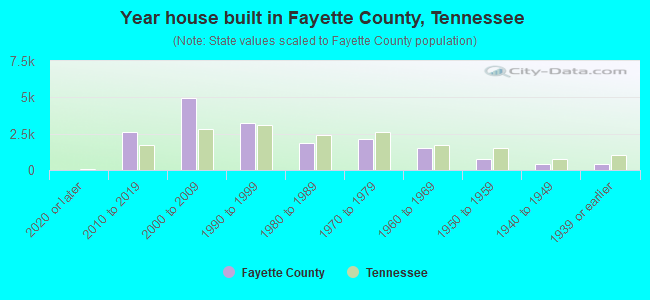
- Year house built in Fayette County, Tennessee
- 1772020 or later
- 2,6062010 to 2019
- 5,2962000 to 2009
- 3,2911990 to 1999
- 1,7831980 to 1989
- 2,0821970 to 1979
- 1,4951960 to 1969
- 6551950 to 1959
- 3791940 to 1949
- 3571939 or earlier
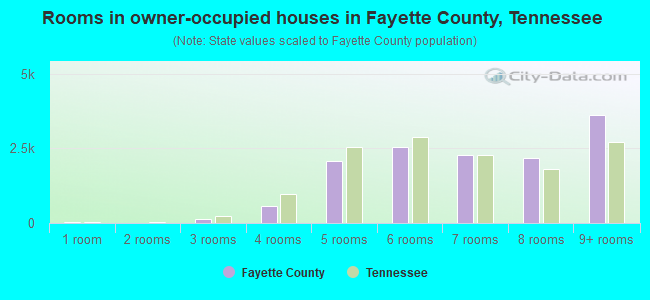
- Rooms in owner-occupied houses in Fayette County, Tennessee
- 431 room
- 252 rooms
- 1803 rooms
- 6164 rooms
- 2,0635 rooms
- 2,3396 rooms
- 2,4497 rooms
- 2,4178 rooms
- 3,9779+ rooms
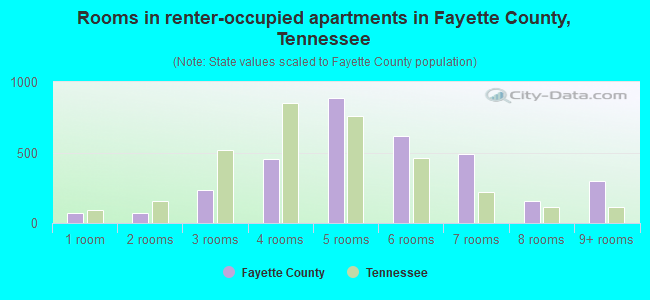
- Rooms in renter-occupied apartments in Fayette County, Tennessee
- 1241 room
- 802 rooms
- 2623 rooms
- 5314 rooms
- 8205 rooms
- 4426 rooms
- 4367 rooms
- 1568 rooms
- 2899+ rooms
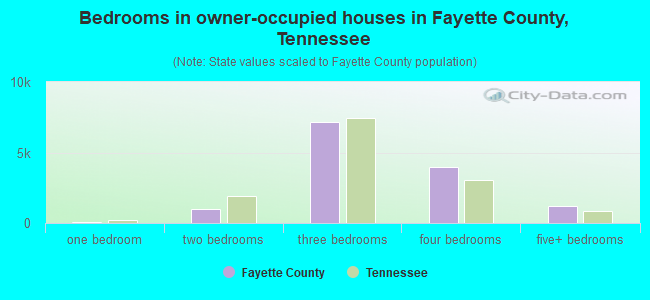
- Bedrooms in owner-occupied houses in Fayette County, Tennessee
- 51no bedroom
- 1241 bedroom
- 9922 bedrooms
- 7,1213 bedrooms
- 4,3514 bedrooms
- 1,5185+ bedrooms
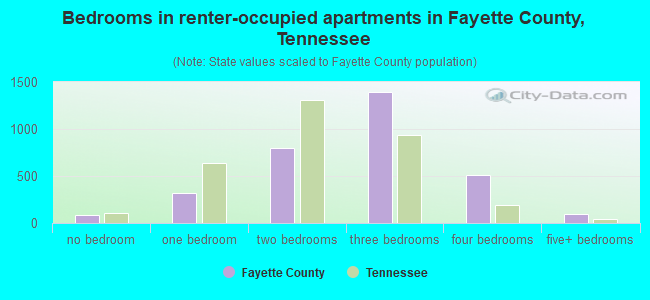
- Bedrooms in renter-occupied apartments in Fayette County, Tennessee
- 128no bedroom
- 3431 bedroom
- 8622 bedrooms
- 1,2993 bedrooms
- 4264 bedrooms
- 825+ bedrooms
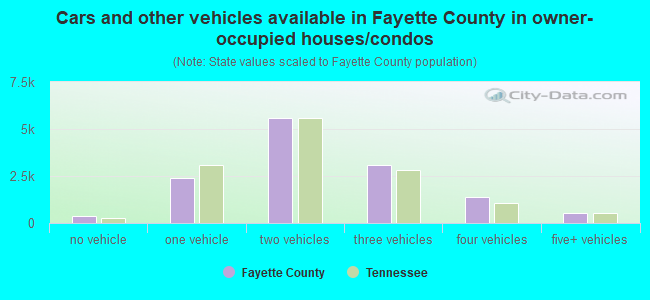
- Cars and other vehicles available in Fayette County in owner-occupied houses/condos
- 508no vehicle
- 2,3081 vehicle
- 5,9582 vehicles
- 3,1933 vehicles
- 1,3674 vehicles
- 7515+ vehicles
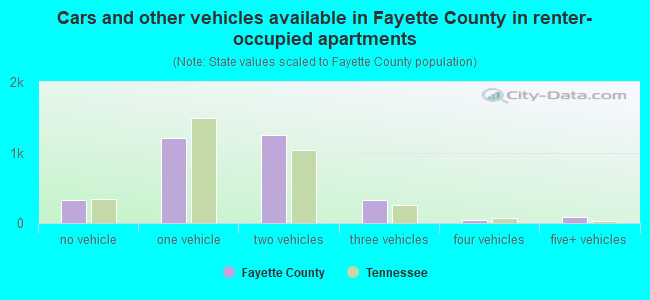
- Cars and other vehicles available in Fayette County in renter-occupied apartments
- 332no vehicle
- 1,2591 vehicle
- 1,1102 vehicles
- 3483 vehicles
- 494 vehicles
- 555+ vehicles
91.5% of Fayette County residents lived in the same house 1 years ago.
Out of people who lived in different houses, 22% lived in this county.
Out of people who lived in different counties, 61% lived in Tennessee.
| Fayette County: | 91.5% |
| State average: | 87.0% |
Place of birth for U.S.-born residents:
- This state: 28,550
- Other state: 12,933
- Northeast: 1,414
- Midwest: 2,889
- South: 7,403
- West: 1,204
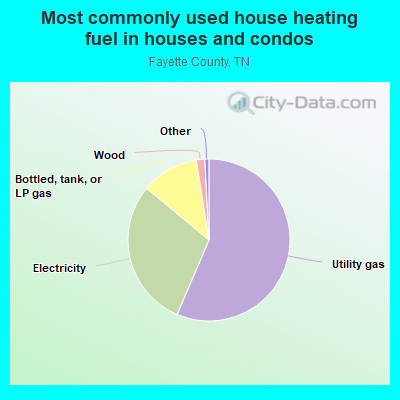
- 56.3%Utility gas
- 30.4%Electricity
- 11.1%Bottled, tank, or LP gas
- 1.6%Wood
- 0.5%Other fuel
- 0.1%No fuel used
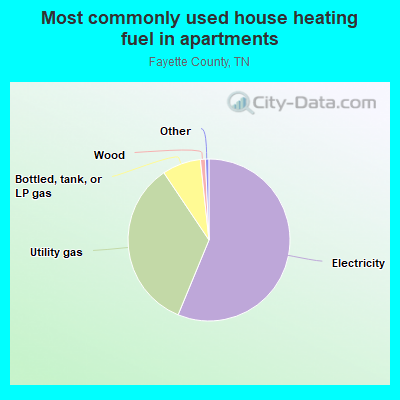
- 53.1%Electricity
- 36.4%Utility gas
- 9.2%Bottled, tank, or LP gas
- 0.8%Wood
- 0.3%Other fuel
- 0.2%Fuel oil, kerosene, etc.
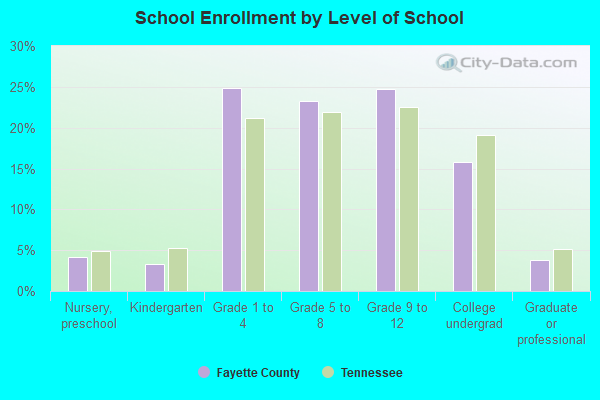
Private vs. public school enrollment:
| Here: | 31.8% |
| Tennessee: | 15.0% |
| Here: | 46.3% |
| Tennessee: | 16.2% |
| Here: | 24.4% |
| Tennessee: | 23.5% |
Fayette County government finances - Expenditure in 2017:
- Bond Funds - Cash and Securities: $360,000
- Charges - Other: $1,483,000
Elementary and Secondary Education - Other: $781,000
Solid Waste Management: $532,000
Air Transportation: $187,000
Elementary and Secondary Education School Lunch: $11,000
- Construction - Regular Highways: $3,556,000
Elementary and Secondary Education: $1,266,000
- Current Operations - Elementary and Secondary Education: $29,695,000
Correctional Institutions: $2,784,000
Police Protection: $2,750,000
Health - Other: $2,319,000
General - Other: $1,834,000
Regular Highways: $1,725,000
Central Staff Services: $1,393,000
Solid Waste Management: $959,000
Judicial and Legal Services: $916,000
Financial Administration: $632,000
Local Fire Protection: $533,000
Public Welfare - Other: $414,000
Air Transportation: $240,000
General Public Buildings: $215,000
Natural Resources - Other: $201,000
Libraries: $196,000
Sewerage: $47,000
- Federal Intergovernmental - Housing and Community Development: $8,000
- General - Interest on Debt: $1,275,000
- Intergovernmental to Local - Other - Elementary and Secondary Education: $8,000
- Local Intergovernmental - Education: $76,000
Housing and Community Development: $53,000
- Long Term Debt - Beginning Outstanding - Unspecified Public Purpose: $31,875,000
Outstanding Unspecified Public Purpose: $30,203,000
Retired Unspecified Public Purpose: $1,673,000
- Miscellaneous - Sale of Property: $650,000
Special Assessments: $585,000
Donations From Private Sources: $414,000
Fines and Forfeits: $273,000
General Revenue - Other: $169,000
Interest Earnings: $101,000
Rents: $32,000
- Other Capital Outlay - Elementary and Secondary Education: $1,223,000
Judicial and Legal Services: $405,000
Local Fire Protection: $183,000
General Public Building: $69,000
Central Staff Services: $46,000
Solid Waste Management: $27,000
Financial Administration: $11,000
- Other Funds - Cash and Securities: $21,520,000
- Sinking Funds - Cash and Securities: $2,594,000
- State Intergovernmental - Education: $22,459,000
Highways: $4,158,000
Other: $1,265,000
Electric Utilities: $948,000
Housing and Community Development: $346,000
Health and Hospitals: $239,000
General Local Government Support: $160,000
Public Welfare: $36,000
- Tax - Property: $10,190,000
Motor Vehicle License: $2,907,000
Occupation and Business License - Other: $1,502,000
Other License: $779,000
General Sales and Gross Receipts: $617,000
Other Selective Sales: $364,000
Public Utility License: $204,000
Alcoholic Beverage Sales: $182,000
Alcoholic Beverage License: $1,000
- Total Salaries and Wages: $19,058,000
Fayette County government finances - Revenue in 2017:
- Bond Funds - Cash and Securities: $360,000
- Charges - Other: $1,483,000
Elementary and Secondary Education - Other: $781,000
Solid Waste Management: $532,000
Air Transportation: $187,000
Elementary and Secondary Education School Lunch: $11,000
- Construction - Regular Highways: $3,556,000
Elementary and Secondary Education: $1,266,000
- Current Operations - Elementary and Secondary Education: $29,695,000
Correctional Institutions: $2,784,000
Police Protection: $2,750,000
Health - Other: $2,319,000
General - Other: $1,834,000
Regular Highways: $1,725,000
Central Staff Services: $1,393,000
Solid Waste Management: $959,000
Judicial and Legal Services: $916,000
Financial Administration: $632,000
Local Fire Protection: $533,000
Public Welfare - Other: $414,000
Air Transportation: $240,000
General Public Buildings: $215,000
Natural Resources - Other: $201,000
Libraries: $196,000
Sewerage: $47,000
- Federal Intergovernmental - Housing and Community Development: $8,000
- General - Interest on Debt: $1,275,000
- Intergovernmental to Local - Other - Elementary and Secondary Education: $8,000
- Local Intergovernmental - Education: $76,000
Housing and Community Development: $53,000
- Long Term Debt - Beginning Outstanding - Unspecified Public Purpose: $31,875,000
Outstanding Unspecified Public Purpose: $30,203,000
Retired Unspecified Public Purpose: $1,673,000
- Miscellaneous - Sale of Property: $650,000
Special Assessments: $585,000
Donations From Private Sources: $414,000
Fines and Forfeits: $273,000
General Revenue - Other: $169,000
Interest Earnings: $101,000
Rents: $32,000
- Other Capital Outlay - Elementary and Secondary Education: $1,223,000
Judicial and Legal Services: $405,000
Local Fire Protection: $183,000
General Public Building: $69,000
Central Staff Services: $46,000
Solid Waste Management: $27,000
Financial Administration: $11,000
- Other Funds - Cash and Securities: $21,520,000
- Sinking Funds - Cash and Securities: $2,594,000
- State Intergovernmental - Education: $22,459,000
Highways: $4,158,000
Other: $1,265,000
Electric Utilities: $948,000
Housing and Community Development: $346,000
Health and Hospitals: $239,000
General Local Government Support: $160,000
Public Welfare: $36,000
- Tax - Property: $10,190,000
Motor Vehicle License: $2,907,000
Occupation and Business License - Other: $1,502,000
Other License: $779,000
General Sales and Gross Receipts: $617,000
Other Selective Sales: $364,000
Public Utility License: $204,000
Alcoholic Beverage Sales: $182,000
Alcoholic Beverage License: $1,000
- Total Salaries and Wages: $19,058,000
Fayette County government finances - Debt in 2017:
- Bond Funds - Cash and Securities: $360,000
- Charges - Other: $1,483,000
Elementary and Secondary Education - Other: $781,000
Solid Waste Management: $532,000
Air Transportation: $187,000
Elementary and Secondary Education School Lunch: $11,000
- Construction - Regular Highways: $3,556,000
Elementary and Secondary Education: $1,266,000
- Current Operations - Elementary and Secondary Education: $29,695,000
Correctional Institutions: $2,784,000
Police Protection: $2,750,000
Health - Other: $2,319,000
General - Other: $1,834,000
Regular Highways: $1,725,000
Central Staff Services: $1,393,000
Solid Waste Management: $959,000
Judicial and Legal Services: $916,000
Financial Administration: $632,000
Local Fire Protection: $533,000
Public Welfare - Other: $414,000
Air Transportation: $240,000
General Public Buildings: $215,000
Natural Resources - Other: $201,000
Libraries: $196,000
Sewerage: $47,000
- Federal Intergovernmental - Housing and Community Development: $8,000
- General - Interest on Debt: $1,275,000
- Intergovernmental to Local - Other - Elementary and Secondary Education: $8,000
- Local Intergovernmental - Education: $76,000
Housing and Community Development: $53,000
- Long Term Debt - Beginning Outstanding - Unspecified Public Purpose: $31,875,000
Outstanding Unspecified Public Purpose: $30,203,000
Retired Unspecified Public Purpose: $1,673,000
- Miscellaneous - Sale of Property: $650,000
Special Assessments: $585,000
Donations From Private Sources: $414,000
Fines and Forfeits: $273,000
General Revenue - Other: $169,000
Interest Earnings: $101,000
Rents: $32,000
- Other Capital Outlay - Elementary and Secondary Education: $1,223,000
Judicial and Legal Services: $405,000
Local Fire Protection: $183,000
General Public Building: $69,000
Central Staff Services: $46,000
Solid Waste Management: $27,000
Financial Administration: $11,000
- Other Funds - Cash and Securities: $21,520,000
- Sinking Funds - Cash and Securities: $2,594,000
- State Intergovernmental - Education: $22,459,000
Highways: $4,158,000
Other: $1,265,000
Electric Utilities: $948,000
Housing and Community Development: $346,000
Health and Hospitals: $239,000
General Local Government Support: $160,000
Public Welfare: $36,000
- Tax - Property: $10,190,000
Motor Vehicle License: $2,907,000
Occupation and Business License - Other: $1,502,000
Other License: $779,000
General Sales and Gross Receipts: $617,000
Other Selective Sales: $364,000
Public Utility License: $204,000
Alcoholic Beverage Sales: $182,000
Alcoholic Beverage License: $1,000
- Total Salaries and Wages: $19,058,000
Fayette County government finances - Cash and Securities in 2017:
- Bond Funds - Cash and Securities: $360,000
- Charges - Other: $1,483,000
Elementary and Secondary Education - Other: $781,000
Solid Waste Management: $532,000
Air Transportation: $187,000
Elementary and Secondary Education School Lunch: $11,000
- Construction - Regular Highways: $3,556,000
Elementary and Secondary Education: $1,266,000
- Current Operations - Elementary and Secondary Education: $29,695,000
Correctional Institutions: $2,784,000
Police Protection: $2,750,000
Health - Other: $2,319,000
General - Other: $1,834,000
Regular Highways: $1,725,000
Central Staff Services: $1,393,000
Solid Waste Management: $959,000
Judicial and Legal Services: $916,000
Financial Administration: $632,000
Local Fire Protection: $533,000
Public Welfare - Other: $414,000
Air Transportation: $240,000
General Public Buildings: $215,000
Natural Resources - Other: $201,000
Libraries: $196,000
Sewerage: $47,000
- Federal Intergovernmental - Housing and Community Development: $8,000
- General - Interest on Debt: $1,275,000
- Intergovernmental to Local - Other - Elementary and Secondary Education: $8,000
- Local Intergovernmental - Education: $76,000
Housing and Community Development: $53,000
- Long Term Debt - Beginning Outstanding - Unspecified Public Purpose: $31,875,000
Outstanding Unspecified Public Purpose: $30,203,000
Retired Unspecified Public Purpose: $1,673,000
- Miscellaneous - Sale of Property: $650,000
Special Assessments: $585,000
Donations From Private Sources: $414,000
Fines and Forfeits: $273,000
General Revenue - Other: $169,000
Interest Earnings: $101,000
Rents: $32,000
- Other Capital Outlay - Elementary and Secondary Education: $1,223,000
Judicial and Legal Services: $405,000
Local Fire Protection: $183,000
General Public Building: $69,000
Central Staff Services: $46,000
Solid Waste Management: $27,000
Financial Administration: $11,000
- Other Funds - Cash and Securities: $21,520,000
- Sinking Funds - Cash and Securities: $2,594,000
- State Intergovernmental - Education: $22,459,000
Highways: $4,158,000
Other: $1,265,000
Electric Utilities: $948,000
Housing and Community Development: $346,000
Health and Hospitals: $239,000
General Local Government Support: $160,000
Public Welfare: $36,000
- Tax - Property: $10,190,000
Motor Vehicle License: $2,907,000
Occupation and Business License - Other: $1,502,000
Other License: $779,000
General Sales and Gross Receipts: $617,000
Other Selective Sales: $364,000
Public Utility License: $204,000
Alcoholic Beverage Sales: $182,000
Alcoholic Beverage License: $1,000
- Total Salaries and Wages: $19,058,000
Supplemental Security Income (SSI) in 2006:
- Total number of recipients: 1,370
- Number of aged recipients: 186
- Number of blind and disabled recipients: 1,184
- Number of recipients under 18: 200
- Number of recipients between 18 and 64: 799
- Number of recipients older than 64: 371
- Number of recipients also receiving OASDI: 555
- Amount of payments (thousands of dollars): 572
| Most common first names in Fayette County, TN among deceased individuals | ||
| Name | Count | Lived (average) |
|---|---|---|
| James | 315 | 71.8 years |
| Mary | 298 | 79.8 years |
| John | 256 | 74.6 years |
| William | 246 | 74.8 years |
| Robert | 192 | 73.2 years |
| Willie | 177 | 75.3 years |
| George | 125 | 73.4 years |
| Charles | 106 | 70.6 years |
| Thomas | 81 | 72.1 years |
| Annie | 77 | 81.3 years |
| Most common last names in Fayette County, TN among deceased individuals | ||
| Last name | Count | Lived (average) |
|---|---|---|
| Jones | 175 | 73.1 years |
| Williams | 141 | 72.8 years |
| Smith | 130 | 74.5 years |
| Johnson | 106 | 72.3 years |
| Taylor | 87 | 77.3 years |
| Davis | 86 | 74.1 years |
| Brown | 76 | 75.5 years |
| Wilson | 72 | 75.1 years |
| Moore | 65 | 76.4 years |
| Harris | 61 | 76.5 years |
| Businesses in Fayette County, TN | ||||
| Name | Count | Name | Count | |
|---|---|---|---|---|
| AT&T | 2 | Maurices | 1 | |
| AutoZone | 2 | McDonald's | 1 | |
| Baskin-Robbins | 2 | RadioShack | 1 | |
| Curves | 1 | Rue21 | 1 | |
| Days Inn | 1 | SONIC Drive-In | 2 | |
| Domino's Pizza | 1 | Subway | 3 | |
| FedEx | 3 | Taco Bell | 1 | |
| H&R Block | 2 | U-Haul | 2 | |
| KFC | 1 | UPS | 1 | |
| Kroger | 1 | Walgreens | 1 | |
| Lane Furniture | 1 | Walmart | 1 | |
| MasterBrand Cabinets | 2 | |||