Hardeman County, Tennessee (TN)
County owner-occupied free and clear houses and condos in 2010: 2,906
County owner-occupied houses and condos in 2000: 6,978
Renter-occupied apartments: 2,567 (it was 2,434 in 2000)
| % of renters here: | 26% |
| State: | 32% |
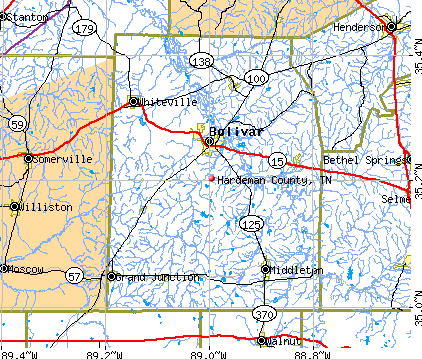
Land area: 668 sq. mi.
Water area: 2.8 sq. mi.
Population density: 39 people per square mile (low).
Industries providing employment: Manufacturing (27.3%), Educational, health and social services (22.8%), Retail trade (11.7%).
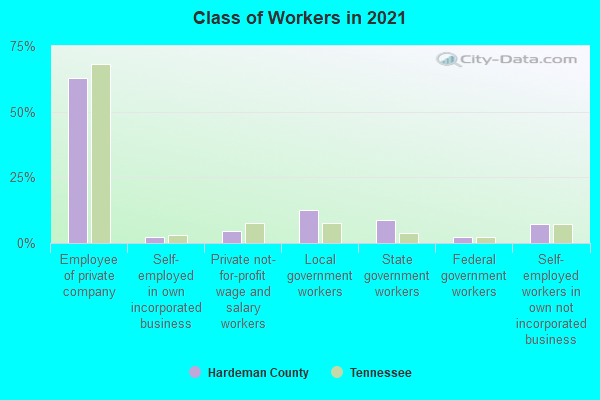
Type of workers:
- Private wage or salary: 74%
- Government: 20%
- Self-employed, not incorporated: 7%
- Unpaid family work: 0%
- OSM Map
- General Map
- Google Map
- MSN Map

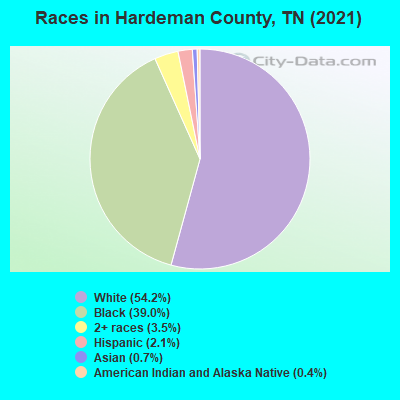
- 13,88954.0%White Non-Hispanic Alone
- 9,81638.2%Black Non-Hispanic Alone
- 1,2324.8%Two or more races
- 5432.1%Hispanic or Latino
- 1130.4%American Indian and Alaska Native alone
- 1020.4%Asian alone
- 240.09%Some other race alone
- 60.02%Native Hawaiian and Other
Pacific Islander alone
| Median resident age: | 41.0 years |
| Tennessee median age: | 39.2 years |
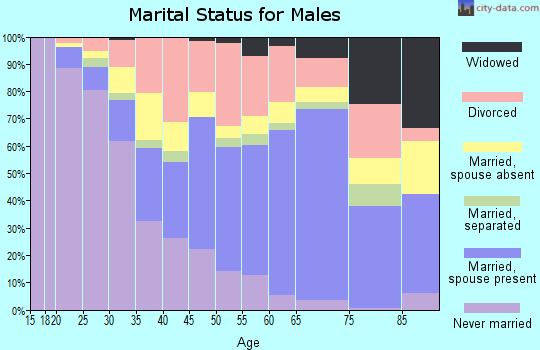
| Males: 14,398 | |
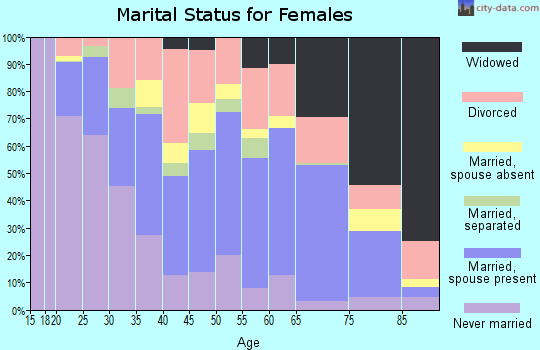
| Females: 11,591 |

 | COVID-19 in Tennessee (237 replies) |
| Searching for small town in TN to retire (19 replies) |
| Purchase land to hunt and live (15 replies) |
| 2019 TN Population Estimates (19 replies) |
| Tennessee Population Estimates 2016 (28 replies) |
| Thoughts on Jackson area? (18 replies) |
| Hardeman County: | 2.0 people |
| Tennessee: | 2 people |
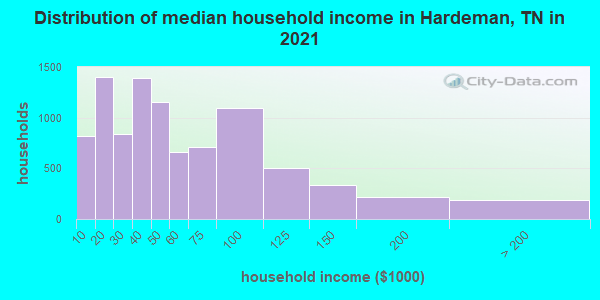
Estimated median household income in 2022: $44,395 ($29,111 in 1999)
| This county: | $44,395 |
| Tennessee: | $65,254 |
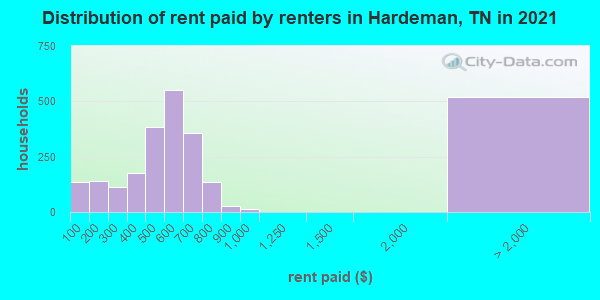
Median contract rent in 2022 for apartments: $554 (lower quartile is $433, upper quartile is $679)
| This county: | $554 |
| State: | $884 |
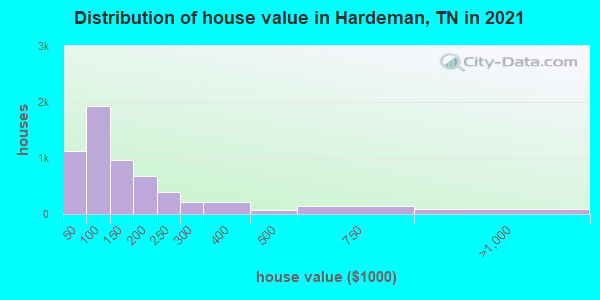
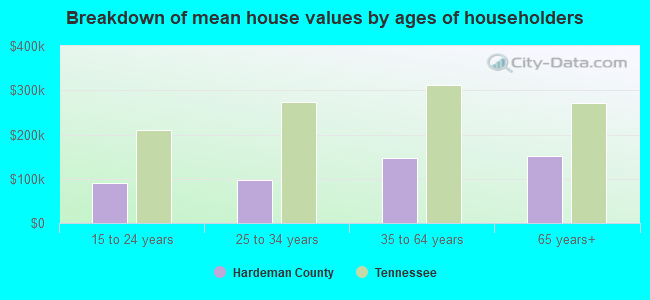
Estimated median house or condo value in 2022: $138,289 (it was $57,400 in 2000)
| Hardeman: | $138,289 |
| Tennessee: | $284,800 |
Median monthly housing costs for homes and condos with a mortgage: $1,021
Median monthly housing costs for units without a mortgage: $420
Institutionalized population: 3,764
Crime in 2021 (reported by the sheriff's office or county police, not the county total):
- Murders: 3
- Rapes: 3
- Robberies: 4
- Assaults: 115
- Burglaries: 35
- Thefts: 75
- Auto thefts: 38
Crime in 2020 (reported by the sheriff's office or county police, not the county total):
- Murders: 0
- Rapes: 9
- Robberies: 0
- Assaults: 78
- Burglaries: 55
- Thefts: 66
- Auto thefts: 19
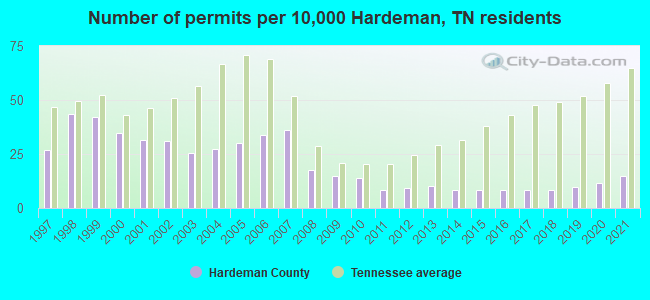
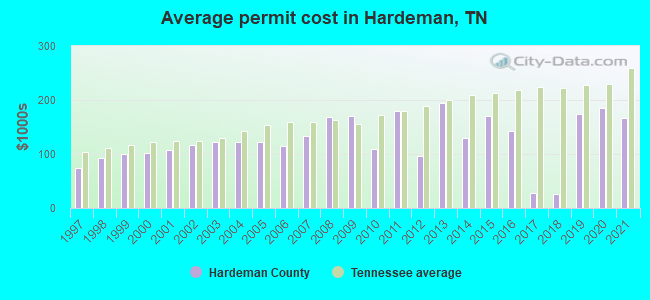
Single-family new house construction building permits:
- 2022: 51 buildings, average cost: $235,100
- 2021: 41 buildings, average cost: $166,800
- 2020: 32 buildings, average cost: $185,400
- 2019: 27 buildings, average cost: $174,700
- 2018: 24 buildings, average cost: $26,300
- 2017: 24 buildings, average cost: $26,500
- 2016: 24 buildings, average cost: $143,400
- 2015: 24 buildings, average cost: $169,600
- 2014: 23 buildings, average cost: $129,100
- 2013: 28 buildings, average cost: $194,500
- 2012: 26 buildings, average cost: $95,800
- 2011: 24 buildings, average cost: $179,400
- 2010: 39 buildings, average cost: $110,000
- 2009: 41 buildings, average cost: $170,800
- 2008: 50 buildings, average cost: $168,600
- 2007: 101 buildings, average cost: $133,700
- 2006: 95 buildings, average cost: $113,600
- 2005: 85 buildings, average cost: $121,800
- 2004: 77 buildings, average cost: $122,300
- 2003: 72 buildings, average cost: $121,800
- 2002: 87 buildings, average cost: $116,900
- 2001: 88 buildings, average cost: $107,600
- 2000: 97 buildings, average cost: $101,300
- 1999: 119 buildings, average cost: $100,400
- 1998: 122 buildings, average cost: $92,100
- 1997: 76 buildings, average cost: $74,700
Median real estate property taxes paid for housing units with mortgages in 2022: $842 (0.6%)
Median real estate property taxes paid for housing units with no mortgage in 2022: $746 (0.6%)
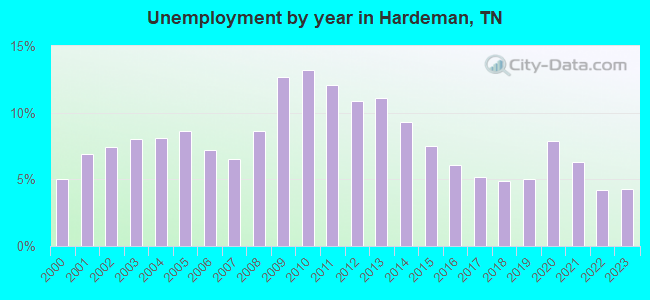
| Hardeman County: | 15.3% |
| Tennessee: | 13.3% |
Median age of residents in 2022: 41.0 years old
(Males: 39.2 years old, Females: 44.2 years old)
(Median age for: White residents: 46.0 years old, Black residents: 35.5 years old, American Indian residents: 27.3 years old, Asian residents: 39.6 years old, Hispanic or Latino residents: 37.0 years old, Other race residents: 27.4 years old)
Fair market rent in 2006 for a 1-bedroom apartment in Hardeman County is $412 a month.
Fair market rent for a 2-bedroom apartment is $460 a month.
Fair market rent for a 3-bedroom apartment is $623 a month.
Cities in this county include: Bolivar, Whiteville, Middleton, Toone, Hornsby, Grand Junction, Hickory Valley, Saulsbury, Silerton.
Neighboring counties: Bledsoe County  , Beaufort County, North Carolina , Dare County, North Carolina , Giles County , Santa Barbara County, California
  , Marion County .
| Here: | 4.6% |
| Tennessee: | 3.0% |
Current college students: 607
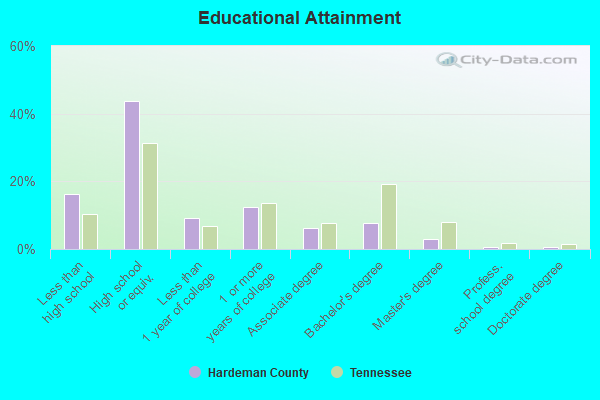
People 25 years of age or older with a high school degree or higher: 80.9%
People 25 years of age or older with a bachelor's degree or higher: 10.5%
Number of foreign born residents: 302 (47.5% naturalized citizens)
| Hardeman County: | 1.2% |
| Whole state: | 5.6% |
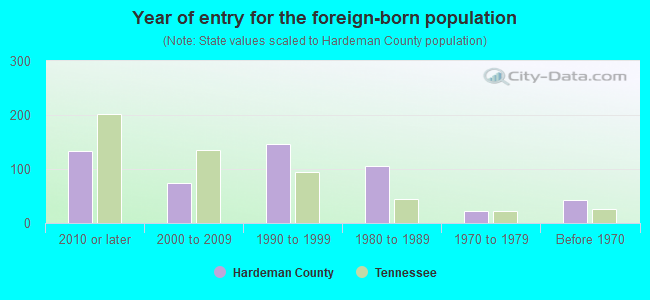
- Year of entry for the foreign-born population
- 1252010 or later
- 532000 to 2009
- 1191990 to 1999
- 1061980 to 1989
- 221970 to 1979
- 42Before 1970
Mean travel time to work (commute): minutes
Percentage of county residents living and working in this county: 93.1%
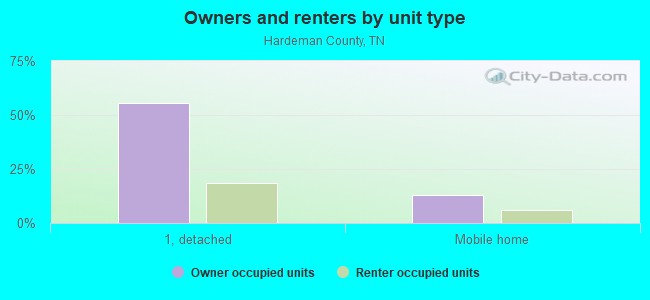
Housing units in structures:
- One, detached: 8,172
- One, attached: 80
- Two: 159
- 3 or 4: 109
- 5 to 9: 38
- 10 to 19: 3
- 20 to 49: 30
- 50 or more: 22
- Mobile homes: 2,311
Housing units in Hardeman County with a mortgage: 3,202 (168 second mortgage, 0 home equity loan, 136 both second mortgage and home equity loan)
Houses without a mortgage: 68
| Here: | 4.2% with mortgage |
| State: | 97.8% with mortgage |
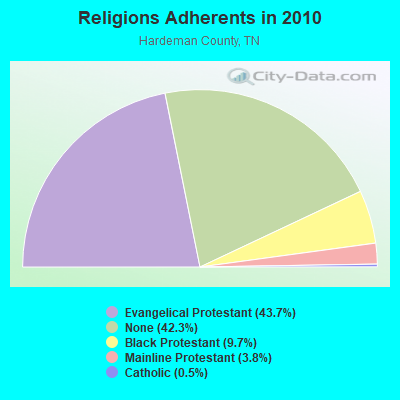
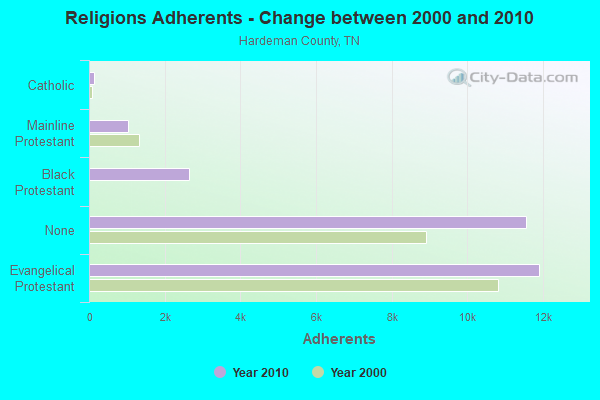
Religion statistics for Hardeman County
| Religion | Adherents | Congregations |
|---|---|---|
| Evangelical Protestant | 11,904 | 60 |
| Black Protestant | 2,650 | 16 |
| Mainline Protestant | 1,031 | 11 |
| Catholic | 125 | 1 |
| Other | 2 | 1 |
| None | 11,541 | - |
Source: Clifford Grammich, Kirk Hadaway, Richard Houseal, Dale E.Jones, Alexei Krindatch, Richie Stanley and Richard H.Taylor. 2012. 2010 U.S.Religion Census: Religious Congregations & Membership Study. Association of Statisticians of American Religious Bodies. Jones, Dale E., et al. 2002. Congregations and Membership in the United States 2000. Nashville, TN: Glenmary Research Center.
Food Environment Statistics:
| Hardeman County: | 3.59 / 10,000 pop. |
| State: | 1.99 / 10,000 pop. |
| Here: | 0.36 / 10,000 pop. |
| Tennessee: | 0.17 / 10,000 pop. |
| This county: | 0.72 / 10,000 pop. |
| Tennessee: | 0.65 / 10,000 pop. |
| Hardeman County: | 5.75 / 10,000 pop. |
| Tennessee: | 5.16 / 10,000 pop. |
| This county: | 4.31 / 10,000 pop. |
| State: | 6.56 / 10,000 pop. |
| Hardeman County: | 13.4% |
| Tennessee: | 11.4% |
| Hardeman County: | 37.5% |
| State: | 30.2% |
| Here: | 11.2% |
| State: | 13.5% |
Agriculture in Hardeman County:
Average size of farms: 255 acresAverage value of agricultural products sold per farm: $21,249
Average value of crops sold per acre for harvested cropland: $210.47
The value of nursery, greenhouse, floriculture, and sod as a percentage of the total market value of agricultural products sold: 7.87%
The value of livestock, poultry, and their products as a percentage of the total market value of agricultural products sold: 22.96%
Average total farm production expenses per farm: $23,315
Harvested cropland as a percentage of land in farms: 30.45%
Irrigated harvested cropland as a percentage of land in farms: 0.51%
Average market value of all machinery and equipment per farm: $75,715
The percentage of farms operated by a family or individual: 94.35%
Average age of principal farm operators: 58 years
Average number of cattle and calves per 100 acres of all land in farms: 8.81
Milk cows as a percentage of all cattle and calves: 0.04%
Corn for grain: 6244 harvested acres
All wheat for grain: 1918 harvested acres
Upland cotton: 12617 harvested acres
Soybeans for beans: 8909 harvested acres
Vegetables: 463 harvested acres
Earthquake activity:
Hardeman County-area historical earthquake activity is significantly above Tennessee state average. It is 320% greater than the overall U.S. average.On 3/25/1976 at 00:41:20, a magnitude 5.0 (4.9 MB, 5.0 LG, Class: Moderate, Intensity: VI - VII) earthquake occurred 80.8 miles away from Hardeman County center
On 5/4/1991 at 01:18:54, a magnitude 5.0 (4.4 MB, 4.6 LG, 5.0 LG, Depth: 3.1 mi) earthquake occurred 104.9 miles away from the county center
On 4/27/1989 at 16:47:49, a magnitude 4.7 (4.6 MB, 4.7 LG, 4.3 LG, Class: Light, Intensity: IV - V) earthquake occurred 70.5 miles away from the county center
On 9/26/1990 at 13:18:51, a magnitude 5.0 (4.7 MB, 4.8 LG, 5.0 LG, Depth: 7.7 mi) earthquake occurred 139.1 miles away from the county center
On 4/18/2008 at 09:36:59, a magnitude 5.4 (5.1 MB, 4.8 MS, 5.4 MW, 5.2 MW) earthquake occurred 233.0 miles away from Hardeman County center
On 3/25/1976 at 01:00:11, a magnitude 4.5 (4.1 MB, 4.5 LG) earthquake occurred 88.2 miles away from the county center
Magnitude types: regional Lg-wave magnitude (LG), body-wave magnitude (MB), surface-wave magnitude (MS), moment magnitude (MW)
Most recent natural disasters:
- Tennessee Covid-19 Pandemic, Incident Period: January 20, 2020, FEMA Id: 4514, Natural disaster type: Other
- Tennessee Severe Winter Storm and Flooding, Incident Period: February 15, 2015 to February 23, 2015, Major Disaster (Presidential) Declared DR-4211: April 02, 2015, FEMA Id: 4211, Natural disaster type: Winter Storm, Flood
- Tennessee Severe Storms, Tornadoes, Straight-line Winds, and Associated Flooding, Incident Period: April 25, 2011 to April 28, 2011, Major Disaster (Presidential) Declared DR-1974: May 01, 2011, FEMA Id: 1974, Natural disaster type: Storm, Tornado, Flood, Wind
- Tennessee Severe Storms, Flooding, Straight-Line Winds, and Tornadoes, Incident Period: April 30, 2010 to May 18, 2010, Major Disaster (Presidential) Declared DR-1909: May 04, 2010, FEMA Id: 1909, Natural disaster type: Storm, Tornado, Flood, Wind
- Tennessee Hurricane Katrina Evacuation, Incident Period: August 29, 2005 to October 01, 2005, Emergency Declared EM-3217: September 05, 2005, FEMA Id: 3217, Natural disaster type: Hurricane
- Tennessee Severe Storms, Tornadoes and Flooding, Incident Period: May 04, 2003 to May 30, 2003, Major Disaster (Presidential) Declared DR-1464: May 08, 2003, FEMA Id: 1464, Natural disaster type: Storm, Tornado, Flood
- Tennessee Severe Storms, Tornadoes and Flooding, Incident Period: May 05, 1999 to May 19, 1999, Major Disaster (Presidential) Declared DR-1275: May 12, 1999, FEMA Id: 1275, Natural disaster type: Storm, Tornado, Flood
- Tennessee Severe Storms, Tornadoes, and High Winds, Incident Period: January 17, 1999 to February 01, 1999, Major Disaster (Presidential) Declared DR-1262: January 19, 1999, FEMA Id: 1262, Natural disaster type: Storm, Tornado, Wind
- Tennessee Severe Storms/Flooding, Incident Period: February 28, 1997 to March 24, 1997, Major Disaster (Presidential) Declared DR-1167: March 07, 1997, FEMA Id: 1167, Natural disaster type: Storm, Flood
- Tennessee Ice Storm, Severe Winter Storm, Flash Flooding, Incident Period: February 09, 1994 to February 11, 1994, Major Disaster (Presidential) Declared DR-1010: February 28, 1994, FEMA Id: 1010, Natural disaster type: Ice Storm, Winter Storm, Flash Flood
- 1 other natural disasters have been reported since 1953.
The number of natural disasters in Hardeman County (11) is smaller than the US average (15).
Major Disasters (Presidential) Declared: 9
Emergencies Declared: 1
Causes of natural disasters: Floods: 7, Storms: 7, Tornadoes: 5, Winds: 3, Winter Storms: 2, Flash Flood: 1, Hurricane: 1, Ice Storm: 1, Other: 1 (Note: some incidents may be assigned to more than one category).
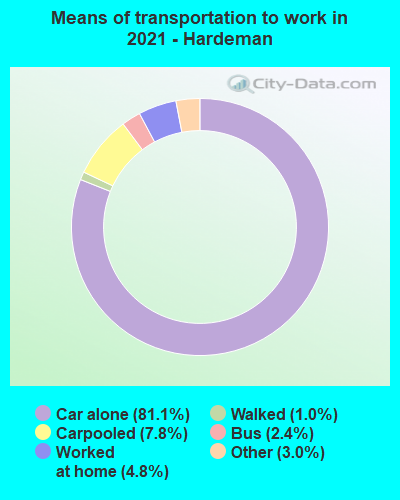
Means of transportation to work:
- Drove a car alone: 6,306 (75.0%)
- Carpooled: 723 (8.6%)
- Bus: 115 (1.4%)
- Taxicab, motorcycle, or other means: 354 (4.2%)
- Walked: 86 (1.0%)
- Worked at home: 750 (8.9%)
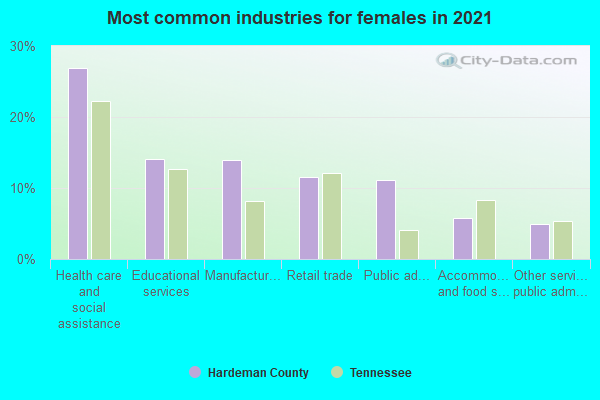
- Health care and social assistance (26%)
- Manufacturing (15%)
- Retail trade (11%)
- Educational services (10%)
- Public administration (9%)
- Accommodation and food services (5%)
- Transportation and warehousing (5%)
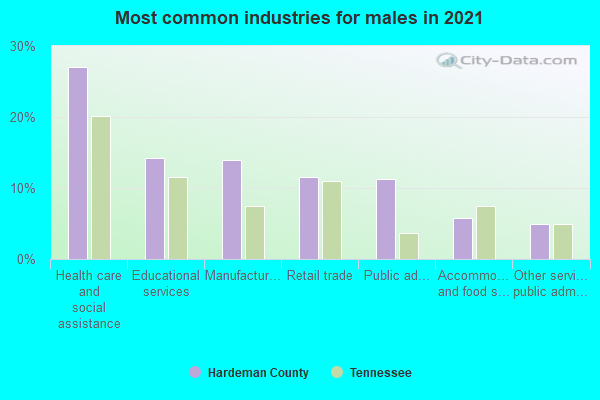
- Health care and social assistance (27%)
- Manufacturing (15%)
- Retail trade (11%)
- Educational services (10%)
- Public administration (10%)
- Accommodation and food services (5%)
- Transportation and warehousing (5%)
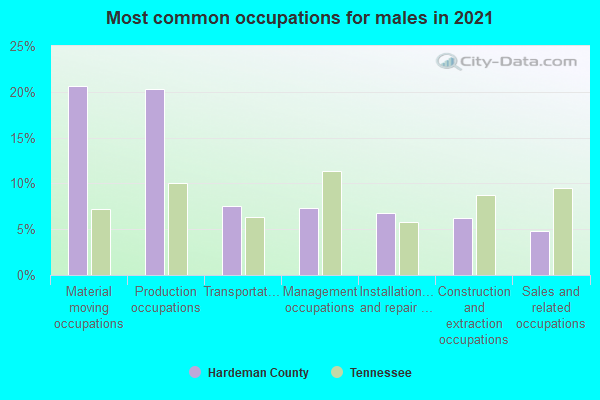
- Production occupations (22%)
- Material moving occupations (21%)
- Transportation occupations (8%)
- Management occupations (7%)
- Sales and related occupations (6%)
- Installation, maintenance, and repair occupations (5%)
- Health technologists and technicians (5%)
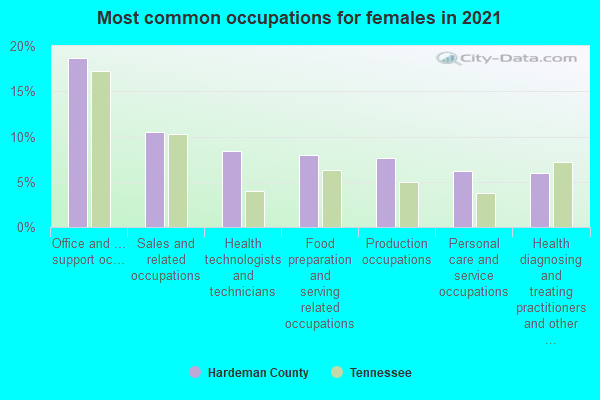
- Office and administrative support occupations (21%)
- Production occupations (11%)
- Sales and related occupations (10%)
- Health technologists and technicians (8%)
- Food preparation and serving related occupations (8%)
- Health diagnosing and treating practitioners and other technical occupations (5%)
- Personal care and service occupations (5%)
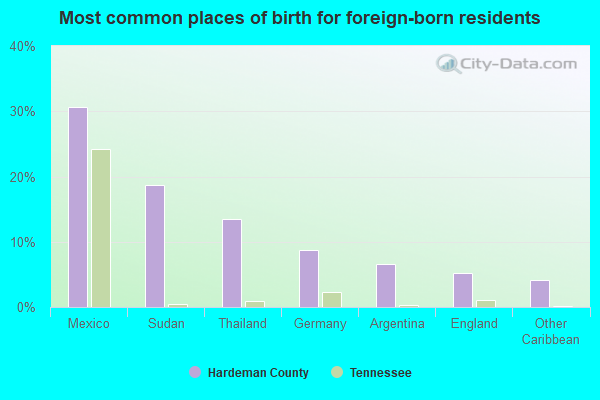
- Mexico (22%)
- Thailand (21%)
- Germany (7%)
- Sudan (6%)
- England (6%)
- Bosnia and Herzegovina (5%)
- Argentina (5%)
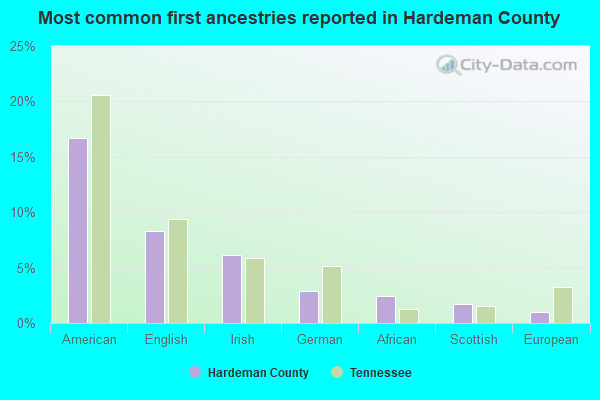
- American (15%)
- English (9%)
- Irish (6%)
- German (3%)
- Scottish (1%)
- European (1%)
- Scotch-Irish (1%)
People in group quarters in Hardeman County, Tennessee in 2010:
- 3,456 people in state prisons
- 190 people in nursing facilities/skilled-nursing facilities
- 118 people in mental (psychiatric) hospitals and psychiatric units in other hospitals
- 52 people in group homes intended for adults
- 9 people in residential treatment centers for adults
People in group quarters in Hardeman County, Tennessee in 2000:
- 2,045 people in local jails and other confinement facilities (including police lockups)
- 1,393 people in state prisons
- 211 people in mental (psychiatric) hospitals or wards
- 203 people in nursing homes
- 49 people in homes for the mentally ill
- 38 people in homes for the mentally retarded
- 16 people in other noninstitutional group quarters
- 9 people in hospitals/wards and hospices for chronically ill
- 9 people in other hospitals or wards for chronically ill
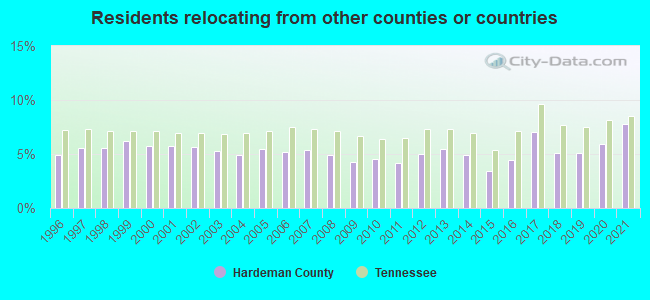
7.80% of this county's 2021 resident taxpayers lived in other counties in 2020 ($32,938 average adjusted gross income)
| Here: | 7.80% |
| Tennessee average: | 8.49% |
10 or fewer of this county's residents moved from foreign countries.
5.50% relocated from other counties in Tennessee ($18,644 average AGI)
2.30% relocated from other states ($14,293 average AGI)
Hardeman County: 2.30% Tennessee average: 4.34%
Top counties from which taxpayers relocated into this county between 2020 and 2021:
| from Shelby County, TN | |
| from Fayette County, TN | |
| from Madison County, TN | |
| from Davidson County, TN | |
| from Rutherford County, TN |
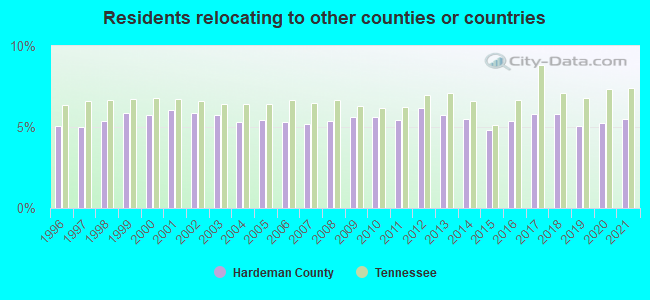
5.49% of this county's 2020 resident taxpayers moved to other counties in 2021 ($34,744 average adjusted gross income)
| Here: | 5.49% |
| Tennessee average: | 7.40% |
10 or fewer of this county's residents moved to foreign countries.
4.10% relocated to other counties in Tennessee ($25,780 average AGI)
1.39% relocated to other states ($8,965 average AGI)
Hardeman County: 1.39% Tennessee average: 3.20%
Top counties to which taxpayers relocated from this county between 2020 and 2021:
| to Madison County, TN | |
| to Shelby County, TN | |
| to Fayette County, TN | |
| to McNairy County, TN |
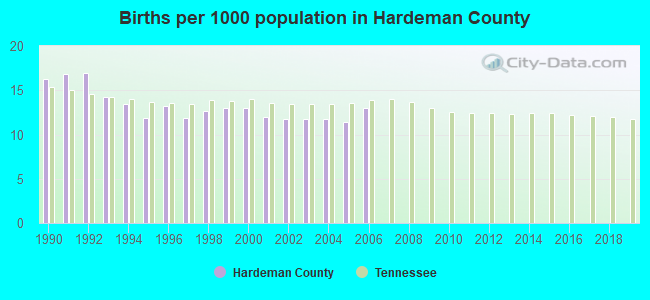
Births per 1000 population from 1990 to 1999: 14.0
Births per 1000 population from 2000 to 2006: 12.1
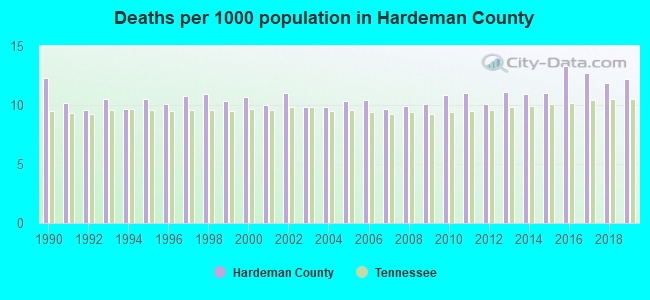
Deaths per 1000 population from 1990 to 1999: 10.5
Deaths per 1000 population from 2000 to 2009: 10.2
Deaths per 1000 population from 2010 to 2020: 11.9
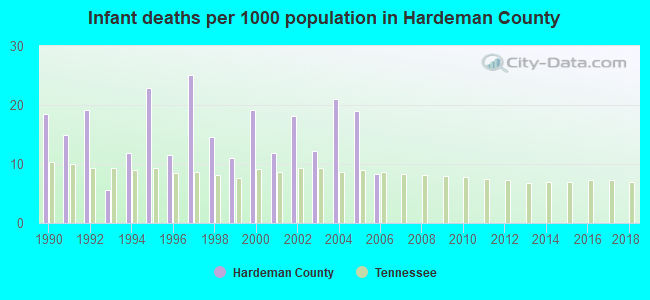
Infant deaths per 1000 live births from 1990 to 1999: 15.5
Infant deaths per 1000 live births from 2000 to 2006: 15.7
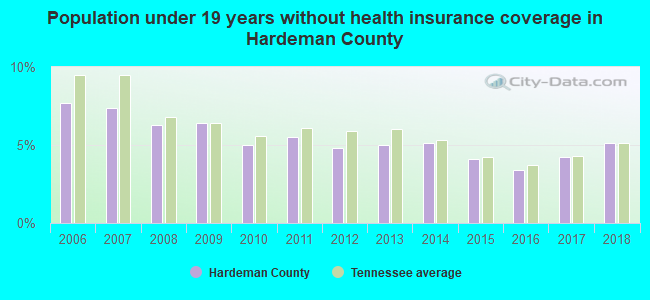
Persons under 19 years old without health insurance coverage in 2018: 5.1%
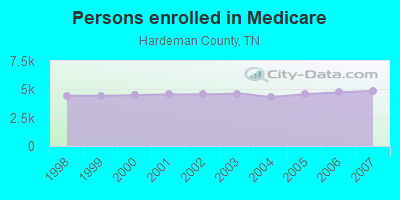
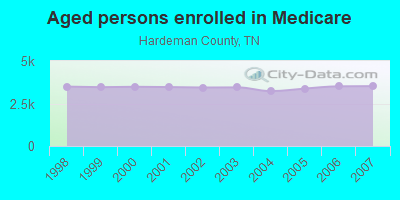
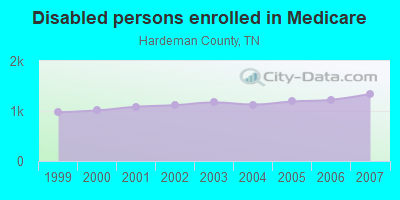
Persons enrolled in hospital insurance and/or supplemental medical insurance (Medicare) in July 1, 2007: 4,862 (3,520 aged, 1,342 disabled)
Children under 18 without health insurance coverage in 2007: 530 (9%)
Most common underlying causes of death in Hardeman County, Tennessee in 1999 - 2019:
- Acute myocardial infarction, unspecified (567)
- Atherosclerotic heart disease (467)
- Bronchus or lung, unspecified - Malignant neoplasms (435)
- Chronic obstructive pulmonary disease, unspecified (215)
- Stroke, not specified as haemorrhage or infarction (79)
- Alzheimer disease, unspecified (50)
- Pneumonia, unspecified (35)
- Essential (primary) hypertension (20)
- Cardiac arrest, unspecified (16)
- Unspecified dementia (14)
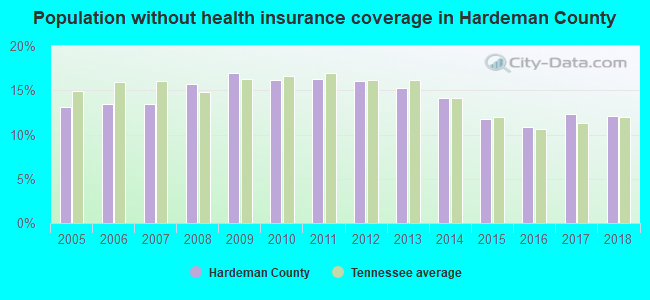
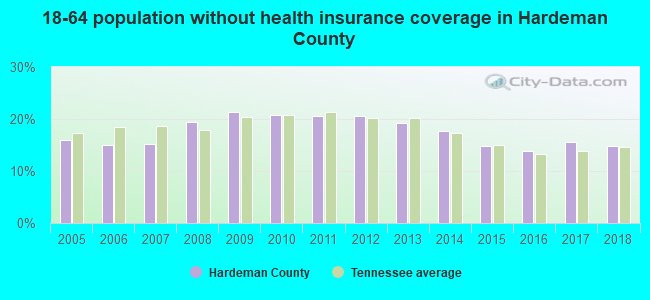
Population without health insurance coverage in 2000: 16%
Children under 18 without health insurance coverage in 2000: 10%
Short term general hospital admissions per 100,000 population in 2004: 3,451
Short term general hospital beds per 100,000 population in 2004: 131
Emergency room visits per 100,000 population in 2004: 38,993
General practice office based MDs per 100,000 population in 2005: 1,175
Medical specialist MDs per 100,000 population in 2005: 1,033
Dentists per 100,000 population in 1998: 4
Total births per 100,000 population, July 2005 - July 2006 : 24
Total deaths per 100,000 population, July 2005 - July 2006: 43
Limited-service eating places per 100,000 population in 2005 : 4
EPA green book nonattainment status in 2004-2006: 1
Crimes per 100,000 population in 1996: 1
Suicides per 1,000,000 population from 2000 to 2006: 158.5. This is more than state average.
Household type by relationship:
Households: 25,989- Male householders: 4,185 (1,571 living alone), Female householders: 5,270 (1,824 living alone)
3,818 spouses (3,784 opposite-sex spouses), 356 unmarried partners, (341 opposite-sex unmarried partners), 6,797 children (6,354 natural, 118 adopted, 322 stepchildren), 944 grandchildren, 254 brothers or sisters, 176 parents, 72 foster children, 291 other relatives, 172 non-relatives
- In group quarters: 3,518
Size of family households: 3,176 2-persons, 1,058 3-persons, 990 4-persons, 446 5-persons, 65 6-persons, 84 7-or-more-persons.
Size of nonfamily households: 3,396 1-person, 175 2-persons, 11 3-persons, 15 4-persons.
2,144 married couples with children.
1,880 single-parent households (464 men, 1,416 women).
97.3% of residents of Hardeman speak English at home.
1.4% of residents speak Spanish at home (63% speak English very well, 14% speak English well, 23% speak English not well).
0.5% of residents speak other Indo-European language at home (100% speak English very well).
0.4% of residents speak Asian or Pacific Island language at home (100% speak English very well).
0.2% of residents speak other language at home (86% speak English very well, 14% speak English well).
In fiscal year 2004:
Federal Government expenditure: $211,347,000 ($7,504 per capita)
Department of Defense expenditure: $20,968,000
Federal direct payments to individuals for retirement and disability: $69,625,000
Federal other direct payments to individuals: $43,741,000
Federal direct payments not to individuals: $3,338,000
Federal grants: $72,800,000
Federal procurement contracts: $16,218,000 ($15,237,000 Department of Defense)
Federal salaries and wages: $5,626,000 ($2,070,000 Department of Defense)
Federal Government direct loans: $570,000
Federal guaranteed/insured loans: $4,257,000
Federal Government insurance: $5,438,000
Population change from April 1, 2000 to July 1, 2005:
Births: 1,806| Here: | 64 per 1000 residents |
| State: | 69 per 1000 residents |
Deaths: 1,523
| Here: | 54 per 1000 residents |
| State: | 50 per 1000 residents |
Net international migration: +24
| Here: | +1 per 1000 residents |
| State: | +8 per 1000 residents |
Net internal migration: -209
| Here: | |
| State: |
Total withdrawal of fresh water for public supply: 2.65 millions of gallons per day (all from ground)
| Here: | 6.5 |
| State: | 6.5 |
| Here: | 5.0 |
| State: | 4.4 |
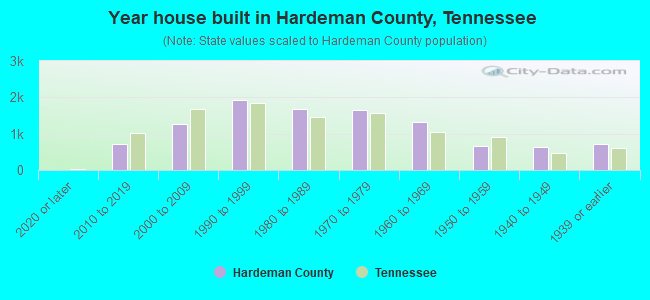
- Year house built in Hardeman County, Tennessee
- 102020 or later
- 7582010 to 2019
- 1,1502000 to 2009
- 1,8161990 to 1999
- 1,8611980 to 1989
- 1,5761970 to 1979
- 1,3301960 to 1969
- 8031950 to 1959
- 5831940 to 1949
- 7311939 or earlier
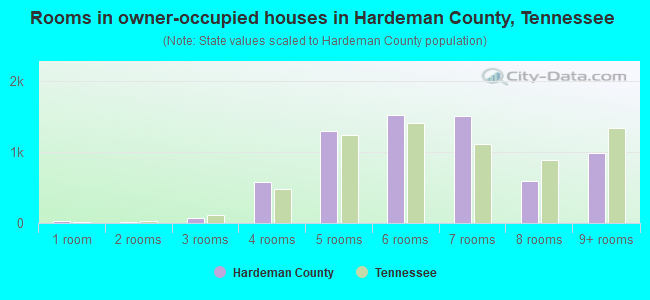
- Rooms in owner-occupied houses in Hardeman County, Tennessee
- 171 room
- 202 rooms
- 993 rooms
- 6444 rooms
- 1,0465 rooms
- 1,5516 rooms
- 1,4857 rooms
- 7208 rooms
- 1,1089+ rooms
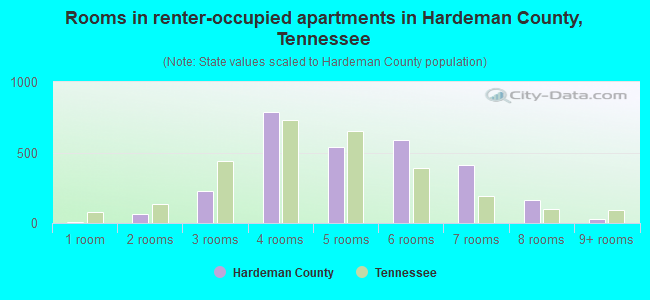
- Rooms in renter-occupied apartments in Hardeman County, Tennessee
- 01 room
- 142 rooms
- 2873 rooms
- 8144 rooms
- 4155 rooms
- 5336 rooms
- 4637 rooms
- 2078 rooms
- 329+ rooms
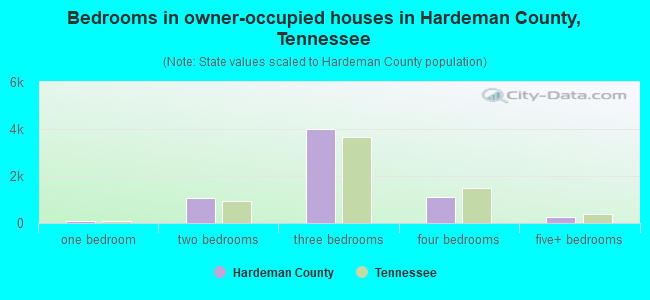
- Bedrooms in owner-occupied houses in Hardeman County, Tennessee
- 20no bedroom
- 1451 bedroom
- 9422 bedrooms
- 4,0983 bedrooms
- 1,1954 bedrooms
- 2785+ bedrooms
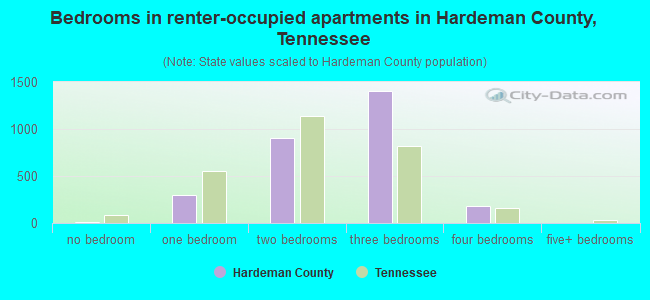
- Bedrooms in renter-occupied apartments in Hardeman County, Tennessee
- 0no bedroom
- 2101 bedroom
- 1,0282 bedrooms
- 1,2583 bedrooms
- 2314 bedrooms
- 35+ bedrooms
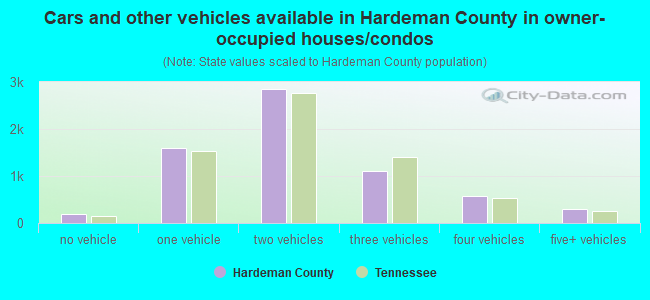
- Cars and other vehicles available in Hardeman County in owner-occupied houses/condos
- 269no vehicle
- 1,4581 vehicle
- 2,8322 vehicles
- 1,2223 vehicles
- 6294 vehicles
- 2855+ vehicles
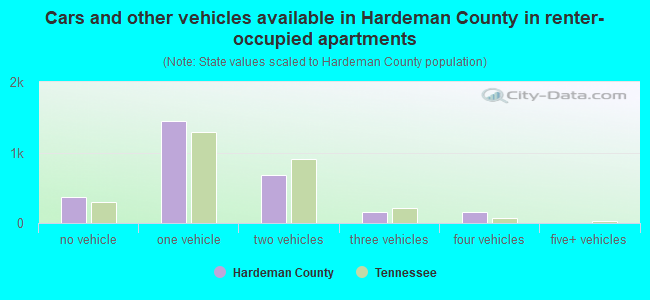
- Cars and other vehicles available in Hardeman County in renter-occupied apartments
- 368no vehicle
- 1,4001 vehicle
- 6562 vehicles
- 2123 vehicles
- 1074 vehicles
- 205+ vehicles
88.3% of Hardeman County residents lived in the same house 1 years ago.
Out of people who lived in different houses, 29% lived in this county.
Out of people who lived in different counties, 89% lived in Tennessee.
| Hardeman County: | 88.3% |
| State average: | 87.0% |
Place of birth for U.S.-born residents:
- This state: 19,797
- Other state: 5,594
- Northeast: 372
- Midwest: 1,416
- South: 3,304
- West: 472
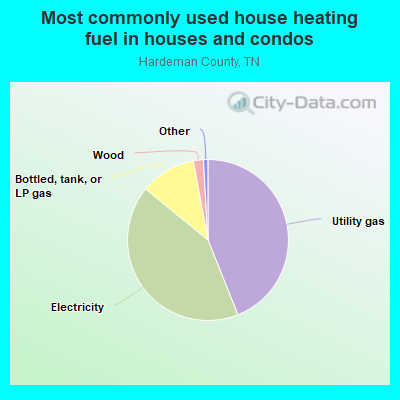
- 44.4%Utility gas
- 42.6%Electricity
- 10.2%Bottled, tank, or LP gas
- 2.1%Wood
- 0.7%Other fuel
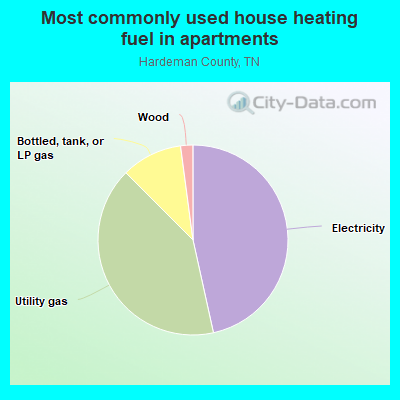
- 44.5%Electricity
- 43.2%Utility gas
- 9.8%Bottled, tank, or LP gas
- 2.5%Wood
Private vs. public school enrollment:
| Here: | 12.2% |
| Tennessee: | 15.0% |
| Here: | 17.3% |
| Tennessee: | 16.2% |
| Here: | 15.7% |
| Tennessee: | 23.5% |
Hardeman County government finances - Expenditure in 2020:
- Bond Funds - Cash and Securities: $881,000
- Charges - Other: $2,700,000
Other: $1,878,000
Solid Waste Management: $1,537,000
Elementary and Secondary Education - Other: $1,412,000
Elementary and Secondary Education - Other: $1,179,000
Solid Waste Management: $985,000
Elementary and Secondary Education School Lunch: $204,000
Elementary and Secondary Education School Lunch: $150,000
Air Transportation: $24,000
Air Transportation: $22,000
- Construction - Elementary and Secondary Education: $721,000
Regular Highways: $452,000
Elementary and Secondary Education: $31,000
- Current Operations - Elementary and Secondary Education: $35,703,000
Elementary and Secondary Education: $35,138,000
General - Other: $5,254,000
Regular Highways: $3,088,000
Regular Highways: $2,984,000
General - Other: $2,849,000
Health - Other: $1,874,000
Health - Other: $1,707,000
Police Protection: $1,682,000
Solid Waste Management: $1,549,000
Police Protection: $1,528,000
Correctional Institutions: $1,291,000
Correctional Institutions: $1,260,000
Solid Waste Management: $1,183,000
Judicial and Legal Services: $820,000
General Public Buildings: $816,000
Central Staff Services: $770,000
Judicial and Legal Services: $765,000
Central Staff Services: $626,000
General Public Buildings: $435,000
Financial Administration: $426,000
Financial Administration: $268,000
Air Transportation: $151,000
Natural Resources - Other: $122,000
Air Transportation: $106,000
Local Fire Protection: $106,000
Local Fire Protection: $100,000
Libraries: $100,000
Natural Resources - Other: $95,000
Libraries: $83,000
- Federal Intergovernmental - Other: $369,000
Highways: $114,000
Other: $8,000
- General - Interest on Debt: $600,000
Interest on Debt: $186,000
- Local Intergovernmental - General Local Government Support: $656,000
Other: $363,000
Education: $8,000
Education: $7,000
- Long Term Debt - Outstanding Unspecified Public Purpose: $24,104,000
Beginning Outstanding - Unspecified Public Purpose: $21,862,000
Outstanding Unspecified Public Purpose: $20,770,000
Issue, Unspecified Public Purpose: $17,860,000
Beginning Outstanding - Unspecified Public Purpose: $7,093,000
Retired Unspecified Public Purpose: $1,092,000
Retired Unspecified Public Purpose: $849,000
- Miscellaneous - Donations From Private Sources: $905,000
General Revenue - Other: $511,000
Fines and Forfeits: $340,000
General Revenue - Other: $284,000
Fines and Forfeits: $269,000
Interest Earnings: $231,000
Interest Earnings: $118,000
Sale of Property: $70,000
Rents: $12,000
Sale of Property: $4,000
Rents: $3,000
Donations From Private Sources: $1,000
- Other Capital Outlay - General - Other: $17,453,000
Elementary and Secondary Education: $1,492,000
Elementary and Secondary Education: $878,000
Regular Highways: $450,000
Solid Waste Management: $120,000
Solid Waste Management: $95,000
- Other Funds - Cash and Securities: $10,949,000
Cash and Securities: $8,272,000
- Sinking Funds - Cash and Securities: $680,000
Cash and Securities: $87,000
- State Intergovernmental - Education: $28,550,000
Education: $27,624,000
General Local Government Support: $6,248,000
Highways: $2,777,000
Other: $1,257,000
General Local Government Support: $1,065,000
Other: $1,037,000
Health and Hospitals: $225,000
Health and Hospitals: $118,000
- Tax - Property: $8,331,000
Property: $8,119,000
Motor Vehicle License: $1,564,000
Motor Vehicle License: $1,532,000
General Sales and Gross Receipts: $403,000
Other Selective Sales: $281,000
Other Selective Sales: $181,000
General Sales and Gross Receipts: $145,000
Alcoholic Beverage Sales: $104,000
Alcoholic Beverage Sales: $70,000
Other License: $35,000
Other License: $23,000
Public Utilities Sales: $8,000
Occupation and Business License - Other: $2,000
- Total Salaries and Wages: $21,880,000
: $21,621,000
Hardeman County government finances - Revenue in 2020:
- Bond Funds - Cash and Securities: $881,000
- Charges - Other: $2,700,000
Other: $1,878,000
Solid Waste Management: $1,537,000
Elementary and Secondary Education - Other: $1,412,000
Elementary and Secondary Education - Other: $1,179,000
Solid Waste Management: $985,000
Elementary and Secondary Education School Lunch: $204,000
Elementary and Secondary Education School Lunch: $150,000
Air Transportation: $24,000
Air Transportation: $22,000
- Construction - Elementary and Secondary Education: $721,000
Regular Highways: $452,000
Elementary and Secondary Education: $31,000
- Current Operations - Elementary and Secondary Education: $35,703,000
Elementary and Secondary Education: $35,138,000
General - Other: $5,254,000
Regular Highways: $3,088,000
Regular Highways: $2,984,000
General - Other: $2,849,000
Health - Other: $1,874,000
Health - Other: $1,707,000
Police Protection: $1,682,000
Solid Waste Management: $1,549,000
Police Protection: $1,528,000
Correctional Institutions: $1,291,000
Correctional Institutions: $1,260,000
Solid Waste Management: $1,183,000
Judicial and Legal Services: $820,000
General Public Buildings: $816,000
Central Staff Services: $770,000
Judicial and Legal Services: $765,000
Central Staff Services: $626,000
General Public Buildings: $435,000
Financial Administration: $426,000
Financial Administration: $268,000
Air Transportation: $151,000
Natural Resources - Other: $122,000
Air Transportation: $106,000
Local Fire Protection: $106,000
Local Fire Protection: $100,000
Libraries: $100,000
Natural Resources - Other: $95,000
Libraries: $83,000
- Federal Intergovernmental - Other: $369,000
Highways: $114,000
Other: $8,000
- General - Interest on Debt: $600,000
Interest on Debt: $186,000
- Local Intergovernmental - General Local Government Support: $656,000
Other: $363,000
Education: $8,000
Education: $7,000
- Long Term Debt - Outstanding Unspecified Public Purpose: $24,104,000
Beginning Outstanding - Unspecified Public Purpose: $21,862,000
Outstanding Unspecified Public Purpose: $20,770,000
Issue, Unspecified Public Purpose: $17,860,000
Beginning Outstanding - Unspecified Public Purpose: $7,093,000
Retired Unspecified Public Purpose: $1,092,000
Retired Unspecified Public Purpose: $849,000
- Miscellaneous - Donations From Private Sources: $905,000
General Revenue - Other: $511,000
Fines and Forfeits: $340,000
General Revenue - Other: $284,000
Fines and Forfeits: $269,000
Interest Earnings: $231,000
Interest Earnings: $118,000
Sale of Property: $70,000
Rents: $12,000
Sale of Property: $4,000
Rents: $3,000
Donations From Private Sources: $1,000
- Other Capital Outlay - General - Other: $17,453,000
Elementary and Secondary Education: $1,492,000
Elementary and Secondary Education: $878,000
Regular Highways: $450,000
Solid Waste Management: $120,000
Solid Waste Management: $95,000
- Other Funds - Cash and Securities: $10,949,000
Cash and Securities: $8,272,000
- Sinking Funds - Cash and Securities: $680,000
Cash and Securities: $87,000
- State Intergovernmental - Education: $28,550,000
Education: $27,624,000
General Local Government Support: $6,248,000
Highways: $2,777,000
Other: $1,257,000
General Local Government Support: $1,065,000
Other: $1,037,000
Health and Hospitals: $225,000
Health and Hospitals: $118,000
- Tax - Property: $8,331,000
Property: $8,119,000
Motor Vehicle License: $1,564,000
Motor Vehicle License: $1,532,000
General Sales and Gross Receipts: $403,000
Other Selective Sales: $281,000
Other Selective Sales: $181,000
General Sales and Gross Receipts: $145,000
Alcoholic Beverage Sales: $104,000
Alcoholic Beverage Sales: $70,000
Other License: $35,000
Other License: $23,000
Public Utilities Sales: $8,000
Occupation and Business License - Other: $2,000
- Total Salaries and Wages: $21,880,000
: $21,621,000
Hardeman County government finances - Debt in 2020:
- Bond Funds - Cash and Securities: $881,000
- Charges - Other: $2,700,000
Other: $1,878,000
Solid Waste Management: $1,537,000
Elementary and Secondary Education - Other: $1,412,000
Elementary and Secondary Education - Other: $1,179,000
Solid Waste Management: $985,000
Elementary and Secondary Education School Lunch: $204,000
Elementary and Secondary Education School Lunch: $150,000
Air Transportation: $24,000
Air Transportation: $22,000
- Construction - Elementary and Secondary Education: $721,000
Regular Highways: $452,000
Elementary and Secondary Education: $31,000
- Current Operations - Elementary and Secondary Education: $35,703,000
Elementary and Secondary Education: $35,138,000
General - Other: $5,254,000
Regular Highways: $3,088,000
Regular Highways: $2,984,000
General - Other: $2,849,000
Health - Other: $1,874,000
Health - Other: $1,707,000
Police Protection: $1,682,000
Solid Waste Management: $1,549,000
Police Protection: $1,528,000
Correctional Institutions: $1,291,000
Correctional Institutions: $1,260,000
Solid Waste Management: $1,183,000
Judicial and Legal Services: $820,000
General Public Buildings: $816,000
Central Staff Services: $770,000
Judicial and Legal Services: $765,000
Central Staff Services: $626,000
General Public Buildings: $435,000
Financial Administration: $426,000
Financial Administration: $268,000
Air Transportation: $151,000
Natural Resources - Other: $122,000
Air Transportation: $106,000
Local Fire Protection: $106,000
Local Fire Protection: $100,000
Libraries: $100,000
Natural Resources - Other: $95,000
Libraries: $83,000
- Federal Intergovernmental - Other: $369,000
Highways: $114,000
Other: $8,000
- General - Interest on Debt: $600,000
Interest on Debt: $186,000
- Local Intergovernmental - General Local Government Support: $656,000
Other: $363,000
Education: $8,000
Education: $7,000
- Long Term Debt - Outstanding Unspecified Public Purpose: $24,104,000
Beginning Outstanding - Unspecified Public Purpose: $21,862,000
Outstanding Unspecified Public Purpose: $20,770,000
Issue, Unspecified Public Purpose: $17,860,000
Beginning Outstanding - Unspecified Public Purpose: $7,093,000
Retired Unspecified Public Purpose: $1,092,000
Retired Unspecified Public Purpose: $849,000
- Miscellaneous - Donations From Private Sources: $905,000
General Revenue - Other: $511,000
Fines and Forfeits: $340,000
General Revenue - Other: $284,000
Fines and Forfeits: $269,000
Interest Earnings: $231,000
Interest Earnings: $118,000
Sale of Property: $70,000
Rents: $12,000
Sale of Property: $4,000
Rents: $3,000
Donations From Private Sources: $1,000
- Other Capital Outlay - General - Other: $17,453,000
Elementary and Secondary Education: $1,492,000
Elementary and Secondary Education: $878,000
Regular Highways: $450,000
Solid Waste Management: $120,000
Solid Waste Management: $95,000
- Other Funds - Cash and Securities: $10,949,000
Cash and Securities: $8,272,000
- Sinking Funds - Cash and Securities: $680,000
Cash and Securities: $87,000
- State Intergovernmental - Education: $28,550,000
Education: $27,624,000
General Local Government Support: $6,248,000
Highways: $2,777,000
Other: $1,257,000
General Local Government Support: $1,065,000
Other: $1,037,000
Health and Hospitals: $225,000
Health and Hospitals: $118,000
- Tax - Property: $8,331,000
Property: $8,119,000
Motor Vehicle License: $1,564,000
Motor Vehicle License: $1,532,000
General Sales and Gross Receipts: $403,000
Other Selective Sales: $281,000
Other Selective Sales: $181,000
General Sales and Gross Receipts: $145,000
Alcoholic Beverage Sales: $104,000
Alcoholic Beverage Sales: $70,000
Other License: $35,000
Other License: $23,000
Public Utilities Sales: $8,000
Occupation and Business License - Other: $2,000
- Total Salaries and Wages: $21,880,000
: $21,621,000
Hardeman County government finances - Cash and Securities in 2020:
- Bond Funds - Cash and Securities: $881,000
- Charges - Other: $2,700,000
Other: $1,878,000
Solid Waste Management: $1,537,000
Elementary and Secondary Education - Other: $1,412,000
Elementary and Secondary Education - Other: $1,179,000
Solid Waste Management: $985,000
Elementary and Secondary Education School Lunch: $204,000
Elementary and Secondary Education School Lunch: $150,000
Air Transportation: $24,000
Air Transportation: $22,000
- Construction - Elementary and Secondary Education: $721,000
Regular Highways: $452,000
Elementary and Secondary Education: $31,000
- Current Operations - Elementary and Secondary Education: $35,703,000
Elementary and Secondary Education: $35,138,000
General - Other: $5,254,000
Regular Highways: $3,088,000
Regular Highways: $2,984,000
General - Other: $2,849,000
Health - Other: $1,874,000
Health - Other: $1,707,000
Police Protection: $1,682,000
Solid Waste Management: $1,549,000
Police Protection: $1,528,000
Correctional Institutions: $1,291,000
Correctional Institutions: $1,260,000
Solid Waste Management: $1,183,000
Judicial and Legal Services: $820,000
General Public Buildings: $816,000
Central Staff Services: $770,000
Judicial and Legal Services: $765,000
Central Staff Services: $626,000
General Public Buildings: $435,000
Financial Administration: $426,000
Financial Administration: $268,000
Air Transportation: $151,000
Natural Resources - Other: $122,000
Air Transportation: $106,000
Local Fire Protection: $106,000
Local Fire Protection: $100,000
Libraries: $100,000
Natural Resources - Other: $95,000
Libraries: $83,000
- Federal Intergovernmental - Other: $369,000
Highways: $114,000
Other: $8,000
- General - Interest on Debt: $600,000
Interest on Debt: $186,000
- Local Intergovernmental - General Local Government Support: $656,000
Other: $363,000
Education: $8,000
Education: $7,000
- Long Term Debt - Outstanding Unspecified Public Purpose: $24,104,000
Beginning Outstanding - Unspecified Public Purpose: $21,862,000
Outstanding Unspecified Public Purpose: $20,770,000
Issue, Unspecified Public Purpose: $17,860,000
Beginning Outstanding - Unspecified Public Purpose: $7,093,000
Retired Unspecified Public Purpose: $1,092,000
Retired Unspecified Public Purpose: $849,000
- Miscellaneous - Donations From Private Sources: $905,000
General Revenue - Other: $511,000
Fines and Forfeits: $340,000
General Revenue - Other: $284,000
Fines and Forfeits: $269,000
Interest Earnings: $231,000
Interest Earnings: $118,000
Sale of Property: $70,000
Rents: $12,000
Sale of Property: $4,000
Rents: $3,000
Donations From Private Sources: $1,000
- Other Capital Outlay - General - Other: $17,453,000
Elementary and Secondary Education: $1,492,000
Elementary and Secondary Education: $878,000
Regular Highways: $450,000
Solid Waste Management: $120,000
Solid Waste Management: $95,000
- Other Funds - Cash and Securities: $10,949,000
Cash and Securities: $8,272,000
- Sinking Funds - Cash and Securities: $680,000
Cash and Securities: $87,000
- State Intergovernmental - Education: $28,550,000
Education: $27,624,000
General Local Government Support: $6,248,000
Highways: $2,777,000
Other: $1,257,000
General Local Government Support: $1,065,000
Other: $1,037,000
Health and Hospitals: $225,000
Health and Hospitals: $118,000
- Tax - Property: $8,331,000
Property: $8,119,000
Motor Vehicle License: $1,564,000
Motor Vehicle License: $1,532,000
General Sales and Gross Receipts: $403,000
Other Selective Sales: $281,000
Other Selective Sales: $181,000
General Sales and Gross Receipts: $145,000
Alcoholic Beverage Sales: $104,000
Alcoholic Beverage Sales: $70,000
Other License: $35,000
Other License: $23,000
Public Utilities Sales: $8,000
Occupation and Business License - Other: $2,000
- Total Salaries and Wages: $21,880,000
: $21,621,000
Supplemental Security Income (SSI) in 2006:
- Total number of recipients: 1,510
- Number of aged recipients: 144
- Number of blind and disabled recipients: 1,366
- Number of recipients under 18: 242
- Number of recipients between 18 and 64: 936
- Number of recipients older than 64: 332
- Number of recipients also receiving OASDI: 561
- Amount of payments (thousands of dollars): 671
| Most common first names in Hardeman County, TN among deceased individuals | ||
| Name | Count | Lived (average) |
|---|---|---|
| James | 300 | 71.6 years |
| Mary | 230 | 78.7 years |
| John | 214 | 74.9 years |
| William | 209 | 73.9 years |
| Robert | 173 | 70.9 years |
| Willie | 125 | 72.6 years |
| George | 83 | 74.6 years |
| Thomas | 79 | 73.8 years |
| Annie | 67 | 79.0 years |
| Joe | 61 | 74.1 years |
| Most common last names in Hardeman County, TN among deceased individuals | ||
| Last name | Count | Lived (average) |
|---|---|---|
| Jones | 134 | 72.9 years |
| Smith | 112 | 77.3 years |
| Woods | 85 | 69.2 years |
| Cox | 73 | 78.2 years |
| Brown | 72 | 71.9 years |
| Williams | 70 | 72.4 years |
| Harris | 67 | 76.7 years |
| Johnson | 61 | 77.8 years |
| Howell | 60 | 75.1 years |
| Taylor | 58 | 73.6 years |
| Businesses in Hardeman County, TN | ||||
| Name | Count | Name | Count | |
|---|---|---|---|---|
| AT&T | 1 | McDonald's | 1 | |
| AutoZone | 1 | Pizza Hut | 1 | |
| Burger King | 1 | RadioShack | 1 | |
| Domino's Pizza | 1 | SONIC Drive-In | 1 | |
| FedEx | 1 | Subway | 2 | |
| Ford | 1 | Super 8 | 1 | |
| H&R Block | 1 | Taco Bell | 1 | |
| KFC | 1 | U-Haul | 1 | |
| La-Z-Boy | 1 | UPS | 1 | |
| Lane Furniture | 1 | Walmart | 1 | |