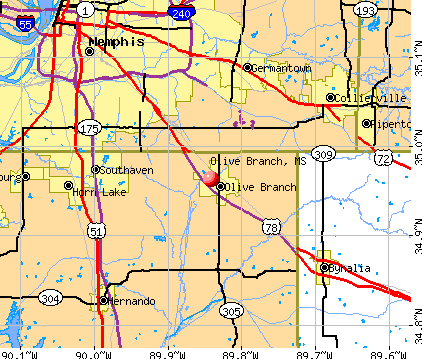
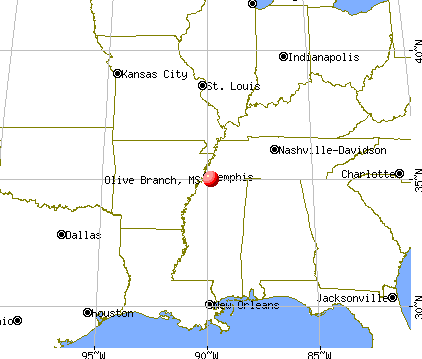
Olive Branch, Mississippi
Olive Branch: Magnolia Estates residential area of Olive Branch, MS

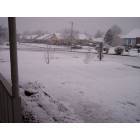
Olive Branch: 2010 Ice Storm in Olive Branch, MS
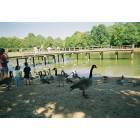
Olive Branch: City Park

Olive Branch: Main artery-Goodman Rd.,west of hwy.78
- add
your
Submit your own pictures of this city and show them to the world
- OSM Map
- General Map
- Google Map
- MSN Map
Population change since 2000: +123.6%
| Males: 22,287 | |
| Females: 24,799 |
| Median resident age: | 39.2 years |
| Mississippi median age: | 38.9 years |
Zip codes: 38654.
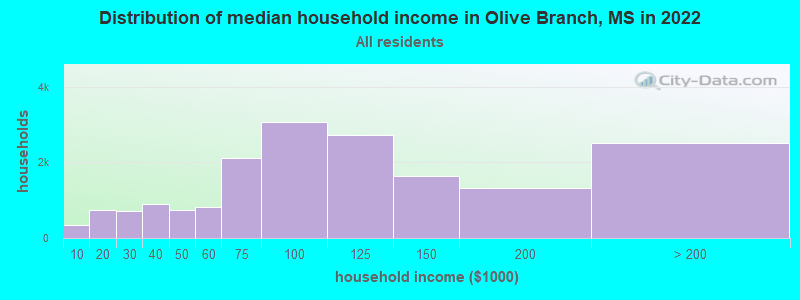
| Olive Branch: | $93,857 |
| MS: | $52,719 |
Estimated per capita income in 2022: $40,758 (it was $22,680 in 2000)
Olive Branch city income, earnings, and wages data
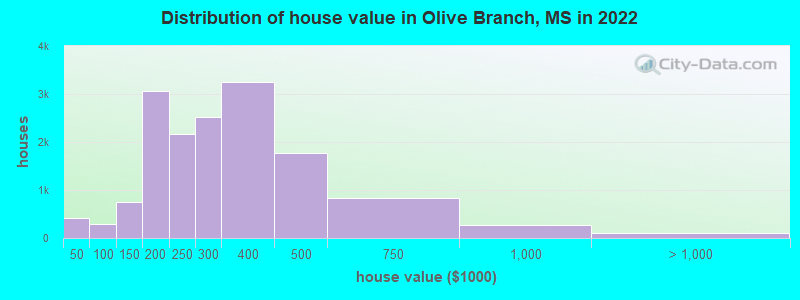
Estimated median house or condo value in 2022: $279,603 (it was $125,700 in 2000)
| Olive Branch: | $279,603 |
| MS: | $162,500 |
Mean prices in 2022: all housing units: $278,036; detached houses: $277,667; townhouses or other attached units: $201,793; in 3-to-4-unit structures: $142,409; mobile homes: $287,969
Median gross rent in 2022: $1,663.
(4.8% for White Non-Hispanic residents, 3.4% for Black residents, 18.6% for Hispanic or Latino residents, 39.4% for American Indian residents, 18.9% for other race residents, 14.5% for two or more races residents)
Detailed information about poverty and poor residents in Olive Branch, MS

Compare current foreclosures in Olive Branch, MS:
| Photo | Address | Area | Beds / Baths | Price | Details |
|---|---|---|---|---|---|

|
#1
W Sandidge Rd
Olive Branch, MS 38654
|
2,600 sq. feet
|
3 baths 4 beds |
show details | |

|
#2
Red Hawk Cv
Olive Branch, MS 38654
|
1,760 sq. feet
|
3 baths 5 beds |
show details | |

|
#3
Hunters Creek Dr
Olive Branch, MS 38654
|
3,183 sq. feet
|
3 baths 4 beds |
show details | |

|
#4
Greyhawk Cv N
Olive Branch, MS 38654
|
2,144 sq. feet
|
2 baths 3 beds |
show details | |

|
#5
Michaelson Dr
Olive Branch, MS 38654
|
1,415 sq. feet
|
3 baths 5 beds |
show details | |

|
#6
Nance Pl
Olive Branch, MS 38654
|
2,690 sq. feet
|
- baths 4 beds |
show details | |

|
#7
Yates Dr
Olive Branch, MS 38654
|
1,053 sq. feet
|
- baths 3 beds |
show details | |

|
#8
Desoto Rd
Olive Branch, MS 38654
|
1,028 sq. feet
|
- baths 2 beds |
show details | |

|
#9
Alexander Rd
Olive Branch, MS 38654
|
875 sq. feet
|
- baths 3 beds |
show details | |

|
#10
Dupree Rd
Olive Branch, MS 38654
|
1,370 sq. feet
|
- baths 3 beds |
show details |
| Photo | Address | Area | Beds / Baths | Price | Details |
|---|---|---|---|---|---|

|
#11
White Hawk Ln
Olive Branch, MS 38654
|
1,724 sq. feet
|
- baths 3 beds |
show details | |

|
#12
Deer Run Rd
Olive Branch, MS 38654
|
1,967 sq. feet
|
- baths 4 beds |
show details | |

|
#13
W Sandidge Rd
Olive Branch, MS 38654
|
748 sq. feet
|
- baths 2 beds |
show details | |

|
#14
Oakley Dr
Olive Branch, MS 38654
|
1,704 sq. feet
|
- baths 3 beds |
show details | |

|
#15
Yates Dr
Olive Branch, MS 38654
|
1,178 sq. feet
|
- baths 3 beds |
show details | |

|
#16
Medora Dr
Olive Branch, MS 38654
|
1,959 sq. feet
|
- baths 3 beds |
show details | |

|
#17
Westbrook Dr
Olive Branch, MS 38654
|
2,463 sq. feet
|
- baths 4 beds |
show details | |

|
#18
Billy Pat Dr
Olive Branch, MS 38654
|
1,562 sq. feet
|
- baths 3 beds |
show details | |

|
#19
Kingcrest Cv
Olive Branch, MS 38654
|
1,345 sq. feet
|
- baths 3 beds |
show details | |

|
#20
Braybourne Pl
Olive Branch, MS 38654
|
1,694 sq. feet
|
- baths 3 beds |
show details |
| Photo | Address | Area | Beds / Baths | Price | Details |
|---|---|---|---|---|---|

|
#21
Graham Lake Dr
Olive Branch, MS 38654
|
1,541 sq. feet
|
- baths 3 beds |
show details | |

|
#22
Windersgate Cir
Olive Branch, MS 38654
|
2,608 sq. feet
|
- baths 4 beds |
show details | |

|
#23
Seminole Dr
Olive Branch, MS 38654
|
1,260 sq. feet
|
- baths 3 beds |
show details | |

|
#24
Fontaine Pl
Olive Branch, MS 38654
|
1,118 sq. feet
|
- baths 3 beds |
show details | |

|
#25
Davis Grove Blvd
Olive Branch, MS 38654
|
2,191 sq. feet
|
- baths 4 beds |
show details | |

|
#26
Alexander Rd
Olive Branch, MS 38654
|
1,669 sq. feet
|
- baths 3 beds |
show details | |

|
#27
Coleman Rd
Olive Branch, MS 38654
|
1,537 sq. feet
|
- baths 4 beds |
show details | |

|
#28
Liles Ln
Olive Branch, MS 38654
|
2,366 sq. feet
|
- baths 4 beds |
show details | |

|
#29
Cedardale Rd
Olive Branch, MS 38654
|
1,516 sq. feet
|
- baths 3 beds |
show details | |

|
#30
Devon Ridge Dr
Olive Branch, MS 38654
|
1,313 sq. feet
|
- baths 3 beds |
show details |
| Photo | Address | Area | Beds / Baths | Price | Details |
|---|---|---|---|---|---|

|
#31
Nance Pl
Olive Branch, MS 38654
|
2,054 sq. feet
|
- baths 4 beds |
show details | |

|
#32
Wisteria Dr
Olive Branch, MS 38654
|
2,267 sq. feet
|
- baths 4 beds |
show details | |

|
#33
Oak Forest Dr
Olive Branch, MS 38654
|
1,158 sq. feet
|
- baths 3 beds |
show details | |

|
#34
Yates Dr
Olive Branch, MS 38654
|
1,374 sq. feet
|
- baths 3 beds |
show details | |

|
#35
Creekside Dr
Olive Branch, MS 38654
|
1,313 sq. feet
|
- baths 3 beds |
show details | |

|
#36
Stone Cross Dr
Olive Branch, MS 38654
|
1,874 sq. feet
|
- baths 3 beds |
show details | |

|
#37
Yates Dr
Olive Branch, MS 38654
|
1,148 sq. feet
|
- baths 3 beds |
show details | |

|
#38
Lafayette Dr
Olive Branch, MS 38654
|
1,115 sq. feet
|
- baths 3 beds |
show details | |

|
#39
Robby Cv
Olive Branch, MS 38654
|
1,415 sq. feet
|
- baths 3 beds |
show details | |

|
#40
Victor Dr
Olive Branch, MS 38654
|
1,839 sq. feet
|
- baths 3 beds |
show details |
| Photo | Address | Area | Beds / Baths | Price | Details |
|---|---|---|---|---|---|

|
#41
Asbury Pl
Olive Branch, MS 38654
|
1,304 sq. feet
|
- baths 4 beds |
show details | |

|
#42
Grandiflora Dr
Olive Branch, MS 38654
|
1,800 sq. feet
|
- baths 3 beds |
show details | |

|
#43
Rolling Pine Cir
Olive Branch, MS 38654
|
2,156 sq. feet
|
- baths 4 beds |
show details | |

|
#44
Montrose Dr
Olive Branch, MS 38654
|
1,498 sq. feet
|
- baths 3 beds |
show details | |

|
#45
Pecan Vw
Olive Branch, MS 38654
|
1,162 sq. feet
|
- baths 3 beds |
show details | |

|
#46
White Hawk Ln
Olive Branch, MS 38654
|
1,560 sq. feet
|
- baths 3 beds |
show details | |

|
#47
Ivy Trails Dr
Olive Branch, MS 38654
|
1,910 sq. feet
|
- baths 3 beds |
show details | |

|
#48
Saddlebrook Cv
Olive Branch, MS 38654
|
2,318 sq. feet
|
- baths 3 beds |
show details | |

|
#49
Shiloah Cv S
Olive Branch, MS 38654
|
1,638 sq. feet
|
- baths 3 beds |
show details | |

|
Check over 1 million property listings on Foreclosure.com!
|
browse all offers | |||


- 25,80554.6%White alone
- 16,51234.9%Black alone
- 2,4855.3%Hispanic
- 1,6813.6%Two or more races
- 7741.6%Asian alone
- 1480.3%Other race alone
- 240.05%American Indian alone
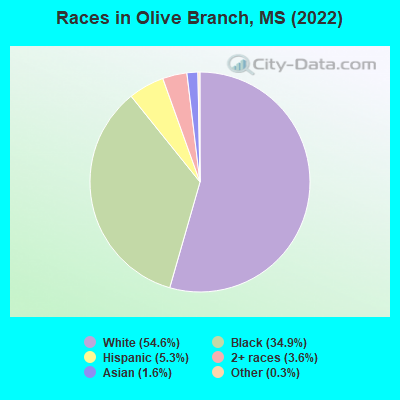
Races in Olive Branch detailed stats: ancestries, foreign born residents, place of birth
According to our research of Mississippi and other state lists, there were 83 registered sex offenders living in Olive Branch, Mississippi as of April 27, 2024.
The ratio of all residents to sex offenders in Olive Branch is 428 to 1.
The ratio of registered sex offenders to all residents in this city is lower than the state average.
Type |
2009 |
2010 |
2011 |
2012 |
2013 |
2014 |
2015 |
2016 |
2017 |
2018 |
2019 |
2020 |
2021 |
2022 |
|---|---|---|---|---|---|---|---|---|---|---|---|---|---|---|
| Murders (per 100,000) | 1 (3.0) | 1 (3.0) | 2 (6.0) | 1 (2.9) | 0 (0.0) | 2 (5.7) | 0 (0.0) | 2 (5.5) | 1 (2.7) | 0 (0.0) | 4 (10.3) | 3 (7.6) | 4 (9.9) | 2 (4.9) |
| Rapes (per 100,000) | 17 (51.1) | 22 (65.7) | 7 (20.8) | 12 (35.1) | 2 (5.7) | 4 (11.3) | 2 (5.6) | 4 (11.0) | 3 (8.1) | 0 (0.0) | 15 (38.7) | 12 (30.3) | 18 (44.7) | 11 (27.1) |
| Robberies (per 100,000) | 29 (87.1) | 20 (59.7) | 21 (62.5) | 17 (49.8) | 17 (48.8) | 27 (76.5) | 10 (27.8) | 22 (60.3) | 12 (32.2) | 0 (0.0) | 21 (54.2) | 17 (43.0) | 16 (39.7) | 10 (24.6) |
| Assaults (per 100,000) | 43 (129.2) | 32 (95.6) | 62 (184.5) | 40 (117.2) | 47 (135.0) | 57 (161.4) | 54 (150.3) | 39 (106.8) | 32 (85.9) | 0 (0.0) | 38 (98.0) | 62 (156.7) | 92 (228.2) | 105 (258.3) |
| Burglaries (per 100,000) | 226 (679.0) | 383 (1,144) | 414 (1,232) | 402 (1,177) | 359 (1,031) | 295 (835.4) | 378 (1,052) | 382 (1,046) | 284 (762.6) | 0 (0.0) | 110 (283.8) | 101 (255.3) | 85 (210.9) | 60 (147.6) |
| Thefts (per 100,000) | 743 (2,232) | 552 (1,649) | 517 (1,538) | 562 (1,646) | 521 (1,496) | 618 (1,750) | 583 (1,622) | 510 (1,397) | 382 (1,026) | 11 (28.9) | 699 (1,803) | 669 (1,691) | 520 (1,290) | 602 (1,481) |
| Auto thefts (per 100,000) | 77 (231.3) | 87 (259.8) | 48 (142.8) | 35 (102.5) | 36 (103.4) | 35 (99.1) | 34 (94.6) | 40 (109.6) | 20 (53.7) | 1 (2.6) | 78 (201.2) | 99 (250.2) | 96 (238.2) | 93 (228.8) |
| Arson (per 100,000) | 5 (15.0) | 2 (6.0) | 2 (6.0) | 1 (2.9) | 1 (2.9) | 7 (19.8) | 3 (8.3) | 2 (5.5) | 1 (2.7) | 0 (0.0) | 4 (10.3) | 4 (10.1) | 2 (5.0) | 1 (2.5) |
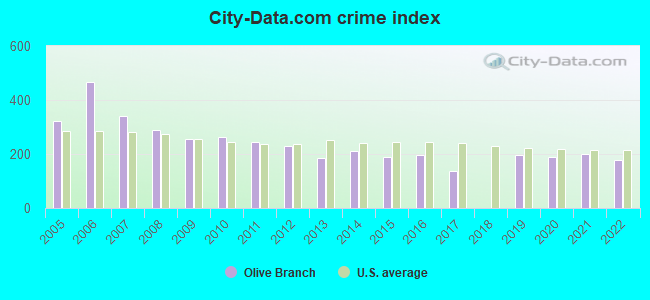
| City-Data.com crime index | 254.2 | 262.4 | 243.4 | 228.8 | 186.5 | 212.0 | 188.9 | 197.0 | 137.4 | 1.4 | 195.6 | 189.2 | 198.5 | 178.4 |
The City-Data.com crime index weighs serious crimes and violent crimes more heavily. Higher means more crime, U.S. average is 246.1. It adjusts for the number of visitors and daily workers commuting into cities.
Crime rate in Olive Branch detailed stats: murders, rapes, robberies, assaults, burglaries, thefts, arson
Full-time law enforcement employees in 2021, including police officers: 90 (81 officers - 67 male; 14 female).
| Officers per 1,000 residents here: | 2.01 |
| Mississippi average: | 2.18 |
 Recent articles from our blog. Our writers, many of them Ph.D. graduates or candidates, create easy-to-read articles on a wide variety of topics.

 | Texas to Olive Branch Mississippi ? (14 replies) |
| Olive Branch, Mississippi made number 5 in Money magazine's "Best Places to Live 2017" (11 replies) |
| "Home Town" on HGTV - Laurel MS (85 replies) |
| Olive Branch MS or Collierville, TN (2 replies) |
| Possible move from to Memphis to Olive Branch (18 replies) |
| North Mississippi's lovely towns (11 replies) |
Latest news from Olive Branch, MS collected exclusively by city-data.com from local newspapers, TV, and radio stations
Olive Branch, MS City Guides:
Ancestries: American (13.7%), English (8.1%), Irish (4.5%), Italian (2.8%), German (2.7%), Polish (1.5%).
Current Local Time: CST time zone
Incorporated on 05/01/1874
Elevation: 345 feet
Land area: 36.2 square miles.
Population density: 1,301 people per square mile (low).
2,128 residents are foreign born (2.5% Latin America, 1.2% Asia).
| This city: | 4.5% |
| Mississippi: | 2.3% |
Median real estate property taxes paid for housing units with mortgages in 2022: $1,861 (0.7%)
Median real estate property taxes paid for housing units with no mortgage in 2022: $1,776 (0.7%)
Nearest city with pop. 50,000+: Memphis, TN  (13.0 miles , pop. 650,100).
Nearest city with pop. 1,000,000+: Dallas, TX (425.9 miles , pop. 1,188,580).
Nearest cities:
), Latitude: 34.96 N, Longitude: 89.84 W
Daytime population change due to commuting: +1,526 (+3.2%)
Workers who live and work in this city: 7,632 (31.4%)
Area code: 662
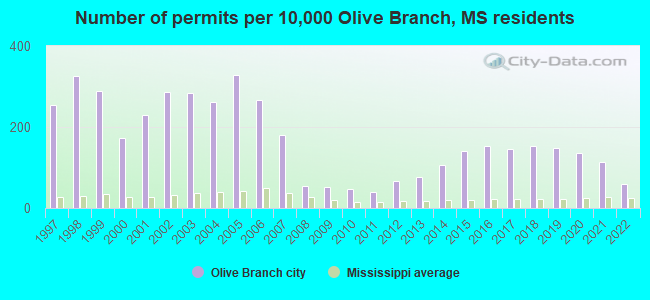
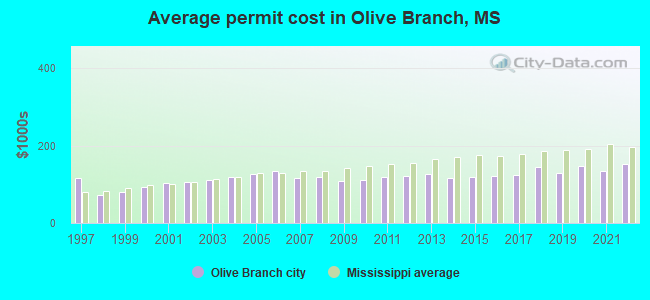
Single-family new house construction building permits:
- 2022: 126 buildings, average cost: $153,200
- 2021: 237 buildings, average cost: $135,400
- 2020: 284 buildings, average cost: $147,600
- 2019: 311 buildings, average cost: $129,000
- 2018: 321 buildings, average cost: $145,100
- 2017: 307 buildings, average cost: $123,900
- 2016: 320 buildings, average cost: $120,700
- 2015: 297 buildings, average cost: $119,800
- 2014: 224 buildings, average cost: $116,900
- 2013: 162 buildings, average cost: $125,900
- 2012: 140 buildings, average cost: $120,600
- 2011: 83 buildings, average cost: $118,100
- 2010: 97 buildings, average cost: $111,100
- 2009: 108 buildings, average cost: $109,000
- 2008: 113 buildings, average cost: $118,100
- 2007: 378 buildings, average cost: $115,400
- 2006: 560 buildings, average cost: $135,100
- 2005: 692 buildings, average cost: $125,700
- 2004: 551 buildings, average cost: $118,900
- 2003: 595 buildings, average cost: $111,200
- 2002: 605 buildings, average cost: $106,500
- 2001: 484 buildings, average cost: $103,500
- 2000: 365 buildings, average cost: $92,000
- 1999: 607 buildings, average cost: $79,800
- 1998: 686 buildings, average cost: $72,900
- 1997: 536 buildings, average cost: $116,000
| Here: | 2.0% |
| Mississippi: | 2.6% |
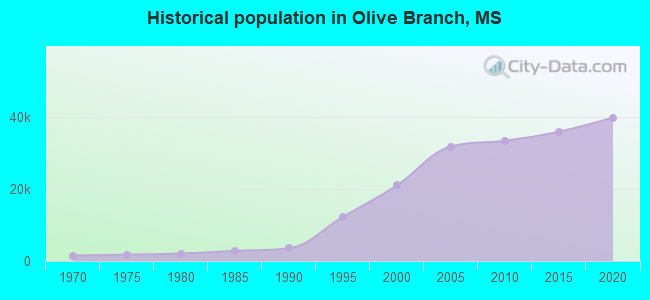
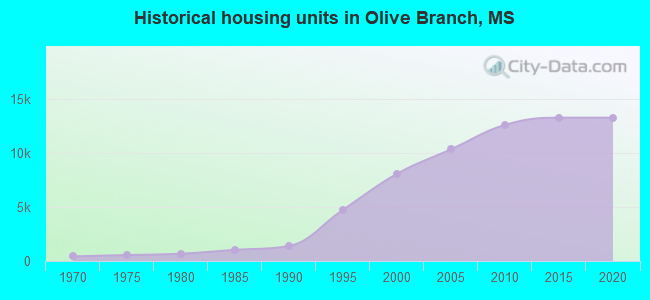
Population change in the 1990s: +13,467 (+177.5%).
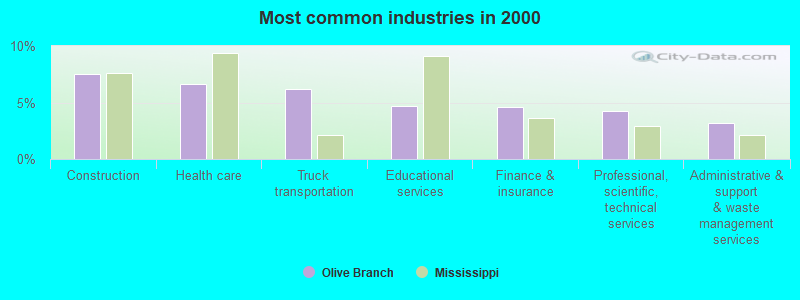
- Construction (7.6%)
- Health care (6.6%)
- Truck transportation (6.2%)
- Educational services (4.6%)
- Finance & insurance (4.6%)
- Professional, scientific, technical services (4.2%)
- Administrative & support & waste management services (3.2%)
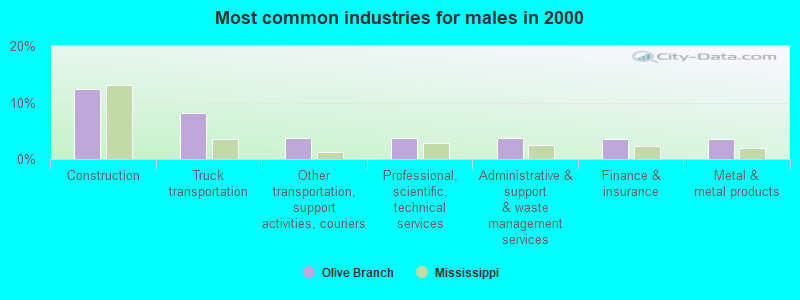
- Construction (12.3%)
- Truck transportation (8.1%)
- Other transportation, support activities, couriers (3.7%)
- Professional, scientific, technical services (3.7%)
- Administrative & support & waste management services (3.6%)
- Finance & insurance (3.6%)
- Metal & metal products (3.5%)
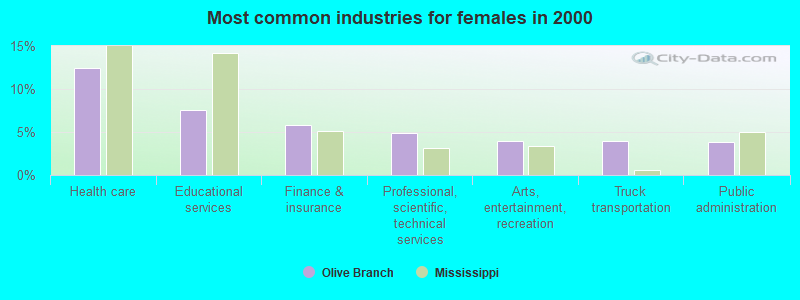
- Health care (12.4%)
- Educational services (7.5%)
- Finance & insurance (5.8%)
- Professional, scientific, technical services (4.9%)
- Arts, entertainment, recreation (4.0%)
- Truck transportation (3.9%)
- Public administration (3.9%)
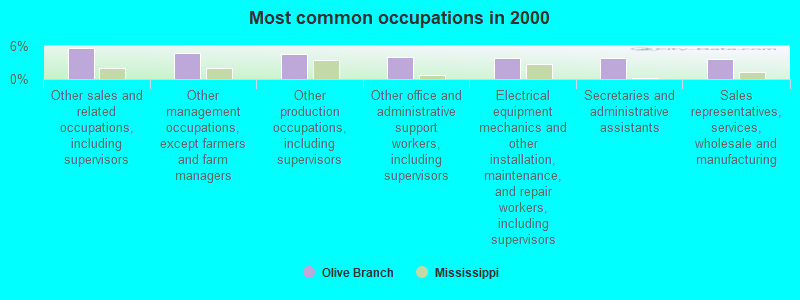
- Other sales and related occupations, including supervisors (5.7%)
- Other management occupations, except farmers and farm managers (4.7%)
- Other production occupations, including supervisors (4.6%)
- Other office and administrative support workers, including supervisors (4.0%)
- Electrical equipment mechanics and other installation, maintenance, and repair workers, including supervisors (3.9%)
- Secretaries and administrative assistants (3.8%)
- Sales representatives, services, wholesale and manufacturing (3.7%)
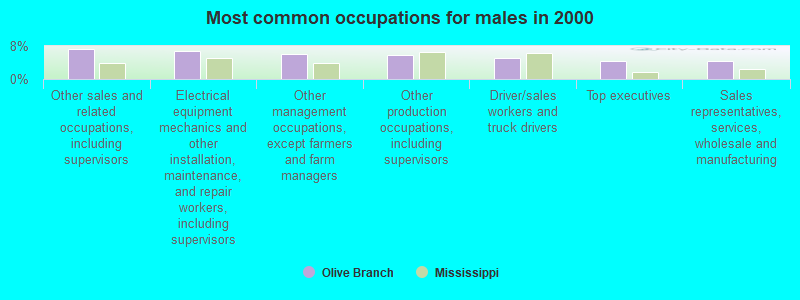
- Other sales and related occupations, including supervisors (7.2%)
- Electrical equipment mechanics and other installation, maintenance, and repair workers, including supervisors (6.8%)
- Other management occupations, except farmers and farm managers (6.0%)
- Other production occupations, including supervisors (5.8%)
- Driver/sales workers and truck drivers (5.2%)
- Top executives (4.3%)
- Sales representatives, services, wholesale and manufacturing (4.3%)

- Secretaries and administrative assistants (8.3%)
- Other office and administrative support workers, including supervisors (7.2%)
- Customer service representatives (4.9%)
- Preschool, kindergarten, elementary, and middle school teachers (4.7%)
- Information and record clerks, except customer service representatives (4.3%)
- Health technologists and technicians (3.8%)
- Other sales and related occupations, including supervisors (3.8%)
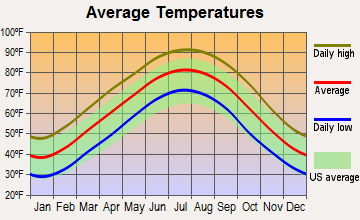
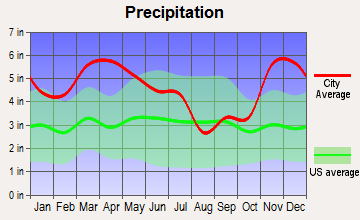
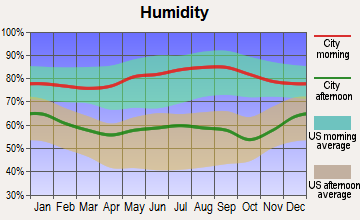
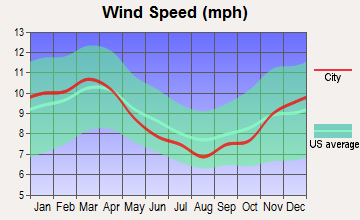
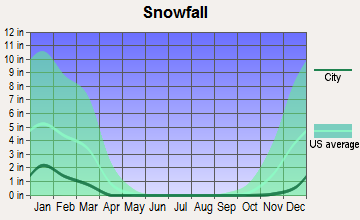
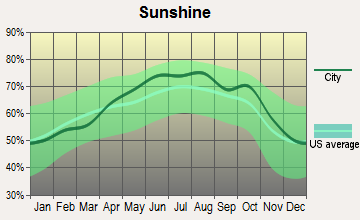
Average climate in Olive Branch, Mississippi
Based on data reported by over 4,000 weather stations
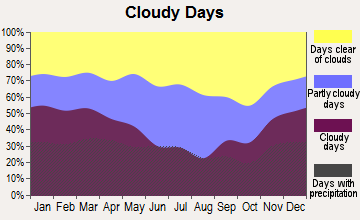
|
|

(lower is better)
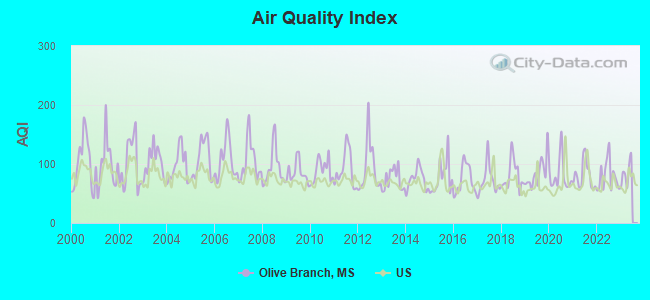
Air Quality Index (AQI) level in 2022 was 79.6. This is about average.
| City: | 79.6 |
| U.S.: | 72.6 |
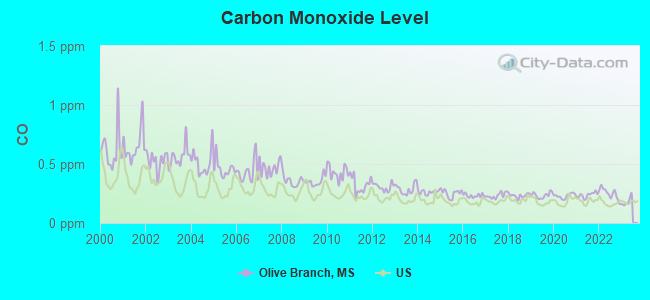
Carbon Monoxide (CO) [ppm] level in 2022 was 0.249. This is about average. Closest monitor was 11.2 miles away from the city center.
| City: | 0.249 |
| U.S.: | 0.251 |
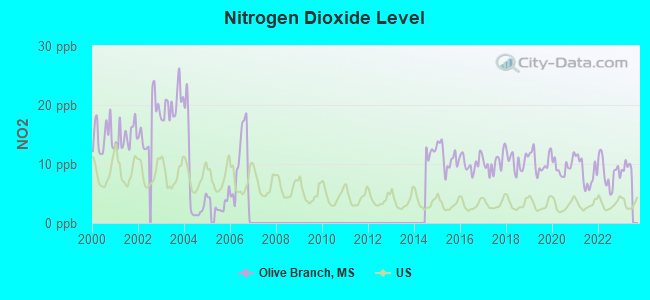
Nitrogen Dioxide (NO2) [ppb] level in 2022 was 8.49. This is significantly worse than average. Closest monitor was 11.4 miles away from the city center.
| City: | 8.49 |
| U.S.: | 5.11 |
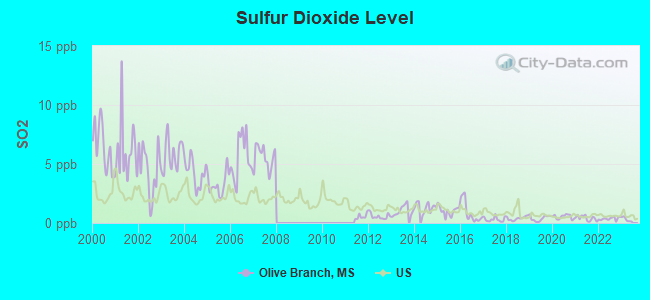
Sulfur Dioxide (SO2) [ppb] level in 2022 was 0.365. This is significantly better than average. Closest monitor was 11.4 miles away from the city center.
| City: | 0.365 |
| U.S.: | 1.515 |
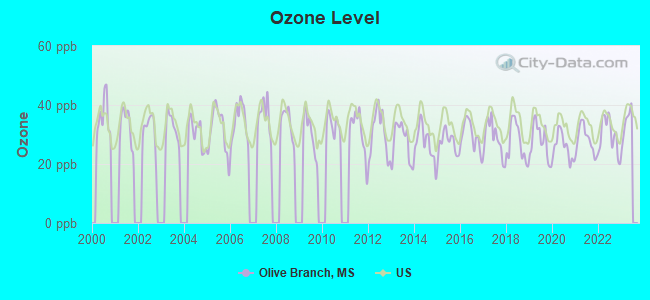
Ozone [ppb] level in 2022 was 29.8. This is about average. Closest monitor was 12.9 miles away from the city center.
| City: | 29.8 |
| U.S.: | 33.3 |
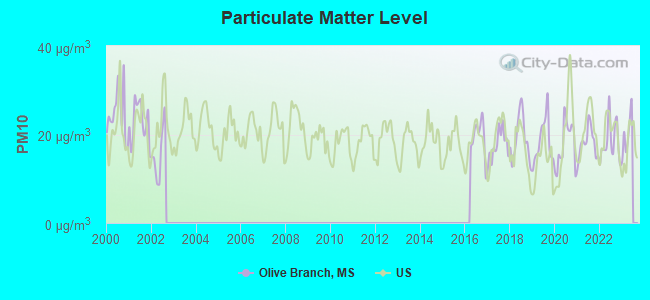
Particulate Matter (PM10) [µg/m3] level in 2022 was 18.3. This is about average. Closest monitor was 13.1 miles away from the city center.
| City: | 18.3 |
| U.S.: | 19.2 |
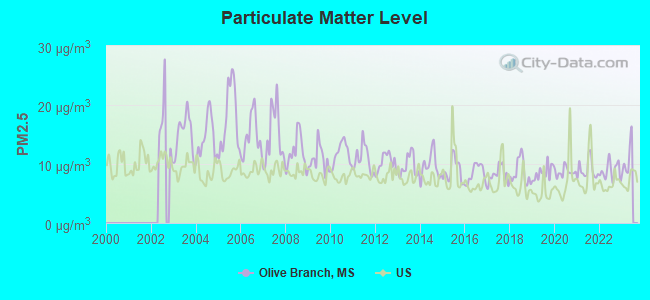
Particulate Matter (PM2.5) [µg/m3] level in 2022 was 8.85. This is about average. Closest monitor was 10.5 miles away from the city center.
| City: | 8.85 |
| U.S.: | 8.11 |
Tornado activity:
Olive Branch-area historical tornado activity is near Mississippi state average. It is 90% greater than the overall U.S. average.
On 3/21/1952, a category F4 (max. wind speeds 207-260 mph) tornado 11.2 miles away from the Olive Branch city center killed 16 people and injured 74 people and caused between $50,000 and $500,000 in damages.
On 4/24/1970, a category F3 (max. wind speeds 158-206 mph) tornado 4.0 miles away from the city center injured 18 people and caused between $500,000 and $5,000,000 in damages.
Earthquake activity:
Olive Branch-area historical earthquake activity is significantly above Mississippi state average. It is 358% greater than the overall U.S. average.On 3/25/1976 at 00:41:20, a magnitude 5.0 (4.9 MB, 5.0 LG, Class: Moderate, Intensity: VI - VII) earthquake occurred 54.1 miles away from Olive Branch center
On 5/4/1991 at 01:18:54, a magnitude 5.0 (4.4 MB, 4.6 LG, 5.0 LG, Depth: 3.1 mi) earthquake occurred 110.7 miles away from Olive Branch center
On 4/27/1989 at 16:47:49, a magnitude 4.7 (4.6 MB, 4.7 LG, 4.3 LG, Class: Light, Intensity: IV - V) earthquake occurred 72.3 miles away from Olive Branch center
On 9/26/1990 at 13:18:51, a magnitude 5.0 (4.7 MB, 4.8 LG, 5.0 LG, Depth: 7.7 mi) earthquake occurred 153.4 miles away from the city center
On 3/25/1976 at 01:00:11, a magnitude 4.5 (4.1 MB, 4.5 LG) earthquake occurred 57.5 miles away from Olive Branch center
On 4/18/2008 at 09:36:59, a magnitude 5.4 (5.1 MB, 4.8 MS, 5.4 MW, 5.2 MW) earthquake occurred 264.6 miles away from the city center
Magnitude types: regional Lg-wave magnitude (LG), body-wave magnitude (MB), surface-wave magnitude (MS), moment magnitude (MW)
Natural disasters:
The number of natural disasters in DeSoto County (9) is smaller than the US average (15).Major Disasters (Presidential) Declared: 5
Emergencies Declared: 2
Causes of natural disasters: Floods: 5, Storms: 4, Tornadoes: 4, Freezes: 2, Winds: 2, Drought: 1, Heavy Rain: 1, Winter Storm: 1, Other: 1 (Note: some incidents may be assigned to more than one category).

Hospitals and medical centers in Olive Branch:
Airports located in Olive Branch:
- Olive Branch Airport (OLV) (Runways: 1, Itinerant Ops: 29,431, Local Ops: 36,426, Military Ops: 102)
- Double O Ranch Airport (MS00) (Runways: 1)
Amtrak station near Olive Branch:
- 17 miles: MEMPHIS (545 S. MAIN ST.) . Services: ticket office, partially wheelchair accessible, enclosed waiting area, public restrooms, public payphones, vending machines, free short-term parking, free long-term parking, call for car rental service, call for taxi service, public transit connection.
Colleges/universities with over 2000 students nearest to Olive Branch:
- University of Memphis (about 14 miles; Memphis, TN; Full-time enrollment: 17,427)
- Rhodes College (about 16 miles; Memphis, TN; FT enrollment: 2,052)
- Southwest Tennessee Community College (about 17 miles; Memphis, TN; FT enrollment: 8,043)
- Northwest Mississippi Community College (about 25 miles; Senatobia, MS; FT enrollment: 6,607)
- University of Mississippi (about 45 miles; University, MS; FT enrollment: 17,642)
- Coahoma Community College (about 65 miles; Clarksdale, MS; FT enrollment: 2,284)
- Union University (about 75 miles; Jackson, TN; FT enrollment: 4,051)
Public high schools in Olive Branch:
- OLIVE BRANCH HIGH SCHOOL (Location: 9366 E SANDIDGE ROAD, Grades: 9-12)
- LEWISBURG HIGH SCHOOL (Location: 1755 CRAFT ROAD, Grades: 9-12)
- CENTER HILL HIGH SCHOOL (Location: 13250 KIRK ROAD, Grades: 9-12)
- DESOTO CO CAREER CENTER EAST (Location: 8890 DEERFIELD DR, Grades: 10-12)
Private high schools in Olive Branch:
Biggest public elementary/middle schools in Olive Branch:
- OLIVE BRANCH ELEM (Location: 9549 E PIGEON ROOST ROAD, Grades: PK-1)
- OLIVE BRANCH MIDDLE (Location: 6530 S. BLOCKER STREET, Grades: 6-8)
- OLIVE BRANCH INTERMEDIATE SCHOOL (Location: 8631 E. PIGEON ROOST RD, Grades: 4-5)
- CENTER HILL ELEMENTARY SCHOOL (Location: 13662 CENTER HILL ROAD, Grades: PK-5)
- CHICKASAW ELEMENTARY SCHOOL (Location: 6391 CHICKASAW, Grades: 2-3)
- PLEASANT HILL ELEMENTARY (Location: 7686 PLEASANT HILL ROAD, Grades: PK-5)
- LEWISBURG ELEMENTARY SCHOOL (Location: 1717 CRAFT ROAD, Grades: 3-5)
- OVERPARK ELEMENTARY (Location: 8530 FOREST HILL IRENE ROAD, Grades: PK-5)
- LEWISBURG MIDDLE (Location: 1711 CRAFT RD, Grades: 6-8)
- CENTER HILL MIDDLE (Location: 8756 FOREST HILL IRENE, Grades: 6-8)
Private elementary/middle school in Olive Branch:
User-submitted facts and corrections:
- Director, Community Relations/Tourism City of Olive Branch, MS
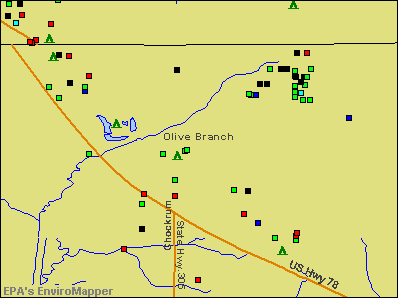
Points of interest:
Notable locations in Olive Branch: Holiday Golf Course (A), Metro Industrial Park (B), Olive Branch Country Club (C), Olive Branch Industrial Park (D), Olive Branch Public Library (E), Olive Branch City Hall (F), Summers Hill Volunteer Fire Department Station 11 (G), Summershill Fire Station Number 2 (H), Olive Branch Fire Department Station 3 (I), Olive Branch Fire Department Station 4 (J), Olive Branch Fire Department Station 1 (K), Olive Branch Fire Department Station 2 (L). Display/hide their locations on the map
Shopping Center: Mid-South Factory Outlet Shopping Center (1). Display/hide its location on the map
Churches in Olive Branch include: Saint Lukes Church of God in Christ (A), Queen of Peace Catholic Church (B), Olive Branch Church of Christ (C), Mount Pisgah Missionary Baptist Church (D), Mineral Wells Methodist Church (E), Mineral Wells Baptist Church (F), Maples Memorial United Methodist Church (G), Longview Heights Baptist Church (H), Liberty Baptist Church (I). Display/hide their locations on the map
Cemeteries: Saint Thomas Cemetery (1), Jeremiah Cemetery (2), Cowan Cemetery (3), Clemonts Cemetery (4), Blocker Cemetery (5), Bass Cemetery (6). Display/hide their locations on the map
Reservoir: Maywood Lake (A). Display/hide its location on the map
Creek: Nolehoe Creek (A). Display/hide its location on the map
Hotels: Comfort Inn Olive Branch (7049 Enterprise Drive) (1), Holiday Inn Express Hotel & Suites (8900 Expressway Drive) (2), Hampton Inn Memphis-Olive Branch (6830 Crumpler Boulevard) (3), Olive Branch Motel (9575 Highway 178) (4), Whispering Woods Hotel & Conference Center - Professional Shop (11200 Goodman Road) (5), Super 8 of Olive Branch (11112 Business Centre) (6), Whispering Woods Hotel & Conference Center - Golf Course Superinten (11200 Goodman Road) (7). Display/hide their approximate locations on the map
Birthplace of: Ricky Stenhouse, Jr. - Stock car racing driver.
Drinking water stations with addresses in Olive Branch and their reported violations in the past:
CITY OF OLIVE BRANCH (Population served: 39,430, Groundwater):Past health violations:LEWISBURG WATER ASSOCIATION (Population served: 4,745, Groundwater):Past monitoring violations:
- MCL, Monthly (TCR) - In OCT-2007, Contaminant: Coliform. Follow-up actions: St Public Notif requested (NOV-09-2007), St Violation/Reminder Notice (NOV-09-2007), St Compliance achieved (NOV-28-2007)
- Monitoring and Reporting (DBP) - Between JAN-2010 and MAR-2010, Contaminant: Chlorine. Follow-up actions: St Public Notif requested (FEB-05-2010), St Formal NOV issued (FEB-05-2010), St Public Notif received (JUN-30-2010), St Compliance achieved (JUN-30-2010)
- 84 regular monitoring violations
Past monitoring violations:LEWISBURG -INGRAMS MILL NORTH (Population served: 160, Groundwater):
- 84 regular monitoring violations
Past monitoring violations:
- 65 regular monitoring violations
| This city: | 2.8 people |
| Mississippi: | 2.6 people |
| This city: | 77.3% |
| Whole state: | 69.0% |
| This city: | 4.8% |
| Whole state: | 5.7% |
Likely homosexual households (counted as self-reported same-sex unmarried-partner households)
- Lesbian couples: 0.3% of all households
- Gay men: 0.3% of all households
Banks with most branches in Olive Branch (2011 data):
- BancorpSouth Bank: Olive Branch Branch, Hacks Cross Branch, Olive Branch Main Branch. Info updated 2007/07/18: Bank assets: $12,990.3 mil, Deposits: $10,863.8 mil, headquarters in Tupelo, MS, positive income, Commercial Lending Specialization, 271 total offices, Holding Company: Bancorpsouth, Inc.
- First Security Bank: Barton Branch, - Goodman Road B, Olive Branch Branch. Info updated 2006/11/03: Bank assets: $498.4 mil, Deposits: $410.0 mil, headquarters in Batesville, MS, positive income, Commercial Lending Specialization, 17 total offices, Holding Company: Security Capital Corporation
- Trustmark National Bank: Holiday Crossing Branch at 7147 Hacks Cross Road, branch established on 2006/08/14; Olive Branch Branch at 9039 Pigeon Roost Rd, branch established on 1983/03/28. Info updated 2012/03/26: Bank assets: $9,612.1 mil, Deposits: $7,410.1 mil, headquarters in Jackson, MS, positive income, Commercial Lending Specialization, 186 total offices, Holding Company: Trustmark Corporation
- First Tennessee Bank, National Association: Olive Branch Financial Branch at 9034 Germantown Road, branch established on 1999/06/24; Olive Branch at 7430 Goodman Rd, branch established on 2004/07/01. Info updated 2009/09/08: Bank assets: $24,563.4 mil, Deposits: $16,402.1 mil, headquarters in Memphis, TN, positive income, Commercial Lending Specialization, 180 total offices, Holding Company: First Horizon National Corporation
- SunTrust Bank: Olive Branch at 7427 Goodman Road, branch established on 1995/11/29. Info updated 2010/05/27: Bank assets: $171,291.7 mil, Deposits: $129,833.2 mil, headquarters in Atlanta, GA, positive income, Commercial Lending Specialization, 1716 total offices, Holding Company: Suntrust Banks, Inc.
- The Citizens National Bank of Meridian: Olive Branch at 7203 Goodman Road, 2nd Floor Suite D, branch established on 2005/12/27. Info updated 2006/11/03: Bank assets: $1,115.7 mil, Deposits: $932.3 mil, headquarters in Meridian, MS, positive income, Commercial Lending Specialization, 29 total offices, Holding Company: Citizens National Banc Corp.
- Regions Bank: Olive Branch Branch at 8975 Goodman Road, branch established on 1972/05/01. Info updated 2011/02/24: Bank assets: $123,368.2 mil, Deposits: $98,301.3 mil, headquarters in Birmingham, AL, positive income, Commercial Lending Specialization, 1778 total offices, Holding Company: Regions Financial Corporation
- BankPlus: Olive Branch Main Branch at 8990 Pigeon Roost Road, branch established on 2006/03/09. Info updated 2006/11/03: Bank assets: $2,177.0 mil, Deposits: $1,696.4 mil, headquarters in Belzoni, MS, positive income, Commercial Lending Specialization, 62 total offices, Holding Company: Bancplus Corporation
- Merchants and Farmers Bank: Olive Branch Office at 6543 Goodman Road, branch established on 2004/11/15. Info updated 2007/01/11: Bank assets: $1,561.3 mil, Deposits: $1,372.4 mil, headquarters in Kosciusko, MS, positive income, Commercial Lending Specialization, 39 total offices, Holding Company: First M & F Corporation
- 2 other banks with 2 local branches
For population 15 years and over in Olive Branch:
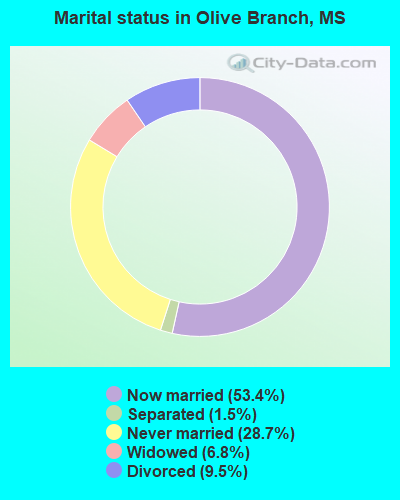
- Never married: 28.7%
- Now married: 53.4%
- Separated: 1.5%
- Widowed: 6.8%
- Divorced: 9.5%
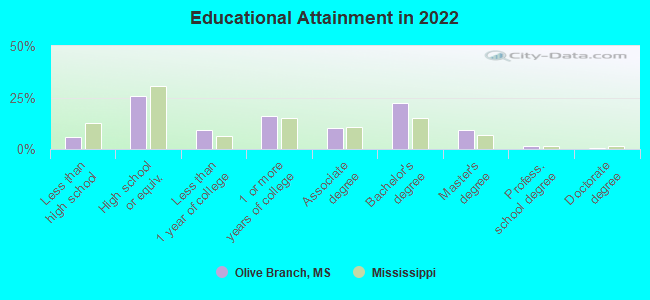
For population 25 years and over in Olive Branch:
- High school or higher: 94.6%
- Bachelor's degree or higher: 32.5%
- Graduate or professional degree: 11.1%
- Unemployed: 3.1%
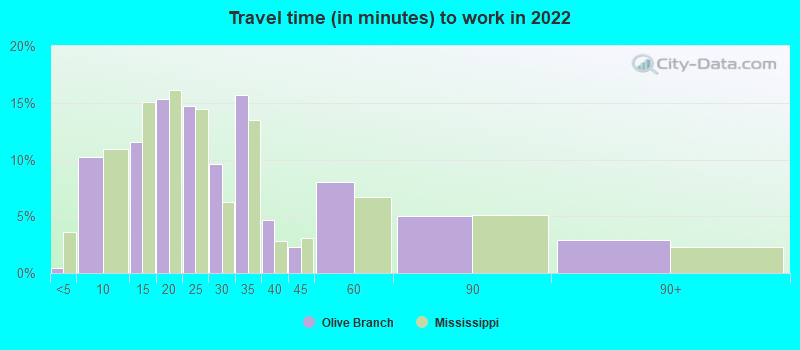
- Mean travel time to work (commute): 22.3 minutes
| Here: | 10.1 |
| Mississippi average: | 11.8 |
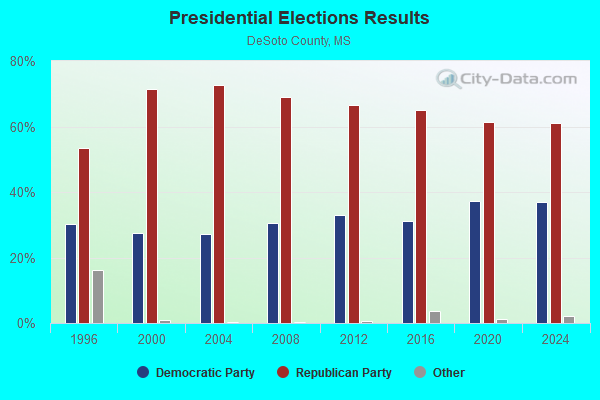
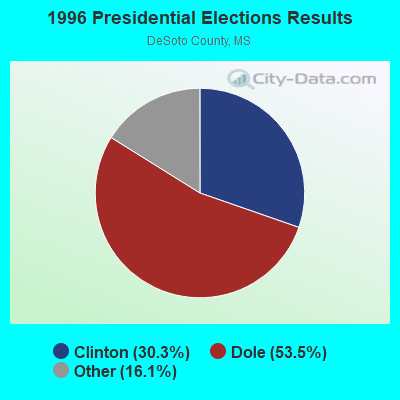


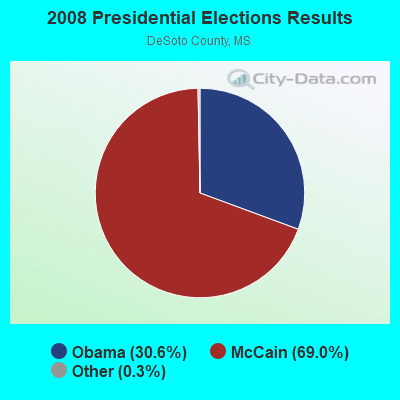

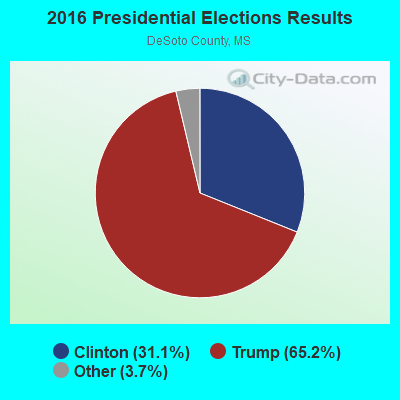
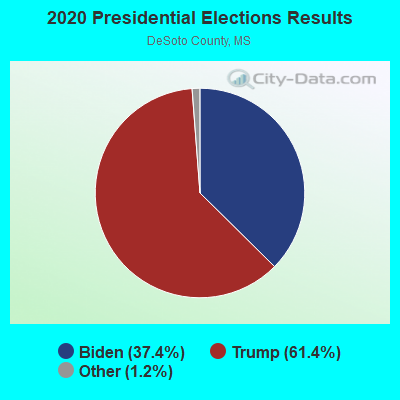
Graphs represent county-level data. Detailed 2008 Election Results
Religion statistics for Olive Branch, MS (based on DeSoto County data)
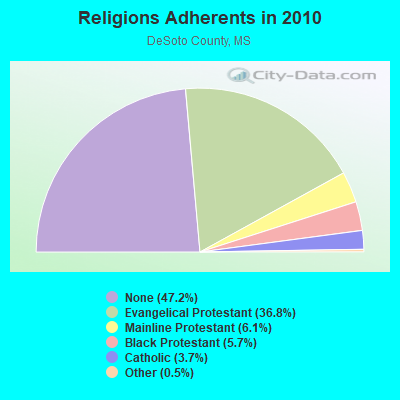
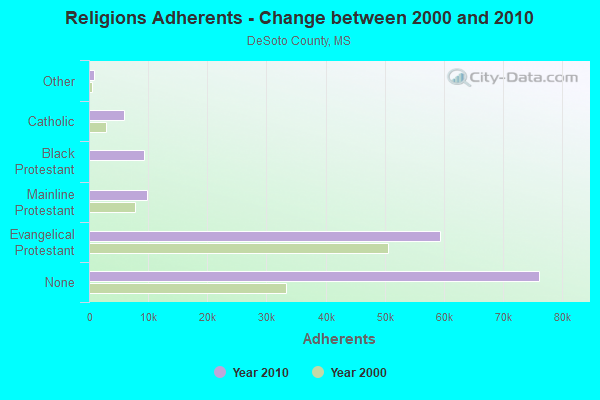
| Religion | Adherents | Congregations |
|---|---|---|
| Evangelical Protestant | 59,275 | 124 |
| Mainline Protestant | 9,807 | 26 |
| Black Protestant | 9,269 | 24 |
| Catholic | 5,928 | 3 |
| Other | 827 | 3 |
| None | 76,146 | - |
Food Environment Statistics:
| Here: | 1.07 / 10,000 pop. |
| Mississippi: | 2.08 / 10,000 pop. |
| DeSoto County: | 0.27 / 10,000 pop. |
| Mississippi: | 0.24 / 10,000 pop. |
| This county: | 0.40 / 10,000 pop. |
| State: | 0.80 / 10,000 pop. |
| Here: | 3.89 / 10,000 pop. |
| Mississippi: | 6.36 / 10,000 pop. |
| DeSoto County: | 6.44 / 10,000 pop. |
| State: | 5.03 / 10,000 pop. |
| DeSoto County: | 10.4% |
| Mississippi: | 12.3% |
| DeSoto County: | 31.6% |
| Mississippi: | 33.1% |
| DeSoto County: | 18.6% |
| Mississippi: | 14.4% |
Health and Nutrition:
| This city: | 51.6% |
| Mississippi: | 48.6% |
| This city: | 50.0% |
| State: | 45.3% |
| Olive Branch: | 28.4 |
| Mississippi: | 29.2 |
| Olive Branch: | 20.3% |
| Mississippi: | 20.5% |
| Olive Branch: | 9.1% |
| Mississippi: | 11.6% |
| This city: | 6.9 |
| Mississippi: | 6.7 |
| Here: | 32.9% |
| Mississippi: | 34.8% |
| Olive Branch: | 59.3% |
| State: | 54.9% |
| Here: | 81.0% |
| State: | 79.9% |
More about Health and Nutrition of Olive Branch, MS Residents
| Local government employment and payroll (March 2022) | |||||
| Function | Full-time employees | Monthly full-time payroll | Average yearly full-time wage | Part-time employees | Monthly part-time payroll |
|---|---|---|---|---|---|
| Firefighters | 123 | $618,133 | $60,306 | 1 | $536 |
| Police Protection - Officers | 86 | $496,219 | $69,240 | 0 | $0 |
| Water Supply | 34 | $148,060 | $52,256 | 0 | $0 |
| Financial Administration | 33 | $174,346 | $63,399 | 0 | $0 |
| Gas Supply | 32 | $122,939 | $46,102 | 0 | $0 |
| Other and Unallocable | 28 | $122,904 | $52,673 | 0 | $0 |
| Parks and Recreation | 23 | $83,731 | $43,686 | 32 | $5,407 |
| Streets and Highways | 17 | $72,343 | $51,066 | 0 | $0 |
| Sewerage | 16 | $67,529 | $50,647 | 0 | $0 |
| Judicial and Legal | 14 | $38,705 | $33,176 | 0 | $0 |
| Airports | 8 | $32,774 | $49,161 | 3 | $2,527 |
| Health | 5 | $16,607 | $39,857 | 0 | $0 |
| Police - Other | 5 | $18,833 | $45,199 | 12 | $7,199 |
| Fire - Other | 1 | $2,885 | $34,620 | 0 | $0 |
| Totals for Government | 425 | $2,016,009 | $56,923 | 48 | $15,668 |
Olive Branch government finances - Expenditure in 2021 (per resident):
- Construction - Regular Highways: $1,473,000 ($31.28)
General - Other: $674,000 ($14.31)
Water Utilities: $319,000 ($6.77)
Air Transportation: $223,000 ($4.74)
Gas Utilities: $190,000 ($4.04)
- Current Operations - Police Protection: $12,021,000 ($255.30)
Gas Utilities: $10,150,000 ($215.56)
Local Fire Protection: $7,382,000 ($156.78)
Sewerage: $7,017,000 ($149.03)
Water Utilities: $6,608,000 ($140.34)
Regular Highways: $4,908,000 ($104.23)
Financial Administration: $2,350,000 ($49.91)
Parks and Recreation: $2,333,000 ($49.55)
Air Transportation: $1,882,000 ($39.97)
General - Other: $1,700,000 ($36.10)
Health - Other: $1,217,000 ($25.85)
Central Staff Services: $783,000 ($16.63)
Judicial and Legal Services: $548,000 ($11.64)
General Public Buildings: $235,000 ($4.99)
- Gas Utilities - Interest on Debt: $42,000 ($0.89)
- General - Interest on Debt: $691,000 ($14.68)
- Water Utilities - Interest on Debt: $457,000 ($9.71)
Olive Branch government finances - Revenue in 2021 (per resident):
- Charges - Sewerage: $8,406,000 ($178.52)
Other: $5,039,000 ($107.02)
Air Transportation: $1,811,000 ($38.46)
Parks and Recreation: $111,000 ($2.36)
- Federal Intergovernmental - Air Transportation: $379,000 ($8.05)
- Miscellaneous - General Revenue - Other: $810,000 ($17.20)
Interest Earnings: $681,000 ($14.46)
Sale of Property: $41,000 ($0.87)
Rents: $10,000 ($0.21)
- Revenue - Gas Utilities: $11,866,000 ($252.01)
Water Utilities: $8,141,000 ($172.90)
- State Intergovernmental - General Local Government Support: $12,377,000 ($262.86)
Other: $1,626,000 ($34.53)
Highways: $1,473,000 ($31.28)
Health and Hospitals: $784,000 ($16.65)
- Tax - Property: $21,213,000 ($450.52)
Public Utilities Sales: $2,084,000 ($44.26)
Olive Branch government finances - Debt in 2021 (per resident):
- Long Term Debt - Beginning Outstanding - Unspecified Public Purpose: $42,692,000 ($906.68)
Outstanding Unspecified Public Purpose: $36,612,000 ($777.56)
Retired Unspecified Public Purpose: $9,145,000 ($194.22)
Issue, Unspecified Public Purpose: $3,065,000 ($65.09)
Olive Branch government finances - Cash and Securities in 2021 (per resident):
- Other Funds - Cash and Securities: $55,537,000 ($1179.48)
- Sinking Funds - Cash and Securities: $4,607,000 ($97.84)
| Businesses in Olive Branch, MS | ||||
| Name | Count | Name | Count | |
|---|---|---|---|---|
| AT&T | 1 | Kroger | 1 | |
| Applebee's | 1 | Lane Furniture | 2 | |
| AutoZone | 2 | Little Caesars Pizza | 1 | |
| Baskin-Robbins | 2 | Lowe's | 1 | |
| Best Western | 1 | Marriott | 1 | |
| Blockbuster | 1 | MasterBrand Cabinets | 3 | |
| Buffalo Wild Wings | 1 | McDonald's | 1 | |
| Burger King | 1 | Papa John's Pizza | 1 | |
| CVS | 2 | Payless | 1 | |
| Chevrolet | 1 | Penske | 2 | |
| Chick-Fil-A | 1 | Pizza Hut | 1 | |
| Circle K | 2 | Quiznos | 1 | |
| Comfort Inn | 1 | RadioShack | 1 | |
| Comfort Suites | 1 | SONIC Drive-In | 2 | |
| Cricket Wireless | 1 | Sprint Nextel | 1 | |
| Curves | 1 | Starbucks | 1 | |
| Decora Cabinetry | 1 | Subway | 4 | |
| Dennys | 1 | Super 8 | 1 | |
| Domino's Pizza | 1 | T-Mobile | 2 | |
| FedEx | 5 | Taco Bell | 1 | |
| Ford | 1 | Target | 1 | |
| GNC | 1 | The Room Place | 1 | |
| H&R Block | 1 | U-Haul | 4 | |
| Hilton | 1 | UPS | 6 | |
| Holiday Inn | 2 | Waffle House | 1 | |
| Home Depot | 1 | Walgreens | 2 | |
| Hyundai | 1 | Walmart | 1 | |
| IHOP | 1 | Wendy's | 2 | |
| KFC | 1 | YMCA | 1 | |
Strongest AM radio stations in Olive Branch:
- WCRV (640 AM; 50 kW; COLLIERVILLE, TN; Owner: BOTT BROADCASTING COMPANY/TENNESSEE)
- WGSF (1030 AM; 50 kW; MEMPHIS, TN; Owner: FLINN BROADCASTING CORPORATION)
- WMQM (1600 AM; 50 kW; LAKELAND, TN; Owner: WMQM, INC.)
- WPLX (1170 AM; 10 kW; GERMANTOWN, TN; Owner: EDUCATIONAL MEDIA FOUNDATION)
- WDIA (1070 AM; 50 kW; MEMPHIS, TN; Owner: CLEAR CHANNEL BROADCASTING LICENSES, INC.)
- WJCE (680 AM; 10 kW; MEMPHIS, TN; Owner: ENTERCOM MEMPHIS LICENSE, LLC)
- WOWW (1430 AM; 2 kW; GERMANTOWN, TN; Owner: FLINN BROADCASTING CORPORATION)
- WMC (790 AM; 5 kW; MEMPHIS, TN; Owner: INFINITY RADIO OPERATIONS INC.)
- KWAM (990 AM; 10 kW; MEMPHIS, TN; Owner: CONCORD MEDIA GROUP, INC.)
- WREC (600 AM; 5 kW; MEMPHIS, TN; Owner: CLEAR CHANNEL BROADCASTING LICENSES, INC.)
- WHBQ (560 AM; 5 kW; MEMPHIS, TN; Owner: FLINN BROADCASTING CORPORATION)
- WBBP (1480 AM; 5 kW; MEMPHIS, TN)
- WSAO (1140 AM; daytime; 5 kW; SENATOBIA, MS; Owner: JESSE C. ROSS AND ERNESTINE A. ROSS)
Strongest FM radio stations in Olive Branch:
- WMBZ (94.1 FM; GERMANTOWN, TN; Owner: ENTERCOM MEMPHIS LICENSE, LLC)
- WSRR-FM (98.1 FM; MILLINGTON, TN; Owner: KOOL BROADCASTING, INC.)
- WGKX (105.9 FM; MEMPHIS, TN; Owner: KIX BROADCASTING, INC.)
- WRVR-FM (104.5 FM; MEMPHIS, TN; Owner: ENTERCOM MEMPHIS LICENSE, LLC)
- WMC-FM (99.7 FM; MEMPHIS, TN; Owner: INFINITY RADIO OPERATIONS INC.)
- WKVF (94.9 FM; BYHALIA, MS; Owner: EDUCATIONAL MEDIA FOUNDATION)
- WKNO-FM (91.1 FM; MEMPHIS, TN; Owner: MID-SOUTH PUBLIC COMMUNICATIONS FOUNDATION)
- WEGR (102.7 FM; MEMPHIS, TN; Owner: CLEAR CHANNEL BROADCASTING LICENSES, INC.)
- WQOX (88.5 FM; MEMPHIS, TN; Owner: MEMPHIS CITY SCHOOLS)
- WEVL (89.9 FM; MEMPHIS, TN; Owner: SOUTHERN COMMUNICATION VOLUNTEERS, INC.)
- WUMR (91.7 FM; MEMPHIS, TN; Owner: THE UNIVERSITY OF MEMPHIS)
- WVIM-FM (95.3 FM; COLDWATER, MS; Owner: DESOTO COUNTY B/CING. CO.)
- KJMS (101.1 FM; MEMPHIS, TN; Owner: CLEAR CHANNEL BROADCASTING LICENSES, INC.)
- WMPS (107.5 FM; GERMANTOWN, TN; Owner: FLINN BROADCASTING CORPORATION)
- WHAL-FM (95.7 FM; OLIVE BRANCH, MS; Owner: CLEAR CHANNEL BROADCASTING LICENSES, INC.)
- WYPL (89.3 FM; MEMPHIS, TN; Owner: MEMPHIS/SHELBY COUNTY PUBLIC LIBRARY & INFO CNTR.)
- KXHT (107.1 FM; MARION, AR; Owner: FLINN BROADCASTING CORPORATION)
- WHRK (97.1 FM; MEMPHIS, TN; Owner: CLEAR CHANNEL BROADCASTING LICENSES, INC.)
- WMAV-FM (90.3 FM; OXFORD, MS; Owner: MISSISSIPPI AUTHORITY FOR EDUCATIONAL TV)
- WRBO (103.5 FM; COMO, MS; Owner: MEMPHIS III LIMITED PARTNERSHIP)
TV broadcast stations around Olive Branch:
- WREG-TV (Channel 3; MEMPHIS, TN; Owner: NEW YORK TIMES MANAGEMENT SERVICES)
- WKNO (Channel 10; MEMPHIS, TN; Owner: MID-SOUTH PUBLIC COMMUNICATIONS FOUNDATION)
- WBUY (Channel 40; HOLLY SPRINGS, MS; Owner: TRINITY BROADCASTING NETWORK)
- WHBQ-TV (Channel 13; MEMPHIS, TN; Owner: FOX TELEVISION STATIONS, INC.)
- WMC-TV (Channel 5; MEMPHIS, TN; Owner: RAYCOM AMERICA, INC.)
- WPXX-TV (Channel 50; MEMPHIS, TN; Owner: FLINN BROADCASTING CORPORATION)
- WLMT (Channel 30; MEMPHIS, TN; Owner: CLEAR CHANNEL BROADCASTING LICENSES, INC.)
- WPTY-TV (Channel 24; MEMPHIS, TN; Owner: CLEAR CHANNEL BROADCASTING LICENSES, INC.)
- W57CG (Channel 57; MEMPHIS, TN; Owner: GEORGE S. FLINN, JR.)
- WBXP-CA (Channel 44; MEMPHIS, TN; Owner: THE BOX WORLDWIDE LLC)
- W67CV (Channel 67; MEMPHIS, TN; Owner: GEORGE S. FLINN, JR.)
- W42BY (Channel 42; MEMPHIS, TN; Owner: THREE ANGELS BROADCASTING NETWORK, INC,)
- W61BP (Channel 61; MEMPHIS, TN; Owner: JIMMY BOYD)
- WMAV-TV (Channel 18; OXFORD, MS; Owner: MISSISSIPPI AUTHORITY FOR EDUCATIONAL TELEVISION)
- WJRJ-LP (Channel 59; MEMPHIS, TN; Owner: WORD OF GOD FELLOWSHIP, INC.)
- National Bridge Inventory (NBI) Statistics
- 70Number of bridges
- 1,903ft / 580mTotal length
- $2,318,577,000Total costs
- 823,665Total average daily traffic
- 123,798Total average daily truck traffic
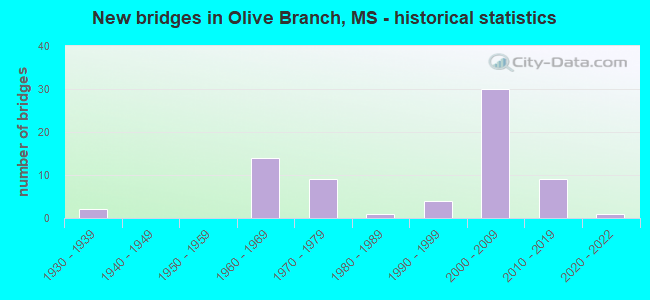
- New bridges - historical statistics
- 21930-1939
- 141960-1969
- 91970-1979
- 11980-1989
- 41990-1999
- 302000-2009
- 92010-2019
- 12020-2022
FCC Registered Antenna Towers: 236 (See the full list of FCC Registered Antenna Towers)
FCC Registered Broadcast Land Mobile Towers: 44 (See the full list of FCC Registered Broadcast Land Mobile Towers in Olive Branch, MS)
FCC Registered Microwave Towers: 24 (See the full list of FCC Registered Microwave Towers in this town)
FCC Registered Maritime Coast & Aviation Ground Towers: 5 (See the full list of FCC Registered Maritime Coast & Aviation Ground Towers)
FCC Registered Amateur Radio Licenses: 196 (See the full list of FCC Registered Amateur Radio Licenses in Olive Branch)
FAA Registered Aircraft: 72 (See the full list of FAA Registered Aircraft in Olive Branch)
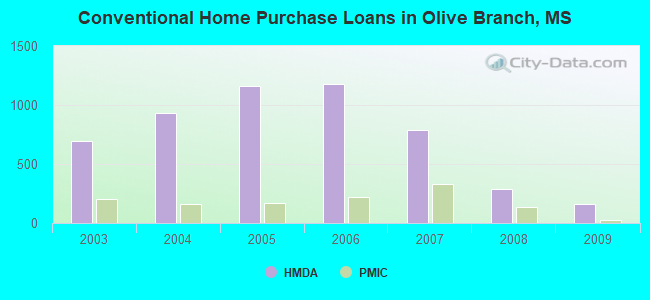
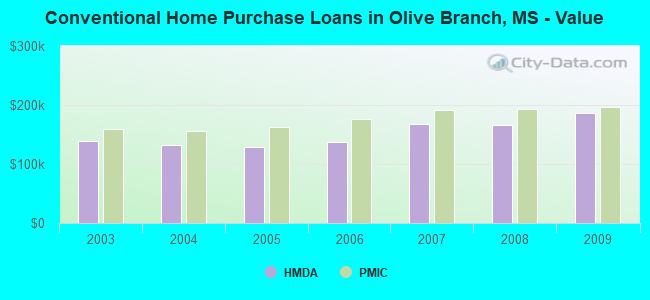
| Home Mortgage Disclosure Act Aggregated Statistics For Year 2009 (Based on 3 full and 4 partial tracts) | ||||||||||||||
| A) FHA, FSA/RHS & VA Home Purchase Loans | B) Conventional Home Purchase Loans | C) Refinancings | D) Home Improvement Loans | E) Loans on Dwellings For 5+ Families | F) Non-occupant Loans on < 5 Family Dwellings (A B C & D) | G) Loans On Manufactured Home Dwelling (A B C & D) | ||||||||
|---|---|---|---|---|---|---|---|---|---|---|---|---|---|---|
| Number | Average Value | Number | Average Value | Number | Average Value | Number | Average Value | Number | Average Value | Number | Average Value | Number | Average Value | |
| LOANS ORIGINATED | 359 | $149,688 | 157 | $186,460 | 653 | $162,401 | 37 | $44,440 | 1 | $7,850,000 | 100 | $230,717 | 1 | $5,550 |
| APPLICATIONS APPROVED, NOT ACCEPTED | 9 | $160,942 | 6 | $153,118 | 66 | $171,193 | 3 | $19,340 | 0 | $0 | 2 | $66,215 | 2 | $103,500 |
| APPLICATIONS DENIED | 47 | $152,676 | 15 | $151,303 | 259 | $173,261 | 19 | $48,116 | 0 | $0 | 11 | $87,699 | 0 | $0 |
| APPLICATIONS WITHDRAWN | 29 | $159,341 | 13 | $155,437 | 169 | $155,575 | 4 | $82,532 | 0 | $0 | 7 | $105,001 | 0 | $0 |
| FILES CLOSED FOR INCOMPLETENESS | 4 | $184,592 | 3 | $181,787 | 55 | $164,044 | 3 | $118,333 | 0 | $0 | 3 | $81,667 | 0 | $0 |
Detailed HMDA statistics for the following Tracts: 0705.20 , 0706.20, 0707.10, 0707.20, 0708.10, 0708.20, 0708.30
| Private Mortgage Insurance Companies Aggregated Statistics For Year 2009 (Based on 3 full and 4 partial tracts) | ||||||
| A) Conventional Home Purchase Loans | B) Refinancings | C) Non-occupant Loans on < 5 Family Dwellings (A & B) | ||||
|---|---|---|---|---|---|---|
| Number | Average Value | Number | Average Value | Number | Average Value | |
| LOANS ORIGINATED | 24 | $196,541 | 31 | $167,410 | 1 | $160,250 |
| APPLICATIONS APPROVED, NOT ACCEPTED | 11 | $161,290 | 15 | $205,629 | 0 | $0 |
| APPLICATIONS DENIED | 7 | $223,651 | 5 | $150,268 | 0 | $0 |
| APPLICATIONS WITHDRAWN | 1 | $188,110 | 1 | $218,050 | 0 | $0 |
| FILES CLOSED FOR INCOMPLETENESS | 1 | $190,350 | 2 | $134,655 | 0 | $0 |
Detailed PMIC statistics for the following Tracts: 0705.20 , 0706.20, 0707.10, 0707.20, 0708.10, 0708.20, 0708.30
2002 - 2018 National Fire Incident Reporting System (NFIRS) incidents
- Fire incident types reported to NFIRS in Olive Branch, MS
- 1,60445.4%Outside Fires
- 1,27836.2%Structure Fires
- 59516.8%Mobile Property/Vehicle Fires
- 571.6%Other
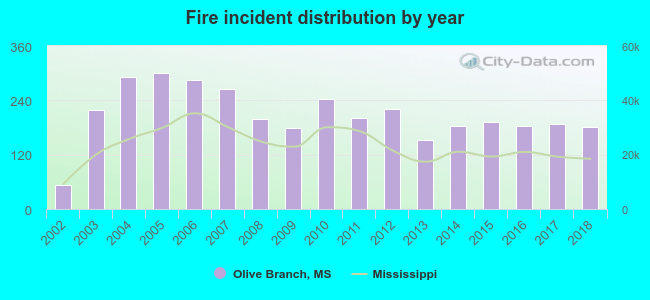 Based on the data from the years 2002 - 2018 the average number of fire incidents per year is 208. The highest number of fire incidents - 300 took place in 2005, and the least - 53 in 2002. The data has a rising trend.
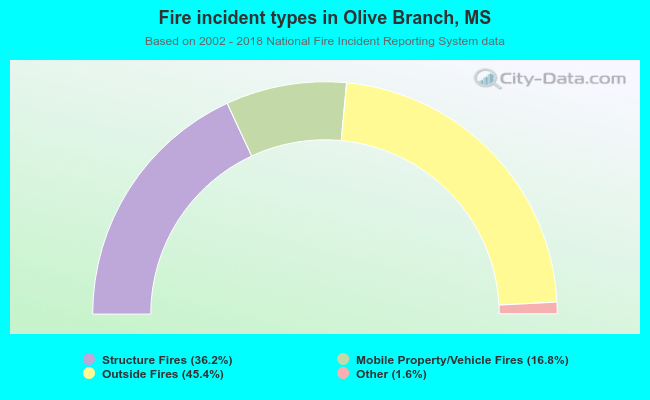 When looking into fire subcategories, the most reports belonged to: Outside Fires (45.4%), and Structure Fires (36.2%).
Fire-safe hotels and motels in Olive Branch, Mississippi:
- Comfort Inn, 7049 Enterprise Dr, Olive Branch, Mississippi 38654 , Phone: (662) 895-0456, Fax: (662) 895-9555
- Hampton Inn, 6830crumpler Blvd, Olive Branch, Mississippi 38654 , Phone: (662) 893-7600, Fax: (662) 893-3799
- Whispering Woods Hotel And Conference Center, 7300 Hacks Cross Rd, Olive Branch, Mississippi 38654 , Phone: (662) 895-2941, Fax: (662) 895-1590
- Candlewood Suites Olive Branch Mississippi, 7448craft Goodman Rd, Olive Branch, Mississippi 38654 , Phone: (667) 890-7491, Fax: (662) 890-7086
- Best Western Olive Branch, 10915 Business Center Dr, Olive Branch, Mississippi 38654 , Phone: (662) 892-2680, Fax: (662) 892-2681
- Comfort Suites Olive Branch, 6921 Parkwood Dr, Olive Branch, Mississippi 38654 , Phone: (662) 892-4445, Fax: (662) 892-4447
- Super 8 Motel, 11064 Business Center Dr, Olive Branch, Mississippi 38654 , Phone: (662) 893-8930, Fax: (662) 893-8950
- Fairfield Inn & Suites Memphis/Olive Branch, 7044 Hacks Cross Rd, Olive branch, Mississippi 38654 , Phone: (662) 892-4469, Fax: (662) 892-4470
- Home 2 Suites Olive Branch, 7595 Lodging Lane Dr, Olive branch, Mississippi 38654 , Phone: (662) 892-8234
| Most common first names in Olive Branch, MS among deceased individuals | ||
| Name | Count | Lived (average) |
|---|---|---|
| James | 119 | 71.9 years |
| Mary | 89 | 78.4 years |
| William | 82 | 72.0 years |
| Robert | 72 | 70.2 years |
| John | 69 | 74.7 years |
| Thomas | 41 | 72.7 years |
| Charles | 39 | 69.6 years |
| Willie | 36 | 76.4 years |
| George | 33 | 71.0 years |
| Annie | 28 | 81.4 years |
| Most common last names in Olive Branch, MS among deceased individuals | ||
| Last name | Count | Lived (average) |
|---|---|---|
| Smith | 48 | 74.5 years |
| Johnson | 42 | 74.4 years |
| Williams | 42 | 73.2 years |
| Jones | 40 | 74.7 years |
| Brown | 38 | 71.0 years |
| Woods | 29 | 78.5 years |
| Moore | 28 | 79.4 years |
| Stewart | 27 | 73.3 years |
| Davis | 26 | 78.1 years |
| White | 22 | 71.3 years |
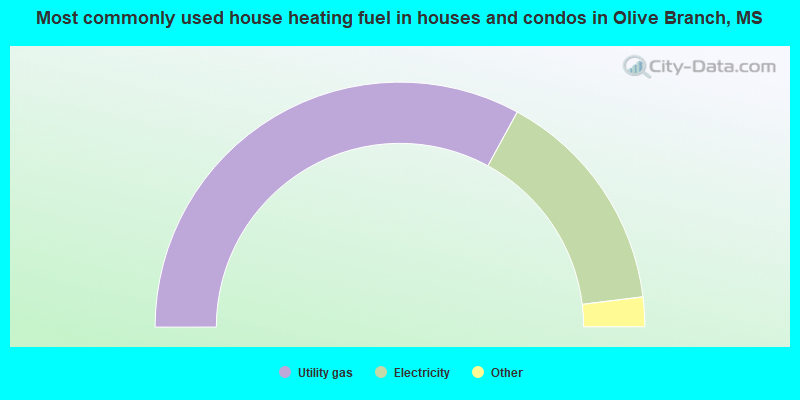
- 65.9%Utility gas
- 30.2%Electricity
- 3.5%Bottled, tank, or LP gas
- 0.2%Wood
- 0.2%No fuel used
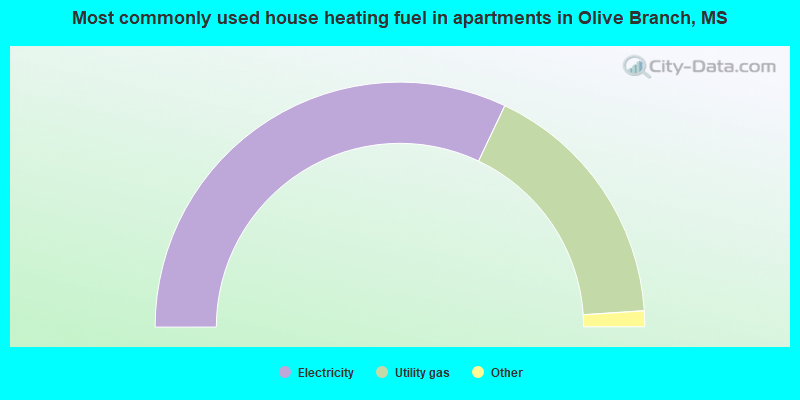
- 64.1%Electricity
- 33.8%Utility gas
- 0.9%Solar energy
- 0.8%Bottled, tank, or LP gas
- 0.3%Coal or coke
Olive Branch compared to Mississippi state average:
- Median household income above state average.
- Median house value above state average.
- Unemployed percentage significantly below state average.
- Black race population percentage above state average.
- Hispanic race population percentage significantly above state average.
- Foreign-born population percentage significantly above state average.
- Renting percentage below state average.
- House age significantly below state average.
- Number of college students above state average.
- Percentage of population with a bachelor's degree or higher above state average.
Olive Branch on our top lists:
- #31 on the list of "Top 101 cities with the smallest racial income disparities between White and Black householders (with at least 2,000 householders)"
- #98 on the list of "Top 101 cities with the most people born in other U.S. states (population 5,000+)"
- #28 on the list of "Top 101 counties with the lowest percentage of residents that exercised in the past month"
- #48 on the list of "Top 101 counties with the lowest percentage of residents that visited a dentist within the past year"
- #58 on the list of "Top 101 counties with the lowest percentage of residents relocating from foreign countries between 2010 and 2011"
- #60 on the list of "Top 101 counties with the largest decrease in the number of births per 1000 residents 2000-2006 to 2007-2013 (pop 50,000+)"
- #64 on the list of "Top 101 counties with the largest number of people moving in compared to moving out (pop. 50,000+)"

|
|
Total of 222 patent applications in 2008-2024.