Estimated zip code population in 2022: 26,916 Zip code population in 2010: 26,125 Zip code population in 2000: 25,180
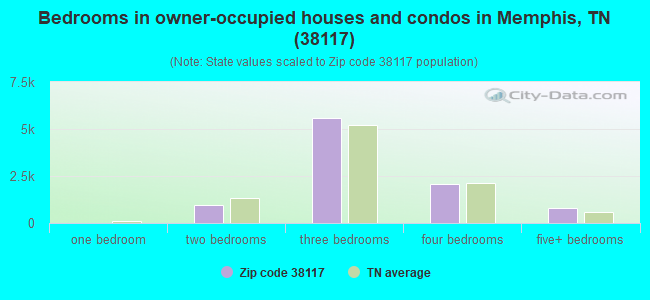
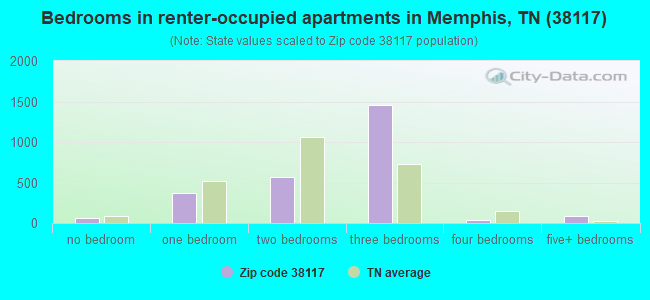
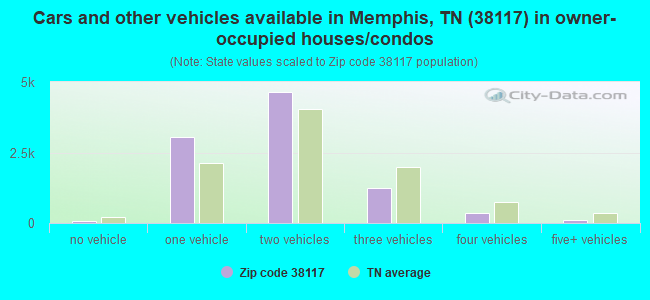
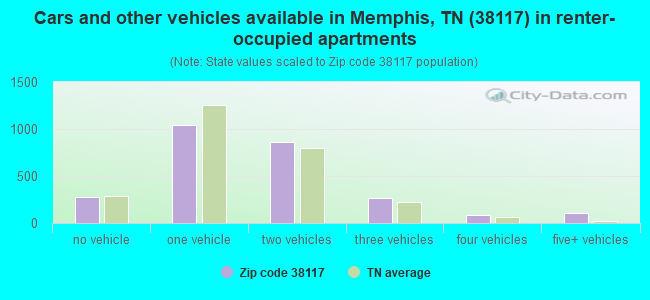
Houses and condos: 12,593 Renter-occupied apartments: 2,631
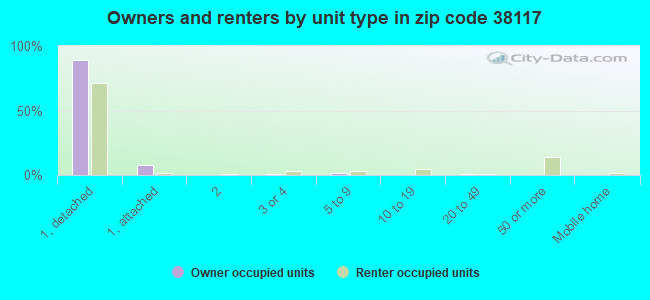
% of renters here:
22%
State:
33%
March 2022 cost of living index in zip code 38117: 86.5 (less than average, U.S. average is 100)
Land area: 9.3 sq. mi. Water area: 0.0 sq. mi.
Population density: 2,880 people per square mile
(average).
OSM Map
General Map
Google Map
MSN Map
OSM Map
General Map
Google Map
MSN Map
OSM Map
General Map
Google Map
MSN Map
OSM Map
General Map
Google Map
MSN Map
Please wait while loading the map...
Real estate property taxes paid for housing units in 2022:
This zip code:
1.2% ($3,876)
Tennessee:
0.5% ($1,376)
Median real estate property taxes paid for housing units with mortgages in 2022: $3,799 (1.2%) Median real estate property taxes paid for housing units with no mortgage in 2022: $3,946 (1.2%)
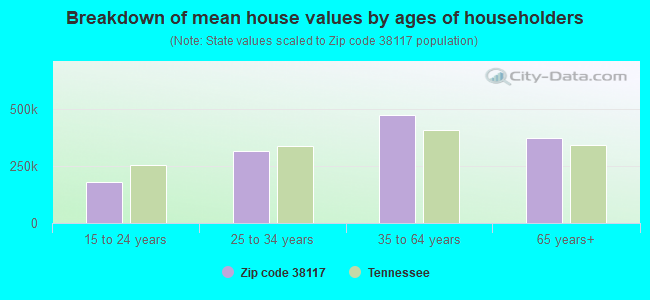
Estimated median house/condo value in 2022: $322,839
38117:
$322,839
Tennessee:
$284,800
According to our research of Tennessee and other state lists, there were 23 registered sex offenders living in 38117 zip code as of April 27, 2024. The ratio of all residents to sex offenders in zip code 38117 is 1,156 to 1. The ratio of registered sex offenders to all residents in this zip code is much lower than the state average.
Median resident age:
This zip code:
40.8 years
Tennessee median age:
39.2 years
Average household size:
This zip code:
2.2 people
Tennessee:
2.4 people
Averages for the 2020 tax year for zip code 38117, filed in 2021:
Average Adjusted Gross Income (AGI) in 2020: $148,221 (Individual Income Tax Returns)
Here:
$148,221
State:
$69,014
Salary/wage: $102,559 (reported on 78.5% of returns)
Here:
$102,559
State:
$55,872
(% of AGI for various income ranges: 1173.4% for AGIs below $25k, 3874.6% for AGIs $25k-50k, 6890.3% for AGIs $50k-75k, 10204.4% for AGIs $75k-100k, 18064.9% for AGIs $100k-200k, 111077.6% for AGIs over 200k)
Taxable interest for individuals: $5,480 (reported on 39.5% of returns)
This zip code:
$5,480
Tennessee:
$1,945
(% of AGI for various income ranges: 18.9% for AGIs below $25k, 24.3% for AGIs $25k-50k, 58.0% for AGIs $50k-75k, 121.3% for AGIs $75k-100k, 215.8% for AGIs $100k-200k, 4450.0% for AGIs over 200k)
Ordinary dividends: $18,198 (reported on 33.6% of returns)
Here:
$18,198
State:
$8,105
(% of AGI for various income ranges: 77.0% for AGIs below $25k, 93.1% for AGIs $25k-50k, 183.7% for AGIs $50k-75k, 401.7% for AGIs $75k-100k, 1037.7% for AGIs $100k-200k, 11390.9% for AGIs over 200k)
Net capital gain/loss in AGI: +$91,983 (reported on 30.5% of returns)
Here:
+$91,983
State:
+$33,664
(% of AGI for various income ranges: 39.5% for AGIs below $25k, 74.0% for AGIs $25k-50k, 140.1% for AGIs $50k-75k, 304.9% for AGIs $75k-100k, 972.7% for AGIs $100k-200k, 66666.7% for AGIs over 200k)
Profit/loss from business: +$31,285 (reported on 20.4% of returns)
Here:
+$31,285
State:
+$18,991
(% of AGI for various income ranges: 143.2% for AGIs below $25k, 113.6% for AGIs $25k-50k, 322.2% for AGIs $50k-75k, 442.5% for AGIs $75k-100k, 1218.2% for AGIs $100k-200k, 10900.4% for AGIs over 200k)
Taxable individual retirement arrangement distribution: $26,870 (reported on 10.8% of returns)
38117:
$26,870
Tennessee:
$20,036
(% of AGI for various income ranges: 64.1% for AGIs below $25k, 105.4% for AGIs $25k-50k, 191.1% for AGIs $50k-75k, 370.3% for AGIs $75k-100k, 942.9% for AGIs $100k-200k, 3594.0% for AGIs over 200k)
Self-employed (Keogh) retirement plans: $30,497 (reported on 2.3% of returns)
38117:
$30,497
Tennessee:
$28,955
(% of AGI for various income ranges: 20.0% for AGIs $50k-75k, 86.5% for AGIs $100k-200k, 1544.7% for AGIs over 200k)
Total itemized deductions: $55,287 (reported on 14.8% of returns)
Here:
$55,287
State:
$40,136
(% of AGI for various income ranges: 83.3% for AGIs below $25k, 161.0% for AGIs $25k-50k, 323.5% for AGIs $50k-75k, 635.2% for AGIs $75k-100k, 1344.0% for AGIs $100k-200k, 14929.3% for AGIs over 200k)
Charity contributions: $32,423 (reported on 13.4% of returns)
Here:
$32,423
State:
$19,852
(% of AGI for various income ranges: 8.5% for AGIs below $25k, 30.8% for AGIs $25k-50k, 76.9% for AGIs $50k-75k, 196.6% for AGIs $75k-100k, 446.7% for AGIs $100k-200k, 9241.8% for AGIs over 200k)
Taxes paid: $7,835 (reported on 14.7% of returns)
38117:
$7,835
State:
$6,038
(% of AGI for various income ranges: 14.0% for AGIs below $25k, 27.7% for AGIs $25k-50k, 65.9% for AGIs $50k-75k, 134.2% for AGIs $75k-100k, 283.9% for AGIs $100k-200k, 1753.3% for AGIs over 200k)
Earned income credit: $2,157 (reported on 10.5% of returns)
Here:
$2,157
State:
$2,391
(% of AGI for various income ranges: 86.4% for AGIs below $25k, 47.8% for AGIs $25k-50k, 0.7% for AGIs $50k-75k)
Percentage of individuals using paid preparers for their 2020 taxes: 91.9%
Here:
92%
State:
93%
(% for various income ranges: 89.7% for AGIs below $25k, 91.9% for AGIs $25k-50k, 91.3% for AGIs $50k-75k, 92.1% for AGIs $75k-100k, 93.4% for AGIs $100k-200k, 95.0% for AGIs over 200k)
Averages for the 2012 tax year for zip code 38117, filed in 2013:
Average Adjusted Gross Income (AGI) in 2012: $114,724 (Individual Income Tax Returns)
Here:
$114,724
State:
$53,767
Salary/wage: $85,761 (reported on 78.3% of returns)
Here:
$85,761
State:
$45,421
(% of AGI for various income ranges: 70.9% for AGIs below $25k, 77.3% for AGIs $25k-50k, 75.2% for AGIs $50k-75k, 72.0% for AGIs $75k-100k, 69.0% for AGIs $100k-200k, 49.3% for AGIs over 200k)
Taxable interest for individuals: $4,699 (reported on 40.3% of returns)
This zip code:
$4,699
Tennessee:
$1,732
(% of AGI for various income ranges: 2.0% for AGIs below $25k, 1.0% for AGIs $25k-50k, 1.0% for AGIs $50k-75k, 1.3% for AGIs $75k-100k, 1.0% for AGIs $100k-200k, 2.0% for AGIs over 200k)
Ordinary dividends: $16,066 (reported on 32.8% of returns)
Here:
$16,066
State:
$6,739
(% of AGI for various income ranges: 4.5% for AGIs below $25k, 2.2% for AGIs $25k-50k, 2.6% for AGIs $50k-75k, 3.2% for AGIs $75k-100k, 4.0% for AGIs $100k-200k, 5.5% for AGIs over 200k)
Net capital gain/loss in AGI: +$48,885 (reported on 27.5% of returns)
Here:
+$48,885
State:
+$19,082
(% of AGI for various income ranges: 0.3% for AGIs below $25k, 0.4% for AGIs $25k-50k, 0.7% for AGIs $50k-75k, 1.0% for AGIs $75k-100k, 3.0% for AGIs $100k-200k, 18.5% for AGIs over 200k)
Profit/loss from business: +$27,707 (reported on 18.5% of returns)
Here:
+$27,707
State:
+$15,240
(% of AGI for various income ranges: 7.3% for AGIs below $25k, 3.0% for AGIs $25k-50k, 3.5% for AGIs $50k-75k, 3.8% for AGIs $75k-100k, 6.2% for AGIs $100k-200k, 4.2% for AGIs over 200k)
Taxable individual retirement arrangement distribution: $25,183 (reported on 13.6% of returns)
38117:
$25,183
Tennessee:
$15,505
(% of AGI for various income ranges: 4.4% for AGIs below $25k, 2.8% for AGIs $25k-50k, 2.8% for AGIs $50k-75k, 3.6% for AGIs $75k-100k, 4.1% for AGIs $100k-200k, 2.6% for AGIs over 200k)
Self-employment retirement plans: $26,650 (reported on 1.9% of returns)
38117:
$26,650
Tennessee:
$22,567
(% of AGI for various income ranges: 0.3% for AGIs $50k-75k, 0.4% for AGIs $100k-200k, 0.6% for AGIs over 200k)
Total itemized deductions: $32,475 (15% of AGI, reported on 42.9% of returns)
Here:
$32,475
State:
$21,976
Here:
14.8% of AGI
State:
17.8% of AGI
(% of AGI for various income ranges: 13.7% for AGIs below $25k, 12.9% for AGIs $25k-50k, 13.5% for AGIs $50k-75k, 14.1% for AGIs $75k-100k, 13.8% for AGIs $100k-200k, 11.2% for AGIs over 200k)
Charity contributions: $12,129 (reported on 37.7% of returns)
Here:
$12,129
State:
$6,709
(% of AGI for various income ranges: 1.7% for AGIs below $25k, 1.9% for AGIs $25k-50k, 2.5% for AGIs $50k-75k, 2.8% for AGIs $75k-100k, 3.3% for AGIs $100k-200k, 4.9% for AGIs over 200k)
Taxes paid: $9,184 (reported on 42.4% of returns)
38117:
$9,184
State:
$4,829
(% of AGI for various income ranges: 3.2% for AGIs below $25k, 3.2% for AGIs $25k-50k, 3.7% for AGIs $50k-75k, 4.0% for AGIs $75k-100k, 4.5% for AGIs $100k-200k, 3.0% for AGIs over 200k)
Earned income credit: $2,270 (reported on 12.0% of returns)
Here:
$2,270
State:
$2,404
(% of AGI for various income ranges: 5.6% for AGIs below $25k, 0.6% for AGIs $25k-50k)
Percentage of individuals using paid preparers for their 2012 taxes: 52.7%
Here:
53%
State:
52%
(% for various income ranges: 49.4% for AGIs below $25k, 46.0% for AGIs $25k-50k, 49.2% for AGIs $50k-75k, 51.2% for AGIs $75k-100k, 58.2% for AGIs $100k-200k, 78.9% for AGIs over 200k)
Averages for the 2004 tax year for zip code 38117, filed in 2005:
Average Adjusted Gross Income (AGI) in 2004: $91,866 (Individual Income Tax Returns)
Here:
$91,866
State:
$44,088
Salary/wage: $67,068 (reported on 74.1% of returns)
Here:
$67,068
State:
$38,825
(% of AGI for various income ranges: 612.6% for AGIs below $10k, 63.3% for AGIs $10k-25k, 74.4% for AGIs $25k-50k, 72.7% for AGIs $50k-75k, 69.5% for AGIs $75k-100k, 45.8% for AGIs over 100k)
Taxable interest for individuals: $5,750 (reported on 54.0% of returns)
This zip code:
$5,750
Tennessee:
$1,802
(% of AGI for various income ranges: 171.1% for AGIs below $10k, 4.8% for AGIs $10k-25k, 2.7% for AGIs $25k-50k, 2.3% for AGIs $50k-75k, 2.6% for AGIs $75k-100k, 3.4% for AGIs over 100k)
Taxable dividends: $13,781 (reported on 40.3% of returns)
Here:
$13,781
State:
$3,727
(% of AGI for various income ranges: 161.4% for AGIs below $10k, 4.0% for AGIs $10k-25k, 2.7% for AGIs $25k-50k, 3.3% for AGIs $50k-75k, 3.9% for AGIs $75k-100k, 7.0% for AGIs over 100k)
Net capital gain/loss: +$47,114 (reported on 34.6% of returns)
Here:
+$47,114
State:
+$15,776
(% of AGI for various income ranges: 135.4% for AGIs below $10k, 1.7% for AGIs $10k-25k, 0.8% for AGIs $25k-50k, 1.3% for AGIs $50k-75k, 2.8% for AGIs $75k-100k, 24.6% for AGIs over 100k)
Profit/loss from business: +$24,214 (reported on 17.7% of returns)
Here:
+$24,214
State:
+$12,882
(% of AGI for various income ranges: 53.0% for AGIs below $10k, 6.1% for AGIs $10k-25k, 3.3% for AGIs $25k-50k, 3.4% for AGIs $50k-75k, 4.8% for AGIs $75k-100k, 4.9% for AGIs over 100k)
IRA payment deduction: $3,068 (reported on 2.8% of returns)
38117:
$3,068
Tennessee:
$2,934
(% of AGI for various income ranges: 2.8% for AGIs below $10k, 0.3% for AGIs $10k-25k, 0.2% for AGIs $25k-50k, 0.2% for AGIs $50k-75k, 0.2% for AGIs $75k-100k, 0.0% for AGIs over 100k)
Self-employed pension: $18,003 (reported on 2.2% of returns)
Here:
$18,003
Tennessee:
$16,857
(% of AGI for various income ranges: 0.1% for AGIs $25k-50k, 0.2% for AGIs $50k-75k, 0.3% for AGIs $75k-100k, 0.6% for AGIs over 100k)
Total itemized deductions: $25,048 (16% of AGI, reported on 45.9% of returns)
Here:
$25,048
State:
$18,035
Here:
15.9% of AGI
State:
19.9% of AGI
(% of AGI for various income ranges: 198.8% for AGIs below $10k, 15.8% for AGIs $10k-25k, 15.0% for AGIs $25k-50k, 14.8% for AGIs $50k-75k, 16.3% for AGIs $75k-100k, 11.0% for AGIs over 100k)
Charity contributions deductions: $9,588 (6% of AGI, reported on 41.1% of returns)
Here:
$9,588
State:
$5,167
Here:
5.7% of AGI
State:
5.3% of AGI
(% of AGI for various income ranges: 13.0% for AGIs below $10k, 2.2% for AGIs $10k-25k, 2.4% for AGIs $25k-50k, 2.9% for AGIs $50k-75k, 3.6% for AGIs $75k-100k, 4.9% for AGIs over 100k)
Total tax: $20,169 (reported on 80.9% of returns)
38117:
$20,169
State:
$7,482
(% of AGI for various income ranges: 34.2% for AGIs below $10k, 4.4% for AGIs $10k-25k, 7.8% for AGIs $25k-50k, 10.6% for AGIs $50k-75k, 12.0% for AGIs $75k-100k, 21.4% for AGIs over 100k)
Earned income credit: $1,673 (reported on 9.2% of returns)
Here:
$1,673
State:
$1,826
Percentage of individuals using paid preparers for their 2004 taxes: 57.7%
Here:
58%
State:
60%
(% for various income ranges: 54.6% for AGIs below $10k, 56.4% for AGIs $10k-25k, 51.5% for AGIs $25k-50k, 54.5% for AGIs $50k-75k, 57.7% for AGIs $75k-100k, 73.1% for AGIs over 100k)
Likely homosexual households (counted as self-reported same-sex unmarried-partner households)
Lesbian couples: 0.1% of all households
Gay men: 0.2% of all households
Household received Food Stamps/SNAP in the past 12 months: 763 Household did not receive Food Stamps/SNAP in the past 12 months: 11,333
Women who had a birth in the past 12 months: 305 (257 now married, 51 unmarried) Women who did not have a birth in the past 12 months: 5,663 (2,491 now married, 3,172 unmarried)
Housing units in zip code 38117 with a mortgage: 5,678 (775 second mortgage, 19 home equity loan, 695 both second mortgage and home equity loan) Houses without a mortgage: 63
Median monthly owner costs for units with a mortgage: $1,649 Median monthly owner costs for units without a mortgage: $750
Residents with income below the poverty level in 2022:
This zip code:
8.3%
Whole state:
13.3%
Residents with income below 50% of the poverty level in 2022:
This zip code:
4.9%
Whole state:
7.1%
Median number of rooms in houses and condos:
Here:
7.1
State:
6.5
Median number of rooms in apartments:
Here:
5.3
State:
4.4
Notable locations in this zip code not listed on our city pages
Notable locations in zip code 38117: Colonial Country Club (A), Underwood United Methodist Preschool and Day Care Center (B), Saint Marys Episcopal School Library (C), Poplar-White Station Branch Memphis Public Library (D), City of Memphis Division of Fire Station 21 (E), Dixon Gallery and Gardens (F), City of Memphis Division of Fire Station 25 (G), Willow Road Park Community Center (H). Display/hide their locations on the map
Shopping Centers: Laurelwood Shopping Center (1), Eastgate Shopping Center (2), Davis Colonial Village Shopping Center (3), Audubon Place Shopping Center (4), Quince Station Shopping Center (5), Perkins Village Shopping Center (6), Williamsburg Village Shopping Center (7), White Station Plaza Shopping Center (8), Colonial Shopping Center (9). Display/hide their locations on the map
Churches in zip code 38117 include: Aldersgate United Methodist Church (A), All Saints Episcopal Church (B), Berean Baptist Church (C), Bethany Lutheran Church (D), Christ United Methodist Church (E), Church of the Holy Communion (F), Colonial Baptist Church (G), Evangel Baptist Church (H), First Church of Christ Science (I). Display/hide their locations on the map
Parks in zip code 38117 include: Godwin Park (1), Goldsmith Civic Garden Center (2), Willow Park (3), Audubon Park (4), Avon Park (5), Sea Isle Park (6), Pep Marquette Park (7). Display/hide their locations on the map
Tourist attractions (not listed on the city page) : Memphis Public Libraries & Information Center - Branch- Poplar-White Sta (Cultural Attractions- Events- & Facilities; 5094 Poplar Avenue), AAA Travel (5138 Park Avenue).
3,784 married couples with children.
1,253 single-parent households (278 men, 975 women).
93.5% of residents of 38117 zip code speak English at home.
4.0% of residents speak Spanish at home (48% very well, 30% well, 12% not well, 10% not at all).
0.9% of residents speak other Indo-European language at home (66% very well, 15% well, 19% not well).
1.6% of residents speak Asian or Pacific Island language at home (46% very well, 11% well, 19% not well, 25% not at all).
0.2% of residents speak other language at home (47% well, 53% not at all).
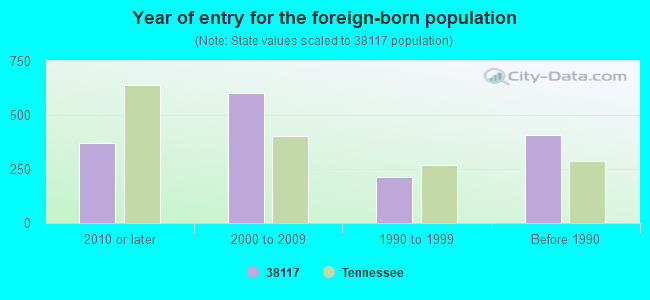
Foreign born population: 1,370 (5.1%) (47.0% of them are naturalized citizens)
Major facilities with environmental interests located in this zip code:
AVON - LENOX SCHOOL (310 NORTH AVON in MEMPHIS, TN)
(National Center for Education Statistics) - STATE ID-0025 Organizations: MEMPHIS CITY SCHOOL DISTRICT (SCHOOL DISTRICT)
COLONIAL MIDDLE SCHOOL (4778 SEA ISLE RD in MEMPHIS, TN)
(National Center for Education Statistics) - STATE ID-0115 Organizations: MEMPHIS CITY SCHOOL DISTRICT (SCHOOL DISTRICT)
ADT 90 (680 OAKLEAF OFFICE LANE in MEMPHIS, TN)
(Integrated Compliance Information System) - ICIS-HQ-2002-6000, FORMAL ENFORCEMENT ACTION
CAVALIER CLEANERS (4904 POPLAR AVENUE in MEMPHIS, TN)
AIR MINOR (AIRS/AFS) CRITERIA AND HAZARDOUS AIR POLLUTANT INVENTORY (Inventory of air pollution sources) (Resource Conservation and Recovery Act (tracking hazardous waste)) Business SIC classification: DRYCLEANING PLANTS, EXCEPT RUG CLEANING
CHOCTAW READY MIX CONCRETE PT. (751 E. BROOKHAVEN CIRCLE in MEMPHIS, TN)
National Pollutant Discharge Elimination System NON-MAJOR (Tracking pollutant discharge elimination systems) - permit Business SIC classification: READY-MIXED CONCRETE Organizations: WILLIAM CARRIER (CONTACT/OWNER)
Alternative names: CHOCTAW II
ADVANCE CONSTRUCTION SPECIALTIES COMPANY (4075 NEW GETWELL ROAD in MEMPHIS, TN)
(Resource Conservation and Recovery Act (tracking hazardous waste))
ALLIED PEST CONTROL (4990 POPLAR AVE, SUITE 220 in MEMPHIS, TN)
(Resource Conservation and Recovery Act (tracking hazardous waste))
ALLSTATE FABRICATING COMPANY (5384 POPLAR AVENUE SUITE 500 in MEMPHIS, TN)
(Resource Conservation and Recovery Act (tracking hazardous waste)) Business NAICS classification: FABRICATED PIPE AND PIPE FITTING MANUFACTURING.
AMOCO OIL SS# 2486 (5091 PARK & WILBEC in MEMPHIS, TN)
(Resource Conservation and Recovery Act (tracking hazardous waste)) Business NAICS classification: OTHER FUEL DEALERS.; ALL OTHER AUTOMOTIVE REPAIR AND MAINTENANCE.
ASSOCIATIONS PUBLICATIONS INC (726 MT MORIAH ROAD ST 106 in MEMPHIS, TN)
(Resource Conservation and Recovery Act (tracking hazardous waste))
(Resource Conservation and Recovery Act (tracking hazardous waste))
BUFFALO FORGE CO (732 MT MORIAH RD in MEMPHIS, TN)
(Resource Conservation and Recovery Act (tracking hazardous waste))
CROPPER STEVEN INTERPRISES (5177 ANGELA SOUTH in MEMPHIS, TN)
(Resource Conservation and Recovery Act (tracking hazardous waste))
Housing units lacking complete plumbing facilities: 0.6% Housing units lacking complete kitchen facilities: 1.0%
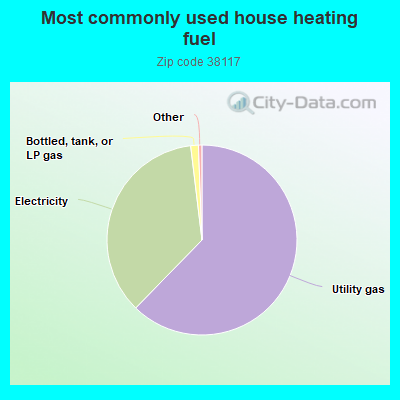
62.3%Utility gas
35.8%Electricity
1.3%Bottled, tank, or LP gas
Population in 1990: 27,149.
Place of birth for U.S.-born residents:
This state: 16,215
Northeast: 912
Midwest: 1,897
South: 5,450
West: 721
63% of the 38117 zip code residents lived in the same house 5 years ago. Out of people who lived in different houses, 75% lived in this county. Out of people who lived in different counties, 50% lived in Tennessee.
90% of the 38117 zip code residents lived in the same house 1 year ago. Out of people who lived in different houses, 67% moved from this county. Out of people who lived in different houses, 4% moved from different county within same state. Out of people who lived in different houses, 24% moved from different state. Out of people who lived in different houses, 3% moved from abroad.
Private vs. public school enrollment:
Students in private schools in grades 1 to 8 (elementary and middle school): 857
Here:
44.2%
Tennessee:
15.0%
Students in private schools in grades 9 to 12 (high school): 620
Here:
52.4%
Tennessee:
16.2%
Students in private undergraduate colleges: 316
Here:
34.3%
Tennessee:
23.5%
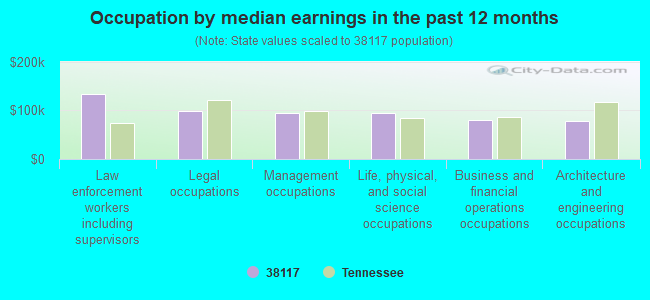
Occupation by median earnings in the past 12 months ($)
134,269Law enforcement workers including supervisors
98,761Legal occupations
95,227Management occupations
94,328Life, physical, and social science occupations
79,408Business and financial operations occupations
79,100Architecture and engineering occupations
Companies with federal contracts located in this zip code (MEMPHIS, TN):
PT PLUS INC (1760 MORIAH WOODS BLVD; small business) : $614,180 in 5 contractsfrom 2002 to 2003
Contracts for Miscellaneous Electrical and Electronic Components, Electrical Hardware and Supplies, ADP Support Equipment, ADP Components by Indian Affairs (Assistant Secretary), Navy, Air Force, Army, and others Signed by year:2000: $0; 2001: $0; 2002: $127,008; 2003: $487,172; 2004: $0; 2005: $0; 2006: $0.
Biggest contracts:
$399,867 with Indian Affairs (Assistant Secretary) for Miscellaneous Electrical and Electronic Components. Signed on 2003-07-15. Completion date: 2003-08-15.
$101,111 with Navy for Electrical Hardware and Supplies. Signed on 2002-09-23. Completion date: 2002-10-30.
$46,922 with Air Force for ADP Support Equipment. Signed on 2003-06-24. Completion date: 2003-07-08.
$40,383 with Navy for ADP Components. Signed on 2003-02-28. Completion date: 2003-03-25.
JAMES C ASHLEY ASSOCIATES (678 MAGNOLIA MANOR CIRCLE; small business)
$377,000 with Navy for Maintenance, Repair or Alteration of Real Property -- Religious Facilities. Signed on 2003-09-15. Completion date: 2004-01-16.
NOVA ENVIRONMENTAL CORPORATION (4783 EAGLE CREST DRIVE SUI; small business) : $225,594 in 8 contractsfrom 2000 to 2006
Contracts for Hazardous Substance Removal, Cleanup, and Disposal Services and Operational Support, Miscellaneous Items, Solid Fuel Handling Services by Navy Signed by year:2000: $139,730; 2001: $0; 2002: $0; 2003: $53,172; 2004: $4,200; 2005: $21,092; 2006: $7,400.
Biggest contracts:
$139,730 with Navy for Hazardous Substance Removal, Cleanup, and Disposal Services and Operational Support. Signed on 2000-03-30. Completion date: 2001-04-30.
$53,172, same as above.Signed on 2003-07-23. Completion date: 2003-09-05.
$13,692 with Navy for Miscellaneous Items. Signed on 2005-05-18. Completion date: 2005-06-28.
$4,700 with Navy for Solid Fuel Handling Services. Signed on 2006-02-14. Completion date: 2006-03-16.
COMMERCIAL & MILITARY COMPUTER (560 COLONIAL ROAD; small business) : $216,015 in 8 contractsfrom 2000 to 2003
Contracts for ADP Backup and Security Services, ADPE System Configuration, ADP Components, ADP Software, and moreby Navy, Army, Defense Logistics Agency, U.S. Army Corps of Engineers - civil program financing only, and others Signed by year:2000: $176,585; 2001: $39,470; 2002: $0; 2003: -$40; 2004: $0; 2005: $0; 2006: $0.
Biggest contracts:
$75,880 with Navy for ADP Backup and Security Services. Signed on 2000-03-06. Completion date: 2000-04-07.
$41,305 with Army for ADPE System Configuration. Taking place in NJ. Signed on 2000-02-18. Completion date: 2000-03-31.
$31,500 with Army for ADP Components. Signed on 2000-09-13. Completion date: 2000-10-31.
$28,717 with Army for ADP Software. Taking place in NC. Signed on 2001-09-04. Completion date: 2001-10-01.
THE F FOUR CORPORATION (4988 WILLIAM ARNOLD RD; small business) : $139,758 in 2 contractsfrom 2000 to 2002
$133,212 with U.S. Army Corps of Engineers - civil program financing only for Construction of Structures and Facilities -- Other Non-Building Facilities. Taking place in LA. Signed on 2000-03-16. Completion date: 1997-07-29.
$6,546, same as above.Signed on 2002-08-28. Completion date: 2002-08-30.
PEABODY HOTEL GROUP (5118 PARK AVE STE 245; small business) : $107,664 in 4 contractsfrom 2004 to 2005
$89,460 with Army for Lodging - Hotel/Motel. Taking place in AR. Signed on 2005-05-05. Completion date: 2005-05-14.
$6,954 with Army for Lodging - Hotel/Motel. Signed on 2004-08-12. Completion date: 2004-08-26.
$5,625 with Army for Other Professional Services. Signed on 2004-06-08. Completion date: 2004-07-13.
$5,625 with U.S. Army Corps of Engineers - civil program financing only for Other Professional Services. Signed on 2004-06-08. Completion date: 2004-07-13.
FEREBEE, DAVID (5064 WELCHSHIRE AVE; small business) : $62,539 in 2 contractsin 2003
$62,539 with Navy for Other Medical Services. Taking place in MD. Signed on 2003-10-01. Completion date: 2004-04-30.
$0, same as above.Signed on 2003-10-01. Completion date: 2004-04-30.
COOPER & ASSOCIATES, INC (1865 MYRNA LANE; small business) : $41,725 in 4 contractsfrom 2002 to 2003
$24,924 with Army for Hazardous Substance Removal, Cleanup, and Disposal Services and Operational Support. Signed on 2002-02-28. Completion date: 2002-12-31.
$17,068 with Army for Other Management Support Services. Taking place in AL. Signed on 2002-04-19. Completion date: 2002-12-31.
$0 with Army for Public Relations Services(includes writing services, event planning and management, media relations, radio and television analysis, and press services). Signed on 2003-11-25. Completion date: 2001-10-01.
-$267, same as above.Signed on 2003-11-25. Completion date: 2001-10-01.
CTTG INC (1631 SEA ISLE RD; small business)
$23,800 with Navy for Other Education and Training Services. Taking place in IL. Signed on 2005-08-11. Completion date: 2005-05-06.
MARGE THRASHER (4012 BARONNE WAY; small business)
$500 with U.S. Army Corps of Engineers - civil program financing only for Other Professional Services. Signed on 2000-03-29. Completion date: 2000-03-30.
Top industries in this zip code by the number of employees in 2005:
2002 - 2018 National Fire Incident Reporting System (NFIRS) incidents
Based on the data from the years 2002 - 2018 the average number of fires per year is 62. The highest number of reported fires - 106 took place in 2010, and the least - 25 in 2004. The data has a dropping trend.
When looking into fire subcategories, the most reports belonged to: Structure Fires (41.0%), and Mobile Property/Vehicle Fires (30.2%).
Fire incident types reported to NFIRS in Zip Code 38117


 Nearest zip codes: 38152, 38111, 38122, 38120, 38119, 38115.


 Based on the data from the years 2002 - 2018 the average number of fires per year is 62. The highest number of reported fires - 106 took place in 2010, and the least - 25 in 2004. The data has a dropping trend.
 When looking into fire subcategories, the most reports belonged to: Structure Fires (41.0%), and Mobile Property/Vehicle Fires (30.2%).