Estimated zip code population in 2022: 43,101 Zip code population in 2010: 41,742 Zip code population in 2000: 45,077
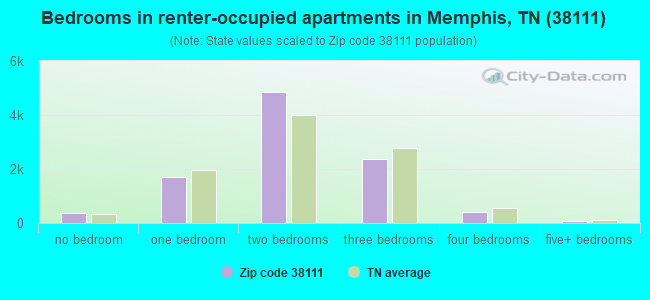
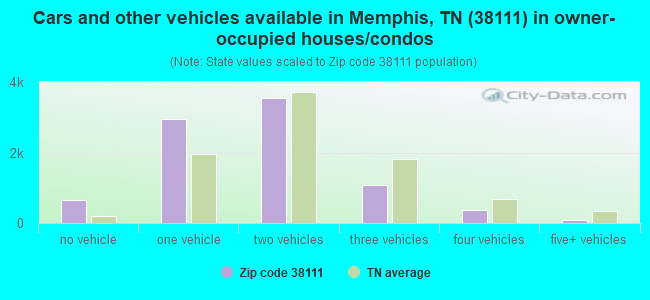
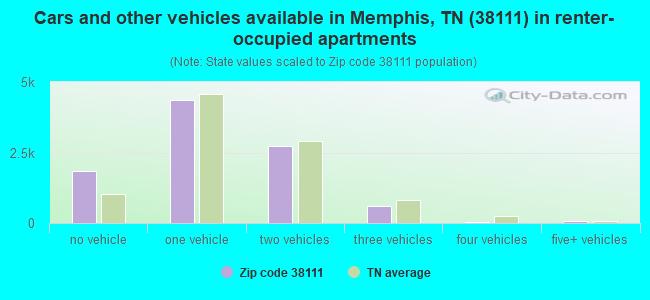
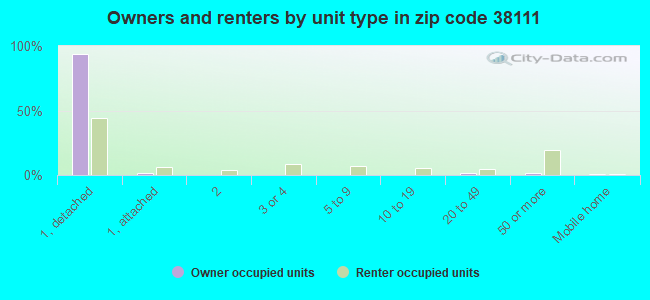
Houses and condos: 20,658 Renter-occupied apartments: 9,736
% of renters here:
53%
State:
33%
March 2022 cost of living index in zip code 38111: 85.6 (less than average, U.S. average is 100)
Land area: 9.9 sq. mi. Water area: 0.0 sq. mi.
Population density: 4,354 people per square mile
(average).
OSM Map
General Map
Google Map
MSN Map
OSM Map
General Map
Google Map
MSN Map
OSM Map
General Map
Google Map
MSN Map
OSM Map
General Map
Google Map
MSN Map
Please wait while loading the map...
Real estate property taxes paid for housing units in 2022:
This zip code:
1.0% ($1,890)
Tennessee:
0.5% ($1,376)
Median real estate property taxes paid for housing units with mortgages in 2022: $2,122 (1.0%) Median real estate property taxes paid for housing units with no mortgage in 2022: $1,664 (1.0%)
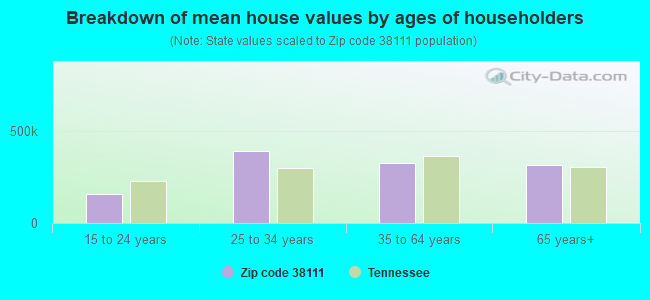
Estimated median house/condo value in 2022: $183,200
38111:
$183,200
Tennessee:
$284,800
According to our research of Tennessee and other state lists, there were 89 registered sex offenders living in 38111 zip code as of April 27, 2024. The ratio of all residents to sex offenders in zip code 38111 is 500 to 1. The ratio of registered sex offenders to all residents in this zip code is lower than the state average.
Median resident age:
This zip code:
33.6 years
Tennessee median age:
39.2 years
Average household size:
This zip code:
2.3 people
Tennessee:
2.4 people
Averages for the 2020 tax year for zip code 38111, filed in 2021:
Average Adjusted Gross Income (AGI) in 2020: $74,369 (Individual Income Tax Returns)
Here:
$74,369
State:
$69,014
Salary/wage: $53,579 (reported on 83.7% of returns)
Here:
$53,579
State:
$55,872
(% of AGI for various income ranges: 1256.6% for AGIs below $25k, 3893.9% for AGIs $25k-50k, 7099.8% for AGIs $50k-75k, 10115.9% for AGIs $75k-100k, 18598.3% for AGIs $100k-200k, 105312.1% for AGIs over 200k)
Taxable interest for individuals: $3,841 (reported on 18.5% of returns)
This zip code:
$3,841
Tennessee:
$1,945
(% of AGI for various income ranges: 5.0% for AGIs below $25k, 7.6% for AGIs $25k-50k, 30.6% for AGIs $50k-75k, 43.7% for AGIs $75k-100k, 204.2% for AGIs $100k-200k, 3592.5% for AGIs over 200k)
Ordinary dividends: $18,509 (reported on 14.9% of returns)
Here:
$18,509
State:
$8,105
(% of AGI for various income ranges: 12.3% for AGIs below $25k, 26.6% for AGIs $25k-50k, 132.0% for AGIs $50k-75k, 298.7% for AGIs $75k-100k, 1050.2% for AGIs $100k-200k, 13234.6% for AGIs over 200k)
Net capital gain/loss in AGI: +$74,755 (reported on 13.9% of returns)
Here:
+$74,755
State:
+$33,664
(% of AGI for various income ranges: 5.4% for AGIs below $25k, 17.6% for AGIs $25k-50k, 107.9% for AGIs $50k-75k, 301.7% for AGIs $75k-100k, 963.3% for AGIs $100k-200k, 62727.9% for AGIs over 200k)
Profit/loss from business: +$14,457 (reported on 22.3% of returns)
Here:
+$14,457
State:
+$18,991
(% of AGI for various income ranges: 119.9% for AGIs below $25k, 34.1% for AGIs $25k-50k, 172.1% for AGIs $50k-75k, 383.3% for AGIs $75k-100k, 1216.1% for AGIs $100k-200k, 12982.9% for AGIs over 200k)
Taxable individual retirement arrangement distribution: $31,731 (reported on 4.9% of returns)
38111:
$31,731
Tennessee:
$20,036
(% of AGI for various income ranges: 13.3% for AGIs below $25k, 40.8% for AGIs $25k-50k, 129.4% for AGIs $50k-75k, 367.4% for AGIs $75k-100k, 817.3% for AGIs $100k-200k, 5832.9% for AGIs over 200k)
Self-employed (Keogh) retirement plans: $28,308 (reported on 0.7% of returns)
38111:
$28,308
Tennessee:
$28,955
(% of AGI for various income ranges: 106.5% for AGIs $100k-200k, 1063.2% for AGIs over 200k)
Total itemized deductions: $46,023 (reported on 7.8% of returns)
Here:
$46,023
State:
$40,136
(% of AGI for various income ranges: 19.3% for AGIs below $25k, 120.2% for AGIs $25k-50k, 353.4% for AGIs $50k-75k, 602.0% for AGIs $75k-100k, 1528.9% for AGIs $100k-200k, 14232.9% for AGIs over 200k)
Charity contributions: $25,410 (reported on 7.1% of returns)
Here:
$25,410
State:
$19,852
(% of AGI for various income ranges: 3.5% for AGIs below $25k, 30.5% for AGIs $25k-50k, 108.8% for AGIs $50k-75k, 181.9% for AGIs $75k-100k, 512.0% for AGIs $100k-200k, 8838.2% for AGIs over 200k)
Taxes paid: $6,842 (reported on 7.6% of returns)
38111:
$6,842
State:
$6,038
(% of AGI for various income ranges: 3.6% for AGIs below $25k, 18.8% for AGIs $25k-50k, 67.0% for AGIs $50k-75k, 142.4% for AGIs $75k-100k, 287.4% for AGIs $100k-200k, 1697.9% for AGIs over 200k)
Earned income credit: $2,687 (reported on 27.5% of returns)
Here:
$2,687
State:
$2,391
(% of AGI for various income ranges: 159.6% for AGIs below $25k, 81.2% for AGIs $25k-50k)
Percentage of individuals using paid preparers for their 2020 taxes: 91.0%
Here:
91%
State:
93%
(% for various income ranges: 90.9% for AGIs below $25k, 90.9% for AGIs $25k-50k, 89.9% for AGIs $50k-75k, 89.4% for AGIs $75k-100k, 92.2% for AGIs $100k-200k, 93.8% for AGIs over 200k)
Averages for the 2012 tax year for zip code 38111, filed in 2013:
Average Adjusted Gross Income (AGI) in 2012: $69,490 (Individual Income Tax Returns)
Here:
$69,490
State:
$53,767
Salary/wage: $52,701 (reported on 84.8% of returns)
Here:
$52,701
State:
$45,421
(% of AGI for various income ranges: 82.2% for AGIs below $25k, 87.3% for AGIs $25k-50k, 79.7% for AGIs $50k-75k, 70.9% for AGIs $75k-100k, 68.0% for AGIs $100k-200k, 52.5% for AGIs over 200k)
Taxable interest for individuals: $3,989 (reported on 18.0% of returns)
This zip code:
$3,989
Tennessee:
$1,732
(% of AGI for various income ranges: 0.4% for AGIs below $25k, 0.4% for AGIs $25k-50k, 0.6% for AGIs $50k-75k, 1.1% for AGIs $75k-100k, 1.1% for AGIs $100k-200k, 1.3% for AGIs over 200k)
Ordinary dividends: $21,034 (reported on 13.4% of returns)
Here:
$21,034
State:
$6,739
(% of AGI for various income ranges: 1.0% for AGIs below $25k, 1.0% for AGIs $25k-50k, 1.6% for AGIs $50k-75k, 3.4% for AGIs $75k-100k, 4.2% for AGIs $100k-200k, 5.7% for AGIs over 200k)
Net capital gain/loss in AGI: +$87,484 (reported on 11.2% of returns)
Here:
+$87,484
State:
+$19,082
(% of AGI for various income ranges: 0.1% for AGIs $25k-50k, 0.5% for AGIs $50k-75k, 1.2% for AGIs $75k-100k, 3.5% for AGIs $100k-200k, 24.8% for AGIs over 200k)
Profit/loss from business: +$13,698 (reported on 20.5% of returns)
Here:
+$13,698
State:
+$15,240
(% of AGI for various income ranges: 9.5% for AGIs below $25k, 1.1% for AGIs $25k-50k, 3.0% for AGIs $50k-75k, 4.7% for AGIs $75k-100k, 4.7% for AGIs $100k-200k, 3.6% for AGIs over 200k)
Taxable individual retirement arrangement distribution: $24,050 (reported on 5.7% of returns)
38111:
$24,050
Tennessee:
$15,505
(% of AGI for various income ranges: 0.9% for AGIs below $25k, 1.2% for AGIs $25k-50k, 1.9% for AGIs $50k-75k, 3.7% for AGIs $75k-100k, 4.1% for AGIs $100k-200k, 1.9% for AGIs over 200k)
Self-employment retirement plans: $24,500 (reported on 0.7% of returns)
38111:
$24,500
Tennessee:
$22,567
(% of AGI for various income ranges: 0.2% for AGIs below $25k, 0.7% for AGIs $75k-100k, 0.3% for AGIs over 200k)
Total itemized deductions: $34,910 (15% of AGI, reported on 22.0% of returns)
Here:
$34,910
State:
$21,976
Here:
15.4% of AGI
State:
17.8% of AGI
(% of AGI for various income ranges: 5.5% for AGIs below $25k, 9.8% for AGIs $25k-50k, 12.8% for AGIs $50k-75k, 15.2% for AGIs $75k-100k, 14.7% for AGIs $100k-200k, 11.2% for AGIs over 200k)
Charity contributions: $17,415 (reported on 19.4% of returns)
Here:
$17,415
State:
$6,709
(% of AGI for various income ranges: 0.8% for AGIs below $25k, 2.1% for AGIs $25k-50k, 2.7% for AGIs $50k-75k, 3.4% for AGIs $75k-100k, 3.1% for AGIs $100k-200k, 7.0% for AGIs over 200k)
Taxes paid: $7,211 (reported on 21.6% of returns)
38111:
$7,211
State:
$4,829
(% of AGI for various income ranges: 1.1% for AGIs below $25k, 2.0% for AGIs $25k-50k, 3.1% for AGIs $50k-75k, 3.8% for AGIs $75k-100k, 4.3% for AGIs $100k-200k, 1.9% for AGIs over 200k)
Earned income credit: $2,876 (reported on 32.9% of returns)
Here:
$2,876
State:
$2,404
(% of AGI for various income ranges: 11.6% for AGIs below $25k, 1.1% for AGIs $25k-50k)
Percentage of individuals using paid preparers for their 2012 taxes: 51.8%
Here:
52%
State:
52%
(% for various income ranges: 52.0% for AGIs below $25k, 46.6% for AGIs $25k-50k, 45.3% for AGIs $50k-75k, 53.8% for AGIs $75k-100k, 60.4% for AGIs $100k-200k, 85.9% for AGIs over 200k)
Averages for the 2004 tax year for zip code 38111, filed in 2005:
Average Adjusted Gross Income (AGI) in 2004: $50,447 (Individual Income Tax Returns)
Here:
$50,447
State:
$44,088
Salary/wage: $46,512 (reported on 85.8% of returns)
Here:
$46,512
State:
$38,825
(% of AGI for various income ranges: 105.3% for AGIs below $10k, 85.6% for AGIs $10k-25k, 87.6% for AGIs $25k-50k, 79.8% for AGIs $50k-75k, 74.0% for AGIs $75k-100k, 74.5% for AGIs over 100k)
Taxable interest for individuals: $3,335 (reported on 25.6% of returns)
This zip code:
$3,335
Tennessee:
$1,802
(% of AGI for various income ranges: 3.5% for AGIs below $10k, 1.2% for AGIs $10k-25k, 1.0% for AGIs $25k-50k, 1.4% for AGIs $50k-75k, 1.9% for AGIs $75k-100k, 2.0% for AGIs over 100k)
Taxable dividends: $11,732 (reported on 16.9% of returns)
Here:
$11,732
State:
$3,727
(% of AGI for various income ranges: 4.2% for AGIs below $10k, 1.0% for AGIs $10k-25k, 1.1% for AGIs $25k-50k, 2.4% for AGIs $50k-75k, 3.0% for AGIs $75k-100k, 5.9% for AGIs over 100k)
Net capital gain/loss: +$42,833 (reported on 14.4% of returns)
Here:
+$42,833
State:
+$15,776
(% of AGI for various income ranges: -1.3% for AGIs below $10k, 0.4% for AGIs $10k-25k, 0.4% for AGIs $25k-50k, 1.3% for AGIs $50k-75k, 2.2% for AGIs $75k-100k, 22.6% for AGIs over 100k)
Profit/loss from business: +$14,793 (reported on 13.6% of returns)
Here:
+$14,793
State:
+$12,882
(% of AGI for various income ranges: 7.8% for AGIs below $10k, 3.7% for AGIs $10k-25k, 1.7% for AGIs $25k-50k, 3.3% for AGIs $50k-75k, 3.6% for AGIs $75k-100k, 4.9% for AGIs over 100k)
IRA payment deduction: $2,465 (reported on 1.6% of returns)
38111:
$2,465
Tennessee:
$2,934
(% of AGI for various income ranges: 0.1% for AGIs $10k-25k, 0.1% for AGIs $25k-50k, 0.2% for AGIs $50k-75k, 0.1% for AGIs $75k-100k, 0.0% for AGIs over 100k)
Self-employed pension: $18,164 (reported on 0.8% of returns)
Here:
$18,164
Tennessee:
$16,857
Total itemized deductions: $22,983 (19% of AGI, reported on 27.9% of returns)
Here:
$22,983
State:
$18,035
Here:
19.1% of AGI
State:
19.9% of AGI
(% of AGI for various income ranges: 11.5% for AGIs below $10k, 7.6% for AGIs $10k-25k, 12.9% for AGIs $25k-50k, 15.1% for AGIs $50k-75k, 15.3% for AGIs $75k-100k, 13.0% for AGIs over 100k)
Charity contributions deductions: $11,451 (9% of AGI, reported on 24.2% of returns)
Here:
$11,451
State:
$5,167
Here:
8.6% of AGI
State:
5.3% of AGI
(% of AGI for various income ranges: 0.7% for AGIs below $10k, 1.3% for AGIs $10k-25k, 2.7% for AGIs $25k-50k, 3.3% for AGIs $50k-75k, 3.2% for AGIs $75k-100k, 8.2% for AGIs over 100k)
Total tax: $14,490 (reported on 64.4% of returns)
38111:
$14,490
State:
$7,482
(% of AGI for various income ranges: 3.5% for AGIs below $10k, 3.1% for AGIs $10k-25k, 6.9% for AGIs $25k-50k, 10.7% for AGIs $50k-75k, 12.4% for AGIs $75k-100k, 28.5% for AGIs over 100k)
Earned income credit: $2,094 (reported on 30.9% of returns)
Here:
$2,094
State:
$1,826
Percentage of individuals using paid preparers for their 2004 taxes: 57.4%
Here:
57%
State:
60%
(% for various income ranges: 54.2% for AGIs below $10k, 62.1% for AGIs $10k-25k, 52.1% for AGIs $25k-50k, 51.4% for AGIs $50k-75k, 55.2% for AGIs $75k-100k, 73.0% for AGIs over 100k)
Likely homosexual households (counted as self-reported same-sex unmarried-partner households)
Lesbian couples: 0.1% of all households
Gay men: 0.7% of all households
Household received Food Stamps/SNAP in the past 12 months: 3,399 Household did not receive Food Stamps/SNAP in the past 12 months: 14,957
Women who had a birth in the past 12 months: 615 (149 now married, 449 unmarried) Women who did not have a birth in the past 12 months: 11,228 (2,916 now married, 8,307 unmarried)
Housing units in zip code 38111 with a mortgage: 4,977 (442 second mortgage, 76 home equity loan, 349 both second mortgage and home equity loan) Houses without a mortgage: 286
Median monthly owner costs for units with a mortgage: $1,382 Median monthly owner costs for units without a mortgage: $598
Residents with income below the poverty level in 2022:
This zip code:
22.8%
Whole state:
13.3%
Residents with income below 50% of the poverty level in 2022:
This zip code:
10.3%
Whole state:
7.1%
Median number of rooms in houses and condos:
Here:
6.6
State:
6.5
Median number of rooms in apartments:
Here:
4.8
State:
4.4
Notable locations in this zip code not listed on our city pages
Notable locations in zip code 38111: Memphis Country Club (A), Michael D Rose Theatre Lecture Hall (B), Kemmons Wilson School of Hospitality and Resort Management (C), Jewish Student Union (D), Hayden Hall (E), Fogelman College of Buisness and Technology Administration Building (F), Dunavant Plaza (G), Deloach Parking Garage (H), Cherokee Branch Memphis Public Library (I), Catholic Student Center (J), West Hall (K), University Center (L), Tennessee Small Business Development Center (M), Suzuki String Building (N), South Hall (O), Scales Hall (P), Barbara K Lipman Early Childhood School and Research Institute (Q), Thomas G Carpenter Student Housing Complex (R), Richardson Towers (S), Ray L Herzog Building (T). Display/hide their locations on the map
Shopping Centers: Poplar Plaza Shopping Center (1), Chickasaw Oaks Village Mall Shopping Center (2), Dillard Square Shopping Center (3), Cross-Rhodes Shopping Center (4), Chickasaw Oaks Plaza Shopping Center (5), Park Center Shopping Center (6), Southern Avenue Shopping Center (7). Display/hide their locations on the map
Churches in zip code 38111 include: Saint Johns Church (A), Saint Matthews Church (B), Poplar Avenue Baptist Church (C), Prescott Memorial Baptist Church (D), Audubon Park Baptist Church (E), Bethel Congregational Methodist Church (F), Beverly Hills Baptist Church (G), Bibleway House of Prayer (H), Buntyn Presbyterian Church (I). Display/hide their locations on the map
Parks in zip code 38111 include: Brentwood Park (1), Galloway Park (2), O'Brien Park (3), East Park (4), Emeriti Grove (5), Chickasaw Gardens (6), Nat Buring Baseball Field (7), Davis Park (8). Display/hide their locations on the map
Tourist attractions (not listed on the city page) : Memphis Public Libraries & Information Center - Branch- Highland (Cultural Attractions- Events- & Facilities; 460 South Highland Street), Memphis Public Libraries & Information Center - General Information (Cultural Attractions- Events- & Facilities; 3030 Poplar Avenue), Memphis Public Libraries & Information Center - Branch- Cherokee (Cultural Attractions- Events- & Facilities; 3300 Sharpe Avenue), Laser Quest (Amusement & Theme Parks; 3417 Plaza Avenue).
3,123 married couples with children.
2,818 single-parent households (911 men, 1,907 women).
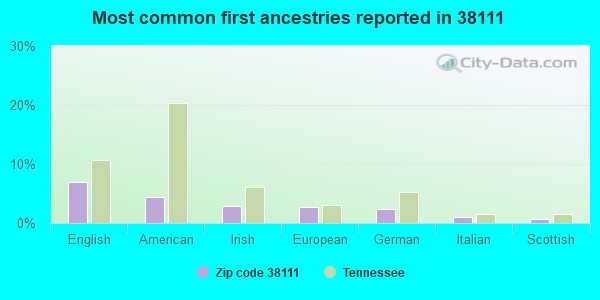
89.2% of residents of 38111 zip code speak English at home.
7.0% of residents speak Spanish at home (57% very well, 19% well, 10% not well, 14% not at all).
1.5% of residents speak other Indo-European language at home (83% very well, 14% well, 3% not well).
1.4% of residents speak Asian or Pacific Island language at home (67% very well, 18% well, 12% not well, 2% not at all).
0.9% of residents speak other language at home (85% very well, 15% well).
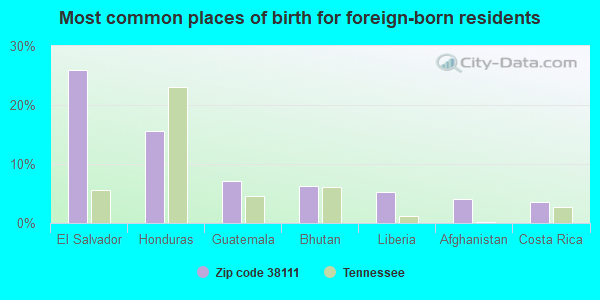
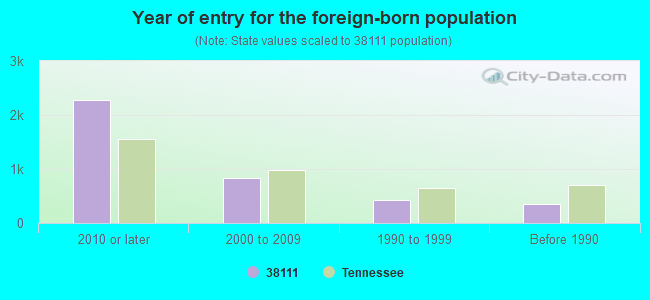
Foreign born population: 3,240 (7.5%) (22.1% of them are naturalized citizens)
Major facilities with environmental interests located in this zip code:
CUSTOM CLEANERS INC (3517 SOUTHERN in MEMPHIS, TN)
(Resource Conservation and Recovery Act (tracking hazardous waste)) Organizations: MARK LOVELL (CONTACT/OWNER)
ACME PRINTING SERVICE (703 S HIGHLAND ST in MEMPHIS, TN)
(Resource Conservation and Recovery Act (tracking hazardous waste)) Business NAICS classification: COMMERCIAL LITHOGRAPHIC PRINTING.
AMOCO OIL SS# 315 (656 HIGHLAND AVE in MEMPHIS, TN)
(Resource Conservation and Recovery Act (tracking hazardous waste)) Business NAICS classification: OTHER FUEL DEALERS.; ALL OTHER AUTOMOTIVE REPAIR AND MAINTENANCE.
AMOCO OIL SS# 326 (1180 GETWELL RD in MEMPHIS, TN)
(Resource Conservation and Recovery Act (tracking hazardous waste)) Business NAICS classification: OTHER FUEL DEALERS.
AUDIO DIMENSION INC (3627 PARK AVE in MEMPHIS, TN)
(Resource Conservation and Recovery Act (tracking hazardous waste))
B A FRAMER CO (3921 PARK AVE in MEMPHIS, TN)
(Resource Conservation and Recovery Act (tracking hazardous waste)) Business NAICS classification: ALL OTHER HOME FURNISHINGS STORES.
CANDLE FACTORY THE (898 SOUTH HIGHLAND in MEMPHIS, TN)
(Resource Conservation and Recovery Act (tracking hazardous waste)) Business NAICS classification: ALL OTHER MISCELLANEOUS MANUFACTURING.
CHALLENGER ATHLETIC GOODS INC (PO BOX 11521 in MEMPHIS, TN)
(Resource Conservation and Recovery Act (tracking hazardous waste))
CLICK SWASH COML PRTG DESIGN (3330 PARK in MEMPHIS, TN)
(Resource Conservation and Recovery Act (tracking hazardous waste)) Business NAICS classification: COMMERCIAL LITHOGRAPHIC PRINTING.
CLINICAL LABS OF MEMPHIS INC (81 N TILLMAN ST in MEMPHIS, TN)
(Resource Conservation and Recovery Act (tracking hazardous waste)) Business NAICS classification: MEDICAL LABORATORIES.
COCA COLA BOTTLING COMPANY OF MEMPHIS (499 S. HOLLYWOOD ST. in MEMPHIS, TN)
Conditionally Exempt Small Quantity Generators, less than 100 kg/month of hazardous waste (Resource Conservation and Recovery Act (tracking hazardous waste)) - notification TRI REPORTER (Tracking of toxic chemicals releasing facilities) Business SIC classification: BOTTLED AND CANNED SOFT DRINKS AND CARBONATED WATERS Organizations: COCA-COLA ENTERPRISES (CONTACT/OWNER)
Alternative names: COCA-COLA BOTTLING COMPANY, COCA-COLA ENTERPRISES INC.
COCA-COLA BOTTLING COMP. (2630 MIDLAND in MEMPHIS, TN)
(Resource Conservation and Recovery Act (tracking hazardous waste))
COLONIAL CRAFTS INC (PO BOX 11514 in MEMPHIS, TN)
(Resource Conservation and Recovery Act (tracking hazardous waste))
Housing units lacking complete plumbing facilities: 1.4% Housing units lacking complete kitchen facilities: 3.8%
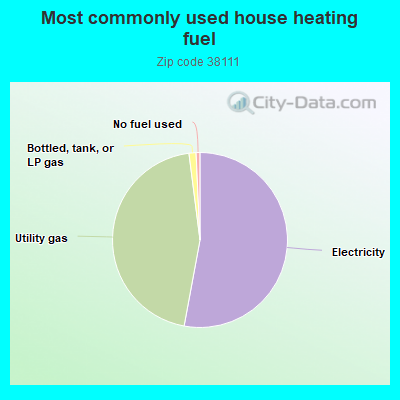
52.6%Electricity
44.8%Utility gas
1.3%Bottled, tank, or LP gas
0.7%No fuel used
Population in 1990: 43,484. Population change in the 1990s: +1,593 (+3.7%).
Place of birth for U.S.-born residents:
This state: 26,992
Northeast: 889
Midwest: 2,232
South: 7,790
West: 1,361
50% of the 38111 zip code residents lived in the same house 5 years ago. Out of people who lived in different houses, 75% lived in this county. Out of people who lived in different counties, 50% lived in Tennessee.
88% of the 38111 zip code residents lived in the same house 1 year ago. Out of people who lived in different houses, 63% moved from this county. Out of people who lived in different houses, 5% moved from different county within same state. Out of people who lived in different houses, 25% moved from different state. Out of people who lived in different houses, 4% moved from abroad.
Private vs. public school enrollment:
Students in private schools in grades 1 to 8 (elementary and middle school): 853
Here:
27.7%
Tennessee:
15.0%
Students in private schools in grades 9 to 12 (high school): 266
Here:
14.2%
Tennessee:
16.2%
Students in private undergraduate colleges: 830
Here:
25.3%
Tennessee:
23.5%
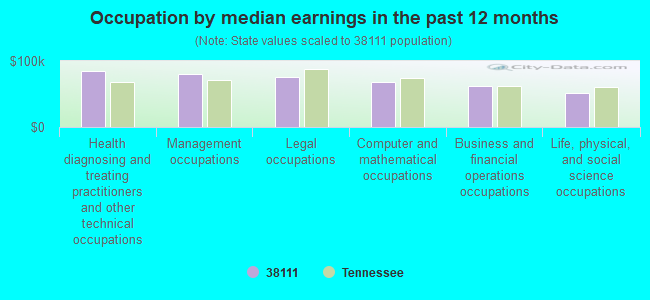
Occupation by median earnings in the past 12 months ($)
85,456Health diagnosing and treating practitioners and other technical occupations
80,810Management occupations
75,516Legal occupations
67,893Computer and mathematical occupations
61,811Business and financial operations occupations
50,797Life, physical, and social science occupations
Companies with federal contracts located in this zip code (MEMPHIS, TN):
GREYSTONE MEDICAL GROUP INC (3251 POPLAR AVE STE 150; small business) : $1,808,264 in 4 contractsfrom 2003 to 2005
$960,000 with Navy for Other Defense -- Advanced Development (R&D). Signed on 2005-08-03. Completion date: 2006-06-15.
$451,181 with Army for Other Defense -- Applied Research and Exploratory Development (R&D). Signed on 2005-04-22. Completion date: 2007-07-30.
$298,789, same as above.Signed on 2005-04-22. Completion date: 2007-07-30.
$98,294, same as above.Signed on 2003-07-31. Completion date: 2004-08-28.
COCA-COLA BOTTLING COMPANY OF (499 S HOLLYWOOD ST) : $409,470 in 6 contractsfrom 2004 to 2006
Contracts for Non-Food Items For Resale, Food Items For Resale by Defense Commissary Agency Signed by year:2000: $0; 2001: $0; 2002: $0; 2003: $0; 2004: $84,310; 2005: $222,808; 2006: $102,352.
Biggest contracts:
$102,352 with Defense Commissary Agency for Non-Food Items For Resale. Signed on 2006-01-01. Completion date: 2006-03-31.
$97,266 with Defense Commissary Agency for Food Items For Resale. Signed on 2005-04-01. Completion date: 2005-08-31.
$84,310, same as above.Signed on 2004-10-01. Completion date: 2005-02-28.
$65,109 with Defense Commissary Agency for Non-Food Items For Resale. Signed on 2005-10-01. Completion date: 2005-12-31.
MEMPHIS BOAT CENTER, INC (1920 WATSON; small business) : $49,234 in 5 contractsfrom 2002 to 2005
Contracts for Gasoline Rotary Engines and Components, Ship and Boat Propulsion Components, Gasoline Reciprocating Engines, Except Aircraft; and Components, Miscellaneous Ship and Marine Equipment by U.S. Army Corps of Engineers - civil program financing only, Army Signed by year:2000: $0; 2001: $0; 2002: $30,732; 2003: $15,580; 2004: $0; 2005: $2,922; 2006: $0.
Biggest contracts:
$23,361 with U.S. Army Corps of Engineers - civil program financing only for Gasoline Rotary Engines and Components. Signed on 2002-09-17. Completion date: 2002-11-29.
$7,850 with U.S. Army Corps of Engineers - civil program financing only for Ship and Boat Propulsion Components. Signed on 2003-04-04. Completion date: 2003-04-14.
$7,730 with U.S. Army Corps of Engineers - civil program financing only for Gasoline Reciprocating Engines, Except Aircraft; and Components. Signed on 2003-08-27. Completion date: 2003-09-30.
$7,371, same as above.Signed on 2002-06-18. Completion date: 2002-06-28.
MCCRORY ELECTRIC COMPANY INC (2891 WALNUT GROVE ROAD; small business) : $20,950 in 3 contractsfrom 2001 to 2004
$13,200 with Navy for Maintenance, Repair or Alteration of Real Property -- Highways, Roads, Streets, Bridges, and Railways (includes resurfacing). Signed on 2003-04-11. Completion date: 2003-05-14.
$5,650 with Navy for Maintenance, Repair or Alteration of Real Property -- Office Buildings. Signed on 2001-02-02. Completion date: 2001-03-19.
$2,100 with Navy for Maintenance, Repair or Alteration of Real Property -- Maintenance Buildings. Signed on 2004-08-04. Completion date: 2004-09-17.
MSP INC (3637 PARK AVE STE 110; small business) : $10,976 in 4 contractsin 2004
$4,000 with Army for Reproduction Services. Signed on 2004-02-24. Completion date: 2004-03-03.
$4,000 with U.S. Army Corps of Engineers - civil program financing only for Reproduction Services. Signed on 2004-02-24. Completion date: 2004-03-03.
$1,488 with Army for Reproduction Services. Signed on 2004-03-03. Completion date: 2004-03-03.
$1,488 with U.S. Army Corps of Engineers - civil program financing only for Reproduction Services. Signed on 2004-03-03. Completion date: 2004-03-03.
TATE REALTY & CONSTRUCTION, IN (3115 PARK; small business) : $8,054 in 2 contractsin 2003
$7,800 with Navy for Maintenance, Repair or Alteration of Real Property -- Recreational Buildings. Signed on 2003-03-24. Completion date: 2003-05-08.
$254, same as above.Signed on 2003-05-08. Completion date: 2003-05-08.
EL CHICO RESTAURANTS INC (3491 POPLAR AVE; small business) : $7,250 in 2 contractsfrom 2005 to 2006
$4,050 with Army for Food Services. Signed on 2005-08-25. Completion date: 2005-09-09.
$3,200, same as above.Signed on 2006-05-06. Completion date: 2006-05-06.
INTERNET INSIGHTS INC (111 S HIGHLAND, STE-144; small business)
$4,813 with Army for Visible and Invisible Light Communication Equipment. Taking place in GA. Signed on 2003-09-25. Completion date: 2003-10-24.
AFFORDABLE CATERING (1308 GETWELL RD; small business)
$2,825 with Navy for Food Services. Signed on 2005-09-28. Completion date: 2005-09-10.
Top industries in this zip code by the number of employees in 2005:
2002 - 2018 National Fire Incident Reporting System (NFIRS) incidents
According to the data from the years 2002 - 2018 the average number of fire incidents per year is 146. The highest number of reported fires - 211 took place in 2017, and the least - 57 in 2004. The data has a rising trend.
When looking into fire subcategories, the most incidents belonged to: Structure Fires (46.0%), and Mobile Property/Vehicle Fires (23.9%).
Fire incident types reported to NFIRS in Zip Code 38111

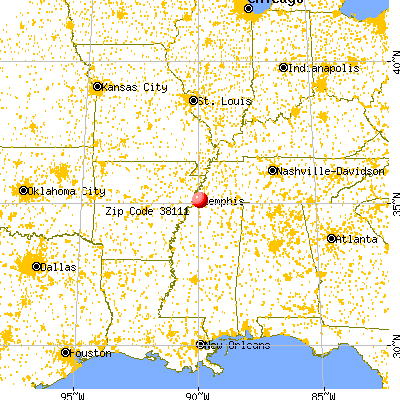


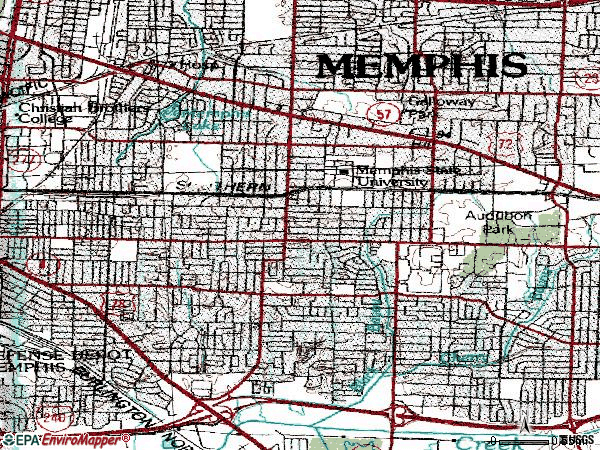
 Nearest zip codes: 38152, 38117, 38114, 38112, 38122, 38132.


 According to the data from the years 2002 - 2018 the average number of fire incidents per year is 146. The highest number of reported fires - 211 took place in 2017, and the least - 57 in 2004. The data has a rising trend.
 When looking into fire subcategories, the most incidents belonged to: Structure Fires (46.0%), and Mobile Property/Vehicle Fires (23.9%).