Estimated zip code population in 2022: 31,486 Zip code population in 2010: 30,657 Zip code population in 2000: 24,623
Houses and condos: 11,441 Renter-occupied apartments: 2,065
% of renters here:
18%
State:
33%
March 2022 cost of living index in zip code 38135: 87.3 (less than average, U.S. average is 100)
Land area: 12.8 sq. mi. Water area: 0.1 sq. mi.
Population density: 2,461 people per square mile
(low).
OSM Map
General Map
Google Map
MSN Map
OSM Map
General Map
Google Map
MSN Map
OSM Map
General Map
Google Map
MSN Map
OSM Map
General Map
Google Map
MSN Map
Please wait while loading the map...
Real estate property taxes paid for housing units in 2022:
This zip code:
0.9% ($2,467)
Tennessee:
0.5% ($1,376)
Median real estate property taxes paid for housing units with mortgages in 2022: $2,368 (0.8%) Median real estate property taxes paid for housing units with no mortgage in 2022: $2,645 (0.9%)
Business Search- 14 Million verified businesses
Males: 15,267
(48.5%)
Females: 16,218
(51.5%)
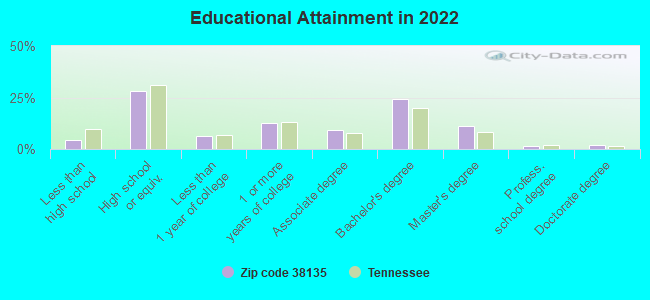
For population 25 years and over in 38135:
High school or higher: 96.3%
Bachelor's degree or higher: 39.4%
Graduate or professional degree: 14.7%
Unemployed: 3.3%
Mean travel time to work (commute): 24.7 minutes
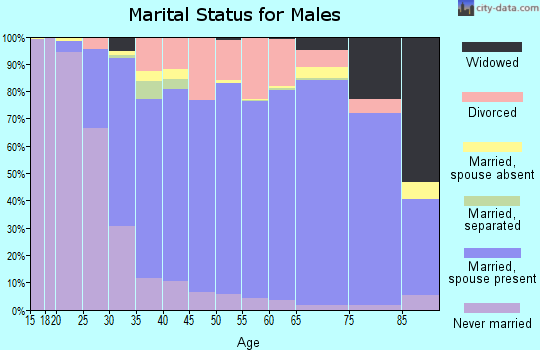
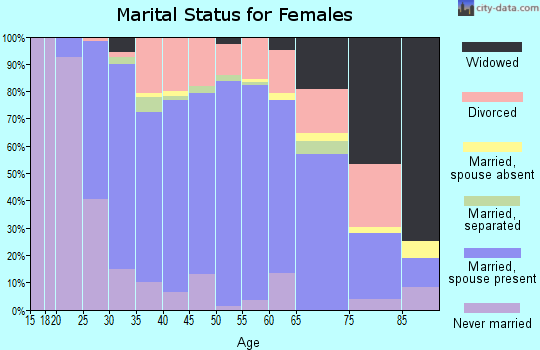
For population 15 years and over in 38135:
Never married: 30.2%
Now married: 56.0%
Separated: 1.2%
Widowed: 4.3%
Divorced: 8.4%
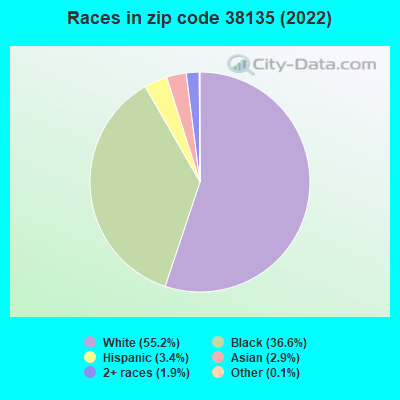
Zip code 38135 compared to state average:
Black race population percentage above state average.
Hispanic race population percentage below state average.
Renting percentage below state average.
Length of stay since moving in significantly above state average.
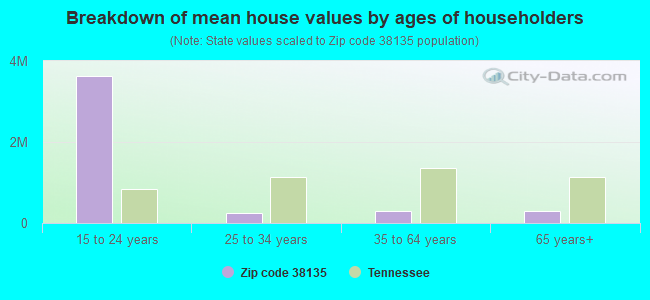
Estimated median house/condo value in 2022: $287,131
38135:
$287,131
Tennessee:
$284,800
According to our research of Tennessee and other state lists, there were 26 registered sex offenders living in 38135 zip code as of April 27, 2024. The ratio of all residents to sex offenders in zip code 38135 is 1,133 to 1. The ratio of registered sex offenders to all residents in this zip code is much lower than the state average.
Median resident age:
This zip code:
40.7 years
Tennessee median age:
39.2 years
Average household size:
This zip code:
2.8 people
Tennessee:
2.4 people
Averages for the 2020 tax year for zip code 38135, filed in 2021:
Average Adjusted Gross Income (AGI) in 2020: $63,755 (Individual Income Tax Returns)
Here:
$63,755
State:
$69,014
Salary/wage: $58,653 (reported on 83.4% of returns)
Here:
$58,653
State:
$55,872
(% of AGI for various income ranges: 1206.3% for AGIs below $25k, 3718.2% for AGIs $25k-50k, 6521.1% for AGIs $50k-75k, 9656.9% for AGIs $75k-100k, 16860.6% for AGIs $100k-200k, 62342.3% for AGIs over 200k)
Taxable interest for individuals: $976 (reported on 25.5% of returns)
This zip code:
$976
Tennessee:
$1,945
(% of AGI for various income ranges: 12.0% for AGIs below $25k, 15.5% for AGIs $25k-50k, 30.6% for AGIs $50k-75k, 44.4% for AGIs $75k-100k, 70.4% for AGIs $100k-200k, 503.8% for AGIs over 200k)
Ordinary dividends: $3,215 (reported on 14.0% of returns)
Here:
$3,215
State:
$8,105
(% of AGI for various income ranges: 12.4% for AGIs below $25k, 20.6% for AGIs $25k-50k, 39.3% for AGIs $50k-75k, 51.6% for AGIs $75k-100k, 145.3% for AGIs $100k-200k, 1552.3% for AGIs over 200k)
Net capital gain/loss in AGI: +$7,526 (reported on 12.1% of returns)
Here:
+$7,526
State:
+$33,664
(% of AGI for various income ranges: 4.5% for AGIs below $25k, 13.5% for AGIs $25k-50k, 38.6% for AGIs $50k-75k, 47.4% for AGIs $75k-100k, 270.6% for AGIs $100k-200k, 5667.7% for AGIs over 200k)
Profit/loss from business: +$7,691 (reported on 19.0% of returns)
Here:
+$7,691
State:
+$18,991
(% of AGI for various income ranges: 36.1% for AGIs below $25k, 98.2% for AGIs $50k-75k, 207.7% for AGIs $75k-100k, 445.4% for AGIs $100k-200k, 6966.2% for AGIs over 200k)
Taxable individual retirement arrangement distribution: $16,941 (reported on 8.7% of returns)
38135:
$16,941
Tennessee:
$20,036
(% of AGI for various income ranges: 48.4% for AGIs below $25k, 88.3% for AGIs $25k-50k, 173.8% for AGIs $50k-75k, 269.6% for AGIs $75k-100k, 509.2% for AGIs $100k-200k, 2610.8% for AGIs over 200k)
Self-employed (Keogh) retirement plans: $19,140 (reported on 0.3% of returns)
38135:
$19,140
Tennessee:
$28,955
(% of AGI for various income ranges: 60.6% for AGIs $100k-200k)
Total itemized deductions: $28,518 (reported on 8.5% of returns)
Here:
$28,518
State:
$40,136
(% of AGI for various income ranges: 46.6% for AGIs below $25k, 174.4% for AGIs $25k-50k, 346.2% for AGIs $50k-75k, 480.4% for AGIs $75k-100k, 812.2% for AGIs $100k-200k, 3670.8% for AGIs over 200k)
Charity contributions: $12,783 (reported on 7.8% of returns)
Here:
$12,783
State:
$19,852
(% of AGI for various income ranges: 7.4% for AGIs below $25k, 52.3% for AGIs $25k-50k, 131.4% for AGIs $50k-75k, 191.2% for AGIs $75k-100k, 357.5% for AGIs $100k-200k, 2178.5% for AGIs over 200k)
Taxes paid: $5,579 (reported on 8.2% of returns)
38135:
$5,579
State:
$6,038
(% of AGI for various income ranges: 7.3% for AGIs below $25k, 28.8% for AGIs $25k-50k, 65.0% for AGIs $50k-75k, 99.7% for AGIs $75k-100k, 159.2% for AGIs $100k-200k, 647.7% for AGIs over 200k)
Earned income credit: $2,439 (reported on 15.3% of returns)
Here:
$2,439
State:
$2,391
(% of AGI for various income ranges: 101.8% for AGIs below $25k, 74.2% for AGIs $25k-50k, 1.2% for AGIs $50k-75k)
Percentage of individuals using paid preparers for their 2020 taxes: 92.4%
Here:
92%
State:
93%
(% for various income ranges: 92.9% for AGIs below $25k, 92.5% for AGIs $25k-50k, 92.1% for AGIs $50k-75k, 91.6% for AGIs $75k-100k, 92.5% for AGIs $100k-200k, 90.0% for AGIs over 200k)
Averages for the 2012 tax year for zip code 38135, filed in 2013:
Average Adjusted Gross Income (AGI) in 2012: $57,955 (Individual Income Tax Returns)
Here:
$57,955
State:
$53,767
Salary/wage: $53,020 (reported on 86.9% of returns)
Here:
$53,020
State:
$45,421
(% of AGI for various income ranges: 78.3% for AGIs below $25k, 81.9% for AGIs $25k-50k, 81.1% for AGIs $50k-75k, 80.9% for AGIs $75k-100k, 84.3% for AGIs $100k-200k, 58.5% for AGIs over 200k)
Taxable interest for individuals: $873 (reported on 30.5% of returns)
This zip code:
$873
Tennessee:
$1,732
(% of AGI for various income ranges: 1.0% for AGIs below $25k, 0.6% for AGIs $25k-50k, 0.4% for AGIs $50k-75k, 0.4% for AGIs $75k-100k, 0.3% for AGIs $100k-200k, 0.6% for AGIs over 200k)
Ordinary dividends: $2,547 (reported on 15.7% of returns)
Here:
$2,547
State:
$6,739
(% of AGI for various income ranges: 0.9% for AGIs below $25k, 0.5% for AGIs $25k-50k, 0.4% for AGIs $50k-75k, 0.5% for AGIs $75k-100k, 0.5% for AGIs $100k-200k, 2.0% for AGIs over 200k)
Net capital gain/loss in AGI: +$4,042 (reported on 11.7% of returns)
Here:
+$4,042
State:
+$19,082
(% of AGI for various income ranges: 0.1% for AGIs $25k-50k, 0.3% for AGIs $50k-75k, 0.4% for AGIs $75k-100k, 0.3% for AGIs $100k-200k, 5.2% for AGIs over 200k)
Profit/loss from business: +$9,227 (reported on 16.4% of returns)
Here:
+$9,227
State:
+$15,240
(% of AGI for various income ranges: 6.6% for AGIs below $25k, 1.4% for AGIs $25k-50k, 1.6% for AGIs $50k-75k, 2.0% for AGIs $75k-100k, 2.2% for AGIs $100k-200k, 5.7% for AGIs over 200k)
Taxable individual retirement arrangement distribution: $12,805 (reported on 9.2% of returns)
38135:
$12,805
Tennessee:
$15,505
(% of AGI for various income ranges: 2.9% for AGIs below $25k, 2.3% for AGIs $25k-50k, 2.2% for AGIs $50k-75k, 2.0% for AGIs $75k-100k, 2.0% for AGIs $100k-200k, 1.0% for AGIs over 200k)
Self-employment retirement plans: $12,883 (reported on 0.4% of returns)
38135:
$12,883
Tennessee:
$22,567
Total itemized deductions: $19,266 (21% of AGI, reported on 38.6% of returns)
Here:
$19,266
State:
$21,976
Here:
21.5% of AGI
State:
17.8% of AGI
(% of AGI for various income ranges: 10.4% for AGIs below $25k, 14.7% for AGIs $25k-50k, 14.7% for AGIs $50k-75k, 13.9% for AGIs $75k-100k, 12.7% for AGIs $100k-200k, 7.6% for AGIs over 200k)
Charity contributions: $5,349 (reported on 34.5% of returns)
Here:
$5,349
State:
$6,709
(% of AGI for various income ranges: 1.4% for AGIs below $25k, 2.7% for AGIs $25k-50k, 3.3% for AGIs $50k-75k, 3.5% for AGIs $75k-100k, 3.6% for AGIs $100k-200k, 3.0% for AGIs over 200k)
Taxes paid: $4,483 (reported on 38.4% of returns)
38135:
$4,483
State:
$4,829
(% of AGI for various income ranges: 2.1% for AGIs below $25k, 3.0% for AGIs $25k-50k, 3.2% for AGIs $50k-75k, 3.3% for AGIs $75k-100k, 3.2% for AGIs $100k-200k, 2.1% for AGIs over 200k)
Earned income credit: $2,429 (reported on 15.9% of returns)
Here:
$2,429
State:
$2,404
(% of AGI for various income ranges: 7.3% for AGIs below $25k, 1.1% for AGIs $25k-50k)
Percentage of individuals using paid preparers for their 2012 taxes: 44.0%
Here:
44%
State:
52%
(% for various income ranges: 41.3% for AGIs below $25k, 44.4% for AGIs $25k-50k, 42.7% for AGIs $50k-75k, 46.4% for AGIs $75k-100k, 46.9% for AGIs $100k-200k, 60.0% for AGIs over 200k)
Averages for the 2004 tax year for zip code 38135, filed in 2005:
Average Adjusted Gross Income (AGI) in 2004: $54,173 (Individual Income Tax Returns)
Here:
$54,173
State:
$44,088
Salary/wage: $51,060 (reported on 88.9% of returns)
Here:
$51,060
State:
$38,825
(% of AGI for various income ranges: 120.7% for AGIs below $10k, 77.3% for AGIs $10k-25k, 82.6% for AGIs $25k-50k, 84.8% for AGIs $50k-75k, 87.7% for AGIs $75k-100k, 81.1% for AGIs over 100k)
Taxable interest for individuals: $1,056 (reported on 44.5% of returns)
This zip code:
$1,056
Tennessee:
$1,802
(% of AGI for various income ranges: 3.7% for AGIs below $10k, 2.1% for AGIs $10k-25k, 1.1% for AGIs $25k-50k, 0.7% for AGIs $50k-75k, 0.5% for AGIs $75k-100k, 0.8% for AGIs over 100k)
Taxable dividends: $1,413 (reported on 22.2% of returns)
Here:
$1,413
State:
$3,727
(% of AGI for various income ranges: 2.2% for AGIs below $10k, 1.1% for AGIs $10k-25k, 0.5% for AGIs $25k-50k, 0.6% for AGIs $50k-75k, 0.4% for AGIs $75k-100k, 0.6% for AGIs over 100k)
Net capital gain/loss: +$4,338 (reported on 16.6% of returns)
Here:
+$4,338
State:
+$15,776
(% of AGI for various income ranges: -1.8% for AGIs below $10k, 0.0% for AGIs $10k-25k, 0.1% for AGIs $25k-50k, 0.3% for AGIs $50k-75k, 0.5% for AGIs $75k-100k, 3.3% for AGIs over 100k)
Profit/loss from business: +$11,718 (reported on 14.9% of returns)
Here:
+$11,718
State:
+$12,882
(% of AGI for various income ranges: -0.7% for AGIs below $10k, 4.1% for AGIs $10k-25k, 2.8% for AGIs $25k-50k, 2.9% for AGIs $50k-75k, 3.6% for AGIs $75k-100k, 3.4% for AGIs over 100k)
IRA payment deduction: $3,180 (reported on 2.5% of returns)
38135:
$3,180
Tennessee:
$2,934
(% of AGI for various income ranges: 0.2% for AGIs $10k-25k, 0.2% for AGIs $25k-50k, 0.2% for AGIs $50k-75k, 0.1% for AGIs $75k-100k, 0.1% for AGIs over 100k)
Self-employed pension: $10,456 (reported on 0.6% of returns)
Here:
$10,456
Tennessee:
$16,857
(% of AGI for various income ranges: 0.1% for AGIs $50k-75k, 0.2% for AGIs $75k-100k, 0.2% for AGIs over 100k)
Total itemized deductions: $17,159 (22% of AGI, reported on 50.1% of returns)
Here:
$17,159
State:
$18,035
Here:
22.1% of AGI
State:
19.9% of AGI
(% of AGI for various income ranges: 14.6% for AGIs below $10k, 13.4% for AGIs $10k-25k, 18.6% for AGIs $25k-50k, 17.7% for AGIs $50k-75k, 16.5% for AGIs $75k-100k, 13.6% for AGIs over 100k)
Charity contributions deductions: $3,872 (5% of AGI, reported on 45.4% of returns)
Here:
$3,872
State:
$5,167
Here:
4.9% of AGI
State:
5.3% of AGI
(% of AGI for various income ranges: 1.1% for AGIs below $10k, 2.0% for AGIs $10k-25k, 3.2% for AGIs $25k-50k, 3.3% for AGIs $50k-75k, 3.4% for AGIs $75k-100k, 3.4% for AGIs over 100k)
Total tax: $7,238 (reported on 80.9% of returns)
38135:
$7,238
State:
$7,482
(% of AGI for various income ranges: 3.5% for AGIs below $10k, 4.0% for AGIs $10k-25k, 6.4% for AGIs $25k-50k, 8.5% for AGIs $50k-75k, 10.1% for AGIs $75k-100k, 15.8% for AGIs over 100k)
Earned income credit: $1,729 (reported on 9.5% of returns)
Here:
$1,729
State:
$1,826
Percentage of individuals using paid preparers for their 2004 taxes: 46.4%
Here:
46%
State:
60%
(% for various income ranges: 36.0% for AGIs below $10k, 48.9% for AGIs $10k-25k, 50.2% for AGIs $25k-50k, 47.3% for AGIs $50k-75k, 45.2% for AGIs $75k-100k, 48.7% for AGIs over 100k)
Likely homosexual households (counted as self-reported same-sex unmarried-partner households)
Lesbian couples: 0.4% of all households
Gay men: 0.0% of all households
Household received Food Stamps/SNAP in the past 12 months: 522 Household did not receive Food Stamps/SNAP in the past 12 months: 10,854
Women who had a birth in the past 12 months: 233 (230 now married, 7 unmarried) Women who did not have a birth in the past 12 months: 6,867 (2,921 now married, 3,945 unmarried)
Housing units in zip code 38135 with a mortgage: 6,588 (508 second mortgage, 10 home equity loan, 318 both second mortgage and home equity loan) Houses without a mortgage: 73
Median monthly owner costs for units with a mortgage: $1,596 Median monthly owner costs for units without a mortgage: $600
Residents with income below the poverty level in 2022:
This zip code:
7.8%
Whole state:
13.3%
Residents with income below 50% of the poverty level in 2022:
This zip code:
3.7%
Whole state:
7.1%
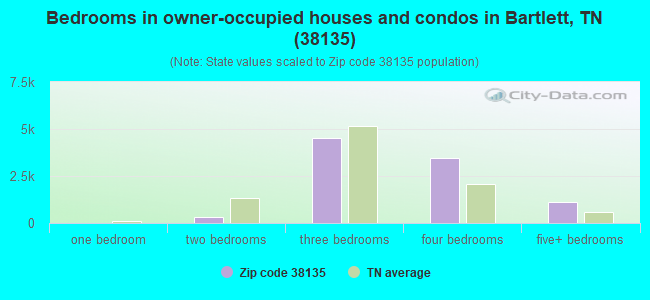
Median number of rooms in houses and condos:
Here:
7.3
State:
6.5
Median number of rooms in apartments:
Here:
5.7
State:
4.4
Notable locations in this zip code not listed on our city pages
Notable locations in zip code 38135: HealthSouth Rehabilitation Hospital North (A), Fullview Baptist Church Christian Life Center (B), Faith Baptist Church Mission House (C), Ellendale Baptist Church Family Life Center (D). Display/hide their locations on the map
Churches in zip code 38135 include: Fellowship Baptist Church (A), Fullview Church (B), Prosperity Church (C), Curry Memorial Church (D), The Church of Jesus Christ of Latter Day Saints (E), Solid Rock Baptist Church (F), Raleigh Springs Baptist Church (G), Quail Ridge Church of Christ (H), Living Word Lutheran Church (I). Display/hide their locations on the map
In group quarters: 220 (-1 institutionalized population)
Size of family households: 3,979 2-persons, 2,297 3-persons, 1,529 4-persons, 547 5-persons, 211 6-persons, 373 7-or-more-persons
Size of nonfamily households: 1,981 1-person, 381 2-persons, 49 3-persons
4,698 married couples with children.
1,355 single-parent households (269 men, 1,086 women).
88.2% of residents of 38135 zip code speak English at home.
3.0% of residents speak Spanish at home (68% very well, 10% well, 22% not well).
1.7% of residents speak other Indo-European language at home (63% very well, 24% well, 13% not well).
2.3% of residents speak Asian or Pacific Island language at home (59% very well, 7% well, 30% not well, 4% not at all).
5.2% of residents speak other language at home (76% very well, 15% well, 5% not well, 4% not at all).
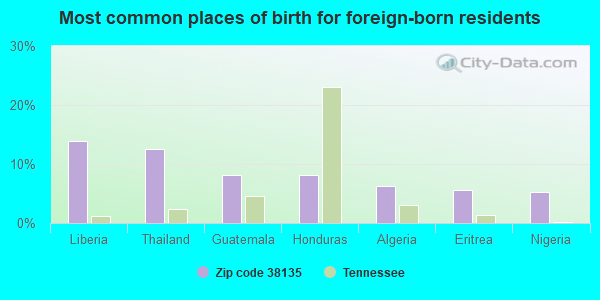
Foreign born population: 2,193 (7.0%) (67.6% of them are naturalized citizens)
Facilities with environmental interests located in this zip code:
BARTLETT ELEMENTARY SCHOOL (3932 BILLY MAHER RD in BARTLETT, TN)
(National Center for Education Statistics) - STATE ID-0020 Organizations: SHELBY COUNTY SCHOOL DISTRICT (SCHOOL DISTRICT)
BARTLETT LAGOON (6230 OLD BROWNSVILLE ROAD in BARTLETT, TN)
National Pollutant Discharge Elimination System MAJOR (Tracking pollutant discharge elimination systems) - permit Business SIC classification: SEWERAGE SYSTEMS Organizations: CITY OF BARTLETT (CONTACT/OWNER)
Alternative names: BARTLETT STP, CITY OF BARTLETT
CITY OF BARTLETT (5258 SHELTER RUN LANE in BARTLETT, TN)
ENFORCEMENT/COMPLIANCE ACTIVITY (Integrated Compliance Information System)
Housing units lacking complete plumbing facilities: 0.5% Housing units lacking complete kitchen facilities: 1.7%
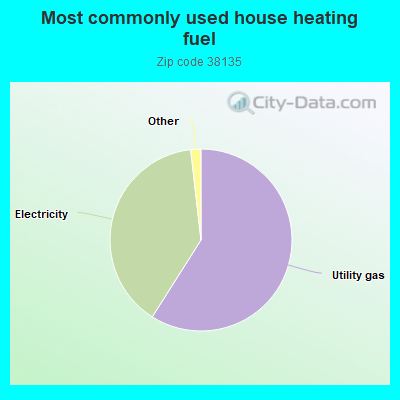
59.0%Utility gas
39.2%Electricity
1.0%Bottled, tank, or LP gas
0.7%No fuel used
Population in 1990: 13,428. Population change in the 1990s: +11,195 (+83.4%).
Place of birth for U.S.-born residents:
This state: 16,020
Northeast: 1,504
Midwest: 2,489
South: 7,597
West: 1,250
52% of the 38135 zip code residents lived in the same house 5 years ago. Out of people who lived in different houses, 74% lived in this county. Out of people who lived in different counties, 50% lived in Tennessee.
92% of the 38135 zip code residents lived in the same house 1 year ago. Out of people who lived in different houses, 63% moved from this county. Out of people who lived in different houses, 25% moved from different county within same state. Out of people who lived in different houses, 10% moved from different state. Out of people who lived in different houses, 1% moved from abroad.
Private vs. public school enrollment:
Students in private schools in grades 1 to 8 (elementary and middle school): 783
Here:
25.1%
Tennessee:
15.0%
Students in private schools in grades 9 to 12 (high school): 300
Here:
18.0%
Tennessee:
16.2%
Students in private undergraduate colleges: 145
Here:
12.1%
Tennessee:
23.5%
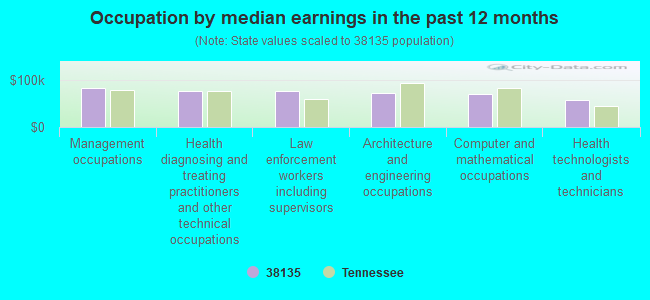
Occupation by median earnings in the past 12 months ($)
83,316Management occupations
77,952Health diagnosing and treating practitioners and other technical occupations
76,079Law enforcement workers including supervisors
72,282Architecture and engineering occupations
70,075Computer and mathematical occupations
58,631Health technologists and technicians
Companies with federal contracts located in this zip code:
TACON COMPANY LLC (6525 FERNCREST DRIVE in MEMPHIS, TN; small business) : $23,306,654 in 47 contractsfrom 2000 to 2004
Contracts for Construction of Structures and Facilities -- Other Non-Building Facilities by U.S. Army Corps of Engineers - civil program financing only, Army Signed by year:2000: $3,620,034; 2001: $5,043,040; 2002: $3,703,781; 2003: $3,237,949; 2004: $7,701,850; 2005: $0; 2006: $0.
Biggest contracts:
$3,317,000 with U.S. Army Corps of Engineers - civil program financing only for Construction of Structures and Facilities -- Other Non-Building Facilities. Taking place in LA. Signed on 2002-12-06. Completion date: 2003-04-25.
$2,793,500, same as above.Signed on 2001-07-13. Completion date: 2002-01-15.
$2,002,430, same as above.Signed on 2003-06-30. Completion date: 2003-08-29.
$2,000,000 with Army for Construction of Structures and Facilities -- Other Non-Building Facilities. Signed on 2004-01-23. Completion date: 2004-06-07.
MICHAEL RACER (6358 GARDENER CV in BARTLETT, TN) : $179,900 in 7 contractsfrom 2001 to 2005
Contracts for Simulation, Program Review/Development Services, Other Professional Services by U.S. Army Corps of Engineers - civil program financing only, Army Signed by year:2000: $0; 2001: $70,000; 2002: $0; 2003: $33,500; 2004: $0; 2005: $76,400; 2006: $0.
Biggest contracts:
$38,200 with U.S. Army Corps of Engineers - civil program financing only for Simulation. Taking place in LA. Signed on 2005-03-10. Completion date: 2005-06-18.
$38,200 with Army for Simulation. Taking place in LA. Signed on 2005-03-10. Completion date: 2005-06-18.
$25,000 with U.S. Army Corps of Engineers - civil program financing only for Program Review/Development Services. Taking place in MD. Signed on 2001-08-17. Completion date: 2001-08-10.
$25,000, same as above.Signed on 2001-05-31. Completion date: 2001-06-04.
T W FONDREN CO , INC (6838 BAUDETTE, LN in BARTLETT, TN; small business) : $68,647 in 6 contractsfrom 2001 to 2002
Contracts for Maintenance, Repair or Alteration of Real Property -- Family Housing Facilities, Maintenance, Repair or Alteration of Real Property -- Recreation Facilities (Non-Building), Maintenance, Repair or Alteration of Real Property -- Other Administrative Facilities and Service Buildings, Maintenance, Repair or Alteration of Real Property -- Other Residential Buildings, and moreby Navy Signed by year:2000: $0; 2001: $51,673; 2002: $16,974; 2003: $0; 2004: $0; 2005: $0; 2006: $0.
Biggest contracts:
$40,121 with Navy for Maintenance, Repair or Alteration of Real Property -- Family Housing Facilities. Signed on 2001-02-02. Completion date: 2001-04-03.
$9,821 with Navy for Maintenance, Repair or Alteration of Real Property -- Recreation Facilities (Non-Building). Signed on 2001-08-24. Completion date: 2001-10-23.
$7,533 with Navy for Maintenance, Repair or Alteration of Real Property -- Other Administrative Facilities and Service Buildings. Signed on 2002-07-02. Completion date: 2002-09-01.
$6,108 with Navy for Maintenance, Repair or Alteration of Real Property -- Other Residential Buildings. Signed on 2002-07-17. Completion date: 2002-10-15.
VIRGIL BLEDSOE (3523 EVENING LIGHT DRIVE in BARTLETT, TN; small business) : $21,056 in 3 contractsfrom 2002 to 2006
$11,152 with Army for Operation of Government-Owned Facilities -- Other Non-Building Facilities. Signed on 2006-02-07. Completion date: 2007-02-06.
$9,072 with U.S. Army Corps of Engineers - civil program financing only for Other Housekeeping Services. Taking place in MO. Signed on 2002-02-25. Completion date: 2002-09-30.
$832, same as above.Signed on 2002-10-01. Completion date: 2002-09-30.
JAMES R WADE, SR (3607 MARIETTA BLVD in BARTLETT, TN; small business)
$10,965 with U.S. Army Corps of Engineers - civil program financing only for Recreation Site Maintenance Services (non-construction). Taking place in GA. Signed on 2001-03-22. Completion date: 2001-09-18.
KAREN SOUTH (6014 LAWNHILL DR in BARTLETT, TN; small business)
$10,750 with Navy for Other Professional Services. Signed on 2004-10-26. Completion date: 2005-09-30.
HALL, GAYLON S (4100 PERSIMMON VIEW COVE in BARTLETT, TN; small business)
$10,000 with Army for Certifications and Accreditations for Educational Institutions. Signed on 2003-10-24. Completion date: 2003-10-29.
TRAFFIC ASSOCIATED MARKING SYS (6247 SKYLIGHT DR in BARTLETT, TN; small business)
$4,880 with Army for Maintenance, Repair or Alteration of Real Property -- Other Airfield Structures. Signed on 2004-08-25. Completion date: 2004-08-30.
SIMPSON CONSTRUCTION, LLC (6171 CALLA COVE in BARTLETT, TN; small business)
$4,572 with Navy for Maintenance, Repair or Alteration of Real Property -- Other Residential Buildings. Signed on 2002-09-12. Completion date: 2002-11-12.
Top industries in this zip code by the number of employees in 2005:
Health Care and Social Assistance: Residential Mental Health and Substance Abuse Facilities (250-499 employees: 1 establishment)
Health Care and Social Assistance: Nursing Care Facilities (100-249: 1)
Other Services (except Public Administration): Religious Organizations (50-99: 1, 20-49: 1, 5-9: 6, 1-4: 1)
Health Care and Social Assistance: Offices of Physicians (except Mental Health Specialists) (20-49: 3, 10-19: 1, 1-4: 1)
Construction: Commercial and Institutional Building Construction (50-99: 1, 1-4: 1)
Construction: Masonry Contractors (20-49: 2)
Administrative and Support and Waste Management and Remediation Services: Janitorial Services (20-49: 1, 10-19: 1, 5-9: 1, 1-4: 1)
2002 - 2018 National Fire Incident Reporting System (NFIRS) incidents
According to the data from the years 2002 - 2018 the average number of fire incidents per year is 33. The highest number of fires - 60 took place in 2015, and the least - 20 in 2012. The data has a growing trend.
When looking into fire subcategories, the most incidents belonged to: Outside Fires (45.5%), and Structure Fires (30.8%).
Fire incident types reported to NFIRS in Zip Code 38135


 Nearest zip codes: 38029, 38133, 38134, 38128, 38054, 38016.
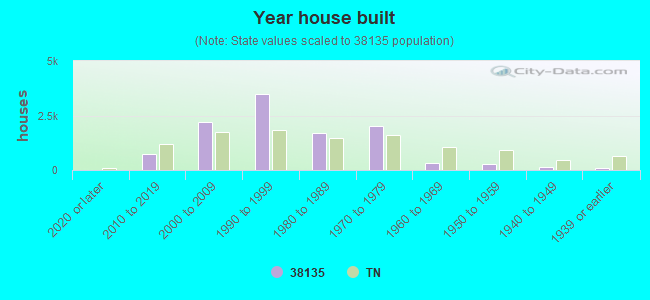


 According to the data from the years 2002 - 2018 the average number of fire incidents per year is 33. The highest number of fires - 60 took place in 2015, and the least - 20 in 2012. The data has a growing trend.
 When looking into fire subcategories, the most incidents belonged to: Outside Fires (45.5%), and Structure Fires (30.8%).