Estimated zip code population in 2022: 3,495 Zip code population in 2010: 2,751 Zip code population in 2000: 2,797
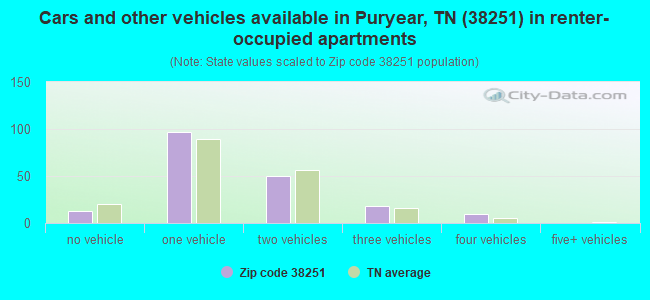
Houses and condos: 1,432 Renter-occupied apartments: 186
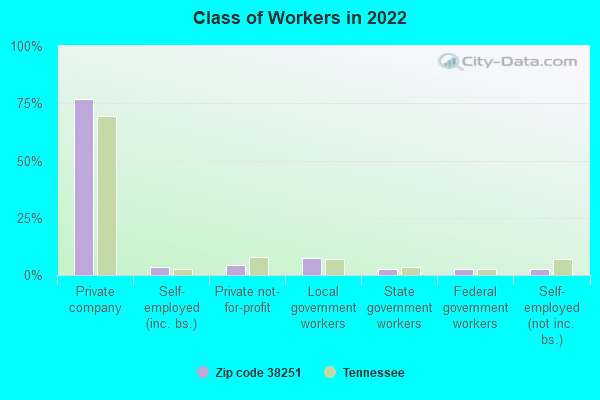
% of renters here:
14%
State:
33%
March 2022 cost of living index in zip code 38251: 78.1 (low, U.S. average is 100)
Land area: 89.3 sq. mi. Water area: 0.1 sq. mi.
Population density: 39 people per square mile
(very low).
OSM Map
General Map
Google Map
MSN Map
OSM Map
General Map
Google Map
MSN Map
OSM Map
General Map
Google Map
MSN Map
OSM Map
General Map
Google Map
MSN Map
Please wait while loading the map...
Real estate property taxes paid for housing units in 2022:
This zip code:
0.4% ($542)
Tennessee:
0.5% ($1,376)
Median real estate property taxes paid for housing units with mortgages in 2022: $506 (0.3%) Median real estate property taxes paid for housing units with no mortgage in 2022: $574 (0.4%)
Business Search- 14 Million verified businesses
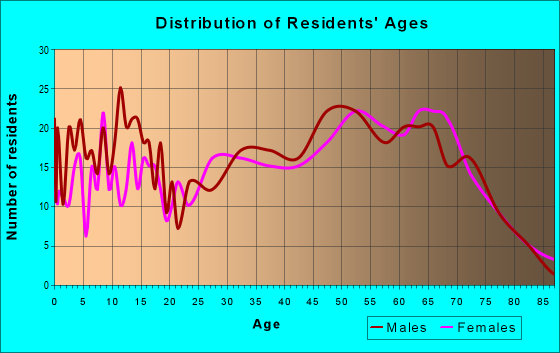
Males: 1,770
(50.7%)
Females: 1,724
(49.3%)
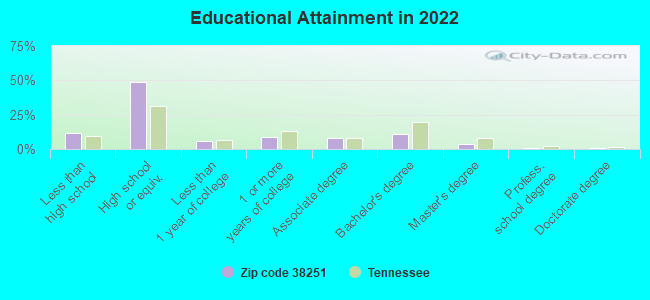
For population 25 years and over in 38251:
High school or higher: 87.2%
Bachelor's degree or higher: 16.2%
Graduate or professional degree: 5.4%
Unemployed: 8.4%
Mean travel time to work (commute): 34.4 minutes
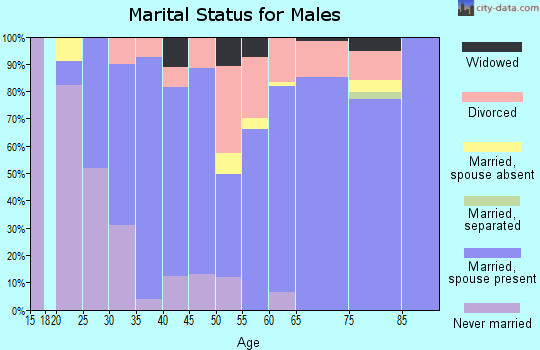
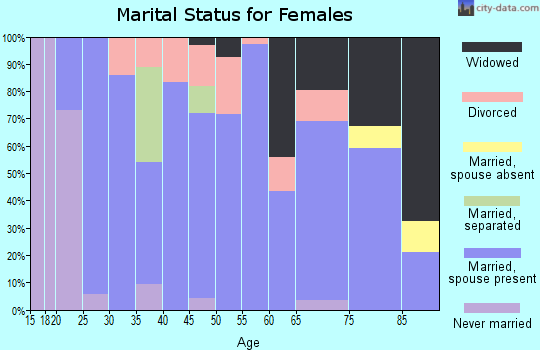
For population 15 years and over in 38251:
Never married: 26.7%
Now married: 47.0%
Separated: 5.4%
Widowed: 9.4%
Divorced: 11.5%
Zip code 38251 compared to state average:
Median house value below state average.
Unemployed percentage above state average.
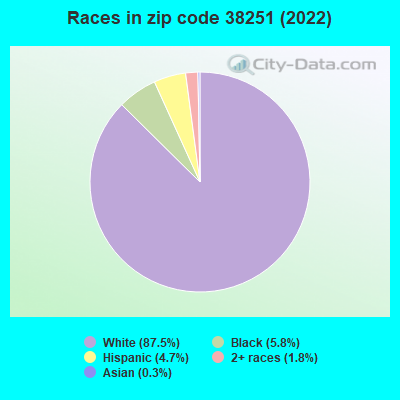
Black race population percentage below state average.
Median age above state average.
Foreign-born population percentage significantly below state average.
Renting percentage significantly below state average.
Length of stay since moving in significantly above state average.
Number of college students significantly below state average.
Percentage of population with a bachelor's degree or higher below state average.
Estimated median house/condo value in 2022: $144,057
38251:
$144,057
Tennessee:
$284,800
According to our research of Tennessee and other state lists, there were 8 registered sex offenders living in 38251 zip code as of April 27, 2024. The ratio of all residents to sex offenders in zip code 38251 is 334 to 1. The ratio of registered sex offenders to all residents in this zip code is near the state average.
Median resident age:
This zip code:
47.1 years
Tennessee median age:
39.2 years
Average household size:
This zip code:
2.5 people
Tennessee:
2.4 people
Averages for the 2020 tax year for zip code 38251, filed in 2021:
Average Adjusted Gross Income (AGI) in 2020: $48,280 (Individual Income Tax Returns)
Here:
$48,280
State:
$69,014
Salary/wage: $40,450 (reported on 79.7% of returns)
Here:
$40,450
State:
$55,872
(% of AGI for various income ranges: 1420.9% for AGIs below $25k, 3204.3% for AGIs $25k-50k, 6375.8% for AGIs $50k-75k, 8076.2% for AGIs $75k-100k, 18147.1% for AGIs $100k-200k)
Taxable interest for individuals: $1,326 (reported on 27.3% of returns)
This zip code:
$1,326
Tennessee:
$1,945
(% of AGI for various income ranges: 17.1% for AGIs below $25k, 11.3% for AGIs $25k-50k, 47.5% for AGIs $50k-75k, 156.2% for AGIs $75k-100k, 271.4% for AGIs $100k-200k)
Ordinary dividends: $2,053 (reported on 13.3% of returns)
Here:
$2,053
State:
$8,105
(% of AGI for various income ranges: 22.1% for AGIs below $25k, 17.0% for AGIs $25k-50k, 26.7% for AGIs $50k-75k, 20.0% for AGIs $75k-100k, 250.0% for AGIs $100k-200k)
Net capital gain/loss in AGI: +$8,944 (reported on 12.5% of returns)
Here:
+$8,944
State:
+$33,664
(% of AGI for various income ranges: 10.6% for AGIs below $25k, 14.7% for AGIs $25k-50k, 179.2% for AGIs $50k-75k, 1622.9% for AGIs $100k-200k)
Profit/loss from business: +$7,753 (reported on 13.3% of returns)
Here:
+$7,753
State:
+$18,991
(% of AGI for various income ranges: 120.0% for AGIs below $25k, 103.0% for AGIs $25k-50k, 335.8% for AGIs $50k-75k, 282.9% for AGIs $100k-200k)
Taxable individual retirement arrangement distribution: $12,782 (reported on 8.6% of returns)
38251:
$12,782
Tennessee:
$20,036
(% of AGI for various income ranges: 68.8% for AGIs below $25k, 145.3% for AGIs $25k-50k, 920.0% for AGIs $75k-100k)
Earned income credit: $2,371 (reported on 21.9% of returns)
Here:
$2,371
State:
$2,391
(% of AGI for various income ranges: 120.0% for AGIs below $25k, 85.3% for AGIs $25k-50k)
Percentage of individuals using paid preparers for their 2020 taxes: 94.5%
Here:
95%
State:
93%
(% for various income ranges: 92.2% for AGIs below $25k, 97.2% for AGIs $25k-50k, 94.1% for AGIs $50k-75k, 90.9% for AGIs $75k-100k, 100.0% for AGIs $100k-200k, 100.0% for AGIs over 200k)
Averages for the 2012 tax year for zip code 38251, filed in 2013:
Average Adjusted Gross Income (AGI) in 2012: $38,195 (Individual Income Tax Returns)
Here:
$38,195
State:
$53,767
Salary/wage: $33,358 (reported on 78.5% of returns)
Here:
$33,358
State:
$45,421
(% of AGI for various income ranges: 69.3% for AGIs below $25k, 78.1% for AGIs $25k-50k, 75.0% for AGIs $50k-75k, 70.0% for AGIs $75k-100k, 49.8% for AGIs $100k-200k)
Taxable interest for individuals: $1,187 (reported on 32.2% of returns)
This zip code:
$1,187
Tennessee:
$1,732
(% of AGI for various income ranges: 2.2% for AGIs below $25k, 0.7% for AGIs $25k-50k, 0.5% for AGIs $50k-75k, 0.5% for AGIs $75k-100k, 1.4% for AGIs $100k-200k)
Ordinary dividends: $1,512 (reported on 14.0% of returns)
Here:
$1,512
State:
$6,739
(% of AGI for various income ranges: 1.2% for AGIs below $25k, 0.4% for AGIs $25k-50k, 0.6% for AGIs $50k-75k, 0.2% for AGIs $75k-100k, 0.6% for AGIs $100k-200k)
Net capital gain/loss in AGI: +$3,369 (reported on 13.2% of returns)
Here:
+$3,369
State:
+$19,082
(% of AGI for various income ranges: 0.3% for AGIs below $25k, 0.7% for AGIs $25k-50k, 0.9% for AGIs $50k-75k, 0.4% for AGIs $75k-100k, 3.2% for AGIs $100k-200k)
Profit/loss from business: +$6,753 (reported on 15.7% of returns)
Here:
+$6,753
State:
+$15,240
(% of AGI for various income ranges: 6.7% for AGIs below $25k, 1.8% for AGIs $25k-50k, 0.9% for AGIs $50k-75k, 6.3% for AGIs $75k-100k)
Taxable individual retirement arrangement distribution: $10,838 (reported on 10.7% of returns)
38251:
$10,838
Tennessee:
$15,505
(% of AGI for various income ranges: 2.8% for AGIs below $25k, 3.0% for AGIs $25k-50k, 3.1% for AGIs $50k-75k, 7.2% for AGIs $75k-100k)
Total itemized deductions: $17,612 (24% of AGI, reported on 13.2% of returns)
Here:
$17,612
State:
$21,976
Here:
23.7% of AGI
State:
17.8% of AGI
(% of AGI for various income ranges: 3.8% for AGIs below $25k, 6.3% for AGIs $25k-50k, 6.5% for AGIs $50k-75k, 6.6% for AGIs $75k-100k, 6.7% for AGIs $100k-200k)
Charity contributions: $4,631 (reported on 10.7% of returns)
Here:
$4,631
State:
$6,709
(% of AGI for various income ranges: 1.2% for AGIs $25k-50k, 1.5% for AGIs $50k-75k, 1.7% for AGIs $75k-100k, 1.9% for AGIs $100k-200k)
Taxes paid: $3,081 (reported on 13.2% of returns)
38251:
$3,081
State:
$4,829
(% of AGI for various income ranges: 0.6% for AGIs below $25k, 0.8% for AGIs $25k-50k, 1.1% for AGIs $50k-75k, 1.2% for AGIs $75k-100k, 1.6% for AGIs $100k-200k)
Earned income credit: $2,369 (reported on 24.0% of returns)
Here:
$2,369
State:
$2,404
(% of AGI for various income ranges: 7.4% for AGIs below $25k, 1.2% for AGIs $25k-50k)
Percentage of individuals using paid preparers for their 2012 taxes: 60.3%
Here:
60%
State:
52%
(% for various income ranges: 56.9% for AGIs below $25k, 60.6% for AGIs $25k-50k, 60.0% for AGIs $50k-75k, 66.7% for AGIs $75k-100k, 83.3% for AGIs $100k-200k)
Averages for the 2004 tax year for zip code 38251, filed in 2005:
Average Adjusted Gross Income (AGI) in 2004: $31,344 (Individual Income Tax Returns)
Here:
$31,344
State:
$44,088
Salary/wage: $29,214 (reported on 81.3% of returns)
Here:
$29,214
State:
$38,825
(% of AGI for various income ranges: 73.6% for AGIs $10k-25k, 80.2% for AGIs $25k-50k, 80.6% for AGIs $50k-75k, 74.5% for AGIs $75k-100k, 43.1% for AGIs over 100k)
Taxable interest for individuals: $1,829 (reported on 35.7% of returns)
This zip code:
$1,829
Tennessee:
$1,802
(% of AGI for various income ranges: 3.5% for AGIs $10k-25k, 1.6% for AGIs $25k-50k, 1.8% for AGIs $50k-75k, 1.2% for AGIs $75k-100k, 1.5% for AGIs over 100k)
Taxable dividends: $1,433 (reported on 14.9% of returns)
Here:
$1,433
State:
$3,727
(% of AGI for various income ranges: 0.8% for AGIs $10k-25k, 0.5% for AGIs $25k-50k, 0.7% for AGIs $50k-75k, 1.7% for AGIs $75k-100k)
Net capital gain/loss: +$1,870 (reported on 13.5% of returns)
Here:
+$1,870
State:
+$15,776
(% of AGI for various income ranges: 0.1% for AGIs $10k-25k, 0.5% for AGIs $25k-50k, 0.8% for AGIs $50k-75k, 3.0% for AGIs $75k-100k)
Profit/loss from business: +$6,231 (reported on 16.3% of returns)
Here:
+$6,231
State:
+$12,882
(% of AGI for various income ranges: 6.3% for AGIs $10k-25k, 2.9% for AGIs $25k-50k, 1.1% for AGIs $50k-75k, 7.9% for AGIs $75k-100k)
IRA payment deduction: $2,696 (reported on 1.9% of returns)
38251:
$2,696
Tennessee:
$2,934
Total itemized deductions: $14,183 (27% of AGI, reported on 12.8% of returns)
Here:
$14,183
State:
$18,035
Here:
27.2% of AGI
State:
19.9% of AGI
(% of AGI for various income ranges: 5.9% for AGIs $10k-25k, 5.4% for AGIs $25k-50k, 7.0% for AGIs $50k-75k, 12.8% for AGIs $75k-100k)
Charity contributions deductions: $3,561 (6% of AGI, reported on 10.3% of returns)
Here:
$3,561
State:
$5,167
Here:
6.4% of AGI
State:
5.3% of AGI
(% of AGI for various income ranges: 0.5% for AGIs $10k-25k, 1.0% for AGIs $25k-50k, 1.7% for AGIs $50k-75k, 3.3% for AGIs $75k-100k)
Total tax: $3,709 (reported on 71.1% of returns)
38251:
$3,709
State:
$7,482
(% of AGI for various income ranges: 3.9% for AGIs $10k-25k, 6.3% for AGIs $25k-50k, 8.5% for AGIs $50k-75k, 12.5% for AGIs $75k-100k, 14.2% for AGIs over 100k)
Earned income credit: $1,741 (reported on 22.6% of returns)
Here:
$1,741
State:
$1,826
Percentage of individuals using paid preparers for their 2004 taxes: 71.7%
Here:
72%
State:
60%
(% for various income ranges: 67.4% for AGIs below $10k, 71.6% for AGIs $10k-25k, 71.4% for AGIs $25k-50k, 76.3% for AGIs $50k-75k, 73.3% for AGIs $75k-100k, 95.7% for AGIs over 100k)
Likely homosexual households (counted as self-reported same-sex unmarried-partner households)
Lesbian couples: 0.8% of all households
Gay men: 0.2% of all households
Household received Food Stamps/SNAP in the past 12 months: 154 Household did not receive Food Stamps/SNAP in the past 12 months: 1,204
Women who had a birth in the past 12 months: 7 (8 now married, 0 unmarried) Women who did not have a birth in the past 12 months: 560 (267 now married, 292 unmarried)
Housing units in zip code 38251 with a mortgage: 463 (26 second mortgage, 26 both second mortgage and home equity loan) Houses without a mortgage: 6
Median monthly owner costs for units with a mortgage: $991 Median monthly owner costs for units without a mortgage: $292
Residents with income below the poverty level in 2022:
This zip code:
15.6%
Whole state:
13.3%
Residents with income below 50% of the poverty level in 2022:
This zip code:
9.2%
Whole state:
7.1%
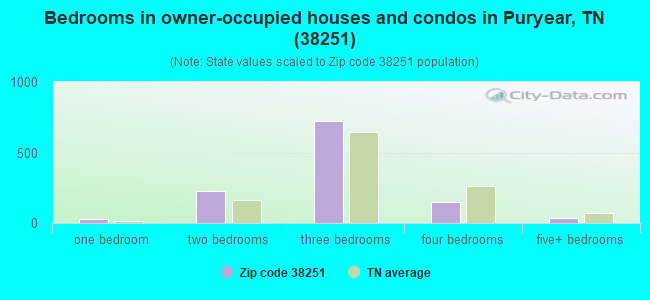
Median number of rooms in houses and condos:
Here:
5.8
State:
6.5
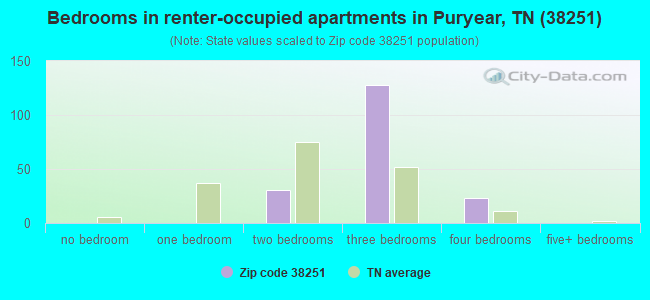
Median number of rooms in apartments:
Here:
5.2
State:
4.4
Notable locations in this zip code not listed on our city pages
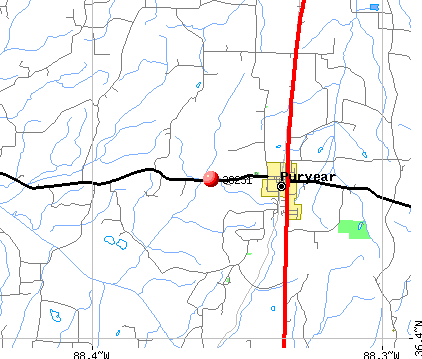
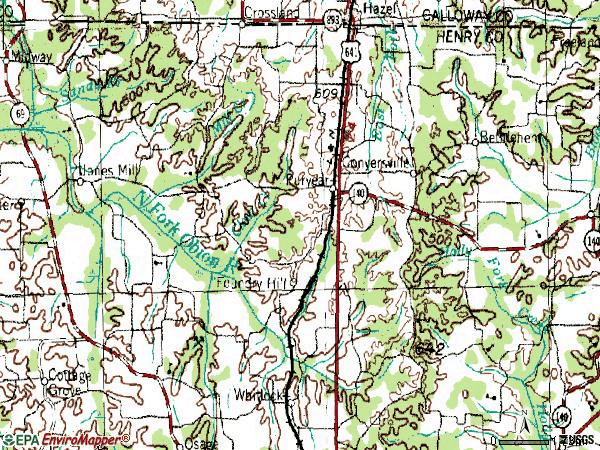
Notable locations in zip code 38251: Kentucky-Tennessee Spur (A), Spinks Spur (B), Puryear Volunteer Fire Department (C). Display/hide their locations on the map
Churches in zip code 38251 include: Lebanon Church (A), Old Foundry Hill Church (B), Latterday Saints Church (C), Union Grove Church (D), Hico Church (E), Chestnut Grove Church (F), Oak Grove Church (G), North Fork Church (H), Mount Zion Church (I). Display/hide their locations on the map
Cemeteries: Underwood Cemetery (1), Jones Cemetery (2), Kennerly Cemetery (3), King Cemetery (4), Kuykendall Cemetery (5), Wilson Cemetery (6), Yow Cemetery (7). Display/hide their locations on the map
Streams, rivers, and creeks: Dry Creek (A), Clear Creek (B), Birds Creek (C), Phillips Creek (D), Sandy Branch (E), Mormon Branch (F), Mill Creek (G), Rowe Creek (H), Sugar Creek (I). Display/hide their locations on the map
In group quarters: 67 (-1 institutionalized population)
Size of family households: 498 2-persons, 133 3-persons, 148 4-persons, 97 5-persons, 16 6-persons, 3 7-or-more-persons
Size of nonfamily households: 436 1-person, 2 2-persons, 19 4-persons
482 married couples with children.
140 single-parent households (19 men, 121 women).
97.5% of residents of 38251 zip code speak English at home.
2.2% of residents speak Spanish at home (58% very well, 24% well, 18% not well).
0.3% of residents speak Asian or Pacific Island language at home (100% very well).
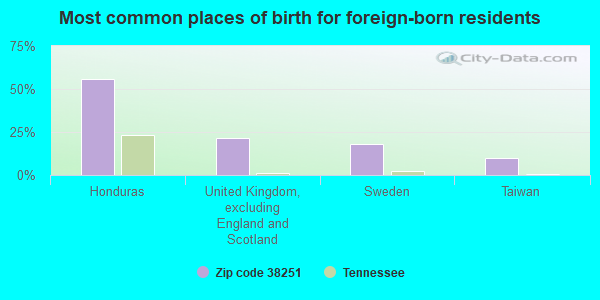
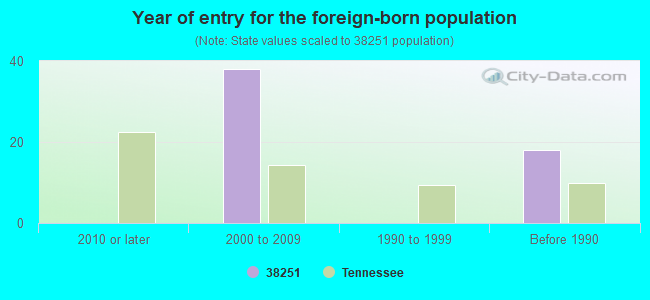
Foreign born population: 61 (1.8%) (35.2% of them are naturalized citizens)
This zip code:
1.8%
Whole state:
5.6%
56%Honduras
21%United Kingdom, excluding England and Scotland
18%Sweden
10%Taiwan
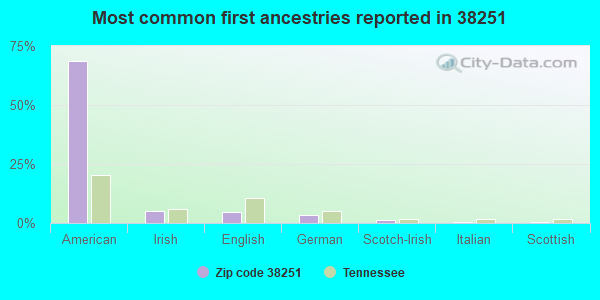
68%American
5%Irish
5%English
3%German
1%Scotch-Irish
1%Italian
1%Scottish
Year of entry for the foreign-born population
02010 or later
382000 to 2009
01990 to 1999
18Before 1990
Facilities with environmental interests located in this zip code:
BI-STATE GRAIN ELEVATOR, INC. (CHESTNUT STREET in PURYEAR, TN)
AIR MINOR (AIRS/AFS) Business SIC classification: CROP PREPARATION SERVICES FOR MARKET, EXCEPT COTTON GINNING
Housing units lacking complete kitchen facilities: 2.6%
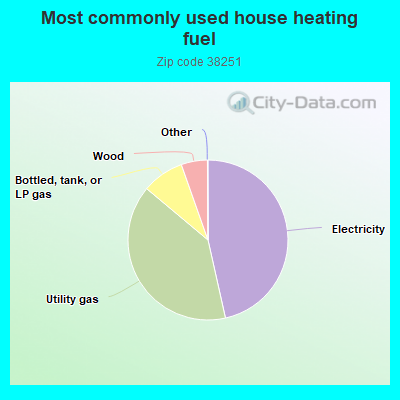
46.5%Electricity
39.6%Utility gas
8.5%Bottled, tank, or LP gas
5.3%Wood
Population in 1990: 2,292. Population change in the 1990s: +505 (+22.0%).
Place of birth for U.S.-born residents:
This state: 1,515
Northeast: 44
Midwest: 578
South: 1,221
West: 68
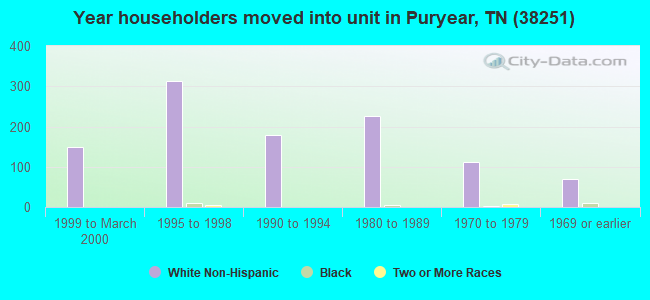
60% of the 38251 zip code residents lived in the same house 5 years ago. Out of people who lived in different houses, 53% lived in this county. Out of people who lived in different counties, 50% lived in Tennessee.
95% of the 38251 zip code residents lived in the same house 1 year ago. Out of people who lived in different houses, 64% moved from this county. Out of people who lived in different houses, 3% moved from different county within same state. Out of people who lived in different houses, 36% moved from different state.
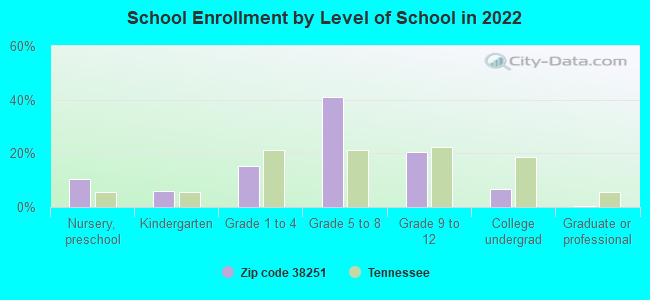
Private vs. public school enrollment:
Students in private schools in grades 1 to 8 (elementary and middle school): 21
Here:
6.5%
Tennessee:
15.0%
Students in private schools in grades 9 to 12 (high school): 4
Here:
3.7%
Tennessee:
16.2%
Students in private undergraduate colleges: 12
Here:
30.9%
Tennessee:
23.5%
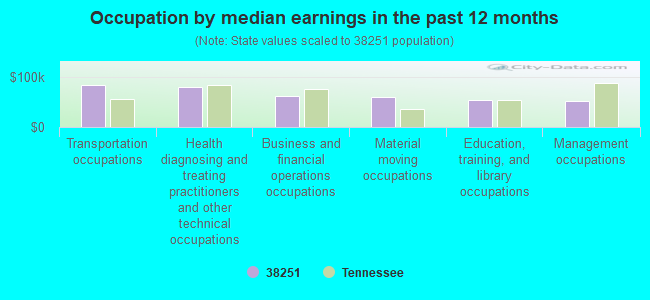
Occupation by median earnings in the past 12 months ($)
83,850Transportation occupations
78,800Health diagnosing and treating practitioners and other technical occupations
62,377Business and financial operations occupations
59,636Material moving occupations
54,098Education, training, and library occupations
51,848Management occupations
Companies with federal contracts located in this zip code:
TAYLOR MOTORS, INC (4630 JONES MILL CROSSLAND in PURYEAR, TN; small business) : $20,012,070 in 276 contractsfrom 1999 to 2006
Contracts for Motor Passenger Services, Other Transportation Travel and Relocation Services, Other Vehicle Charter for Transportation of Things, Education Services, and moreby Army, Department of Defense, Air Force Signed by year:2000: $851,462; 2001: $2,055,953; 2002: $3,120,303; 2003: $4,094,757; 2004: $3,528,394; 2005: $3,584,284; 2006: $2,144,955.
Biggest contracts:
$975,084 with Army for Motor Passenger Services. Taking place in KY. Signed on 2006-06-20. Effective on 2006-06-21. Completion date: 2007-06-30.
$761,111 with Army for Other Transportation Travel and Relocation Services. Taking place in KY. Signed on 2003-10-15. Completion date: 2002-09-30.
$624,963, same as above.Signed on 2001-11-01. Completion date: 2002-09-30.
$537,539, same as above.Signed on 1999-10-07. Completion date: 2000-09-30.
Top industries in this zip code by the number of employees in 2005:
Health Care and Social Assistance: Nursing Care Facilities (20-49: 1)
Accommodation and Food Services: Limited-Service Restaurants (5-9: 1)
People in group quarters in 2010:
27 people in nursing facilities/skilled-nursing facilities
11 people in group homes intended for adults
People in group quarters in 2000:
23 people in nursing homes
Fatal accident statistics in 2012:
Fatal accident count: 1
Vehicles involved in fatal accidents: 1
Fatal accidents caused by drunken drivers: 0
Fatalities: 1
Persons involved in fatal accidents: 1
Pedestrians involved in fatal accidents: 0
Fatal accident statistics in 2011:
Fatal accident count: 1
Vehicles involved in fatal accidents: 2
Fatal accidents caused by drunken drivers: 0
Fatalities: 2
Persons involved in fatal accidents: 2
Pedestrians involved in fatal accidents: 0
2002 - 2018 National Fire Incident Reporting System (NFIRS) incidents
According to the data from the years 2002 - 2018 the average number of fires per year is 8. The highest number of reported fire incidents - 20 took place in 2007, and the least - 1 in 2013. The data has a rising trend.
When looking into fire subcategories, the most incidents belonged to: Outside Fires (42.1%), and Structure Fires (32.1%).
Fire incident types reported to NFIRS in Zip Code 38251
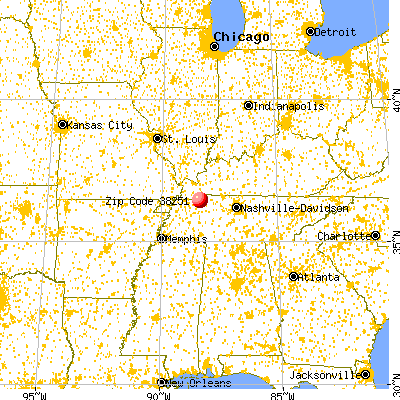


 Nearest zip codes: 42049, 38224, 38242, 42071, 38222, 42040.


 According to the data from the years 2002 - 2018 the average number of fires per year is 8. The highest number of reported fire incidents - 20 took place in 2007, and the least - 1 in 2013. The data has a rising trend.
 When looking into fire subcategories, the most incidents belonged to: Outside Fires (42.1%), and Structure Fires (32.1%).