Estimated zip code population in 2022: 7,417 Zip code population in 2010: 6,543 Zip code population in 2000: 5,908
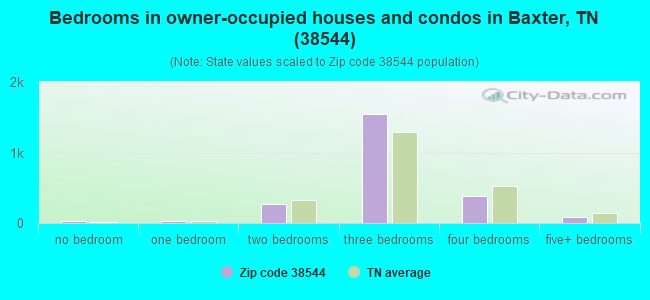
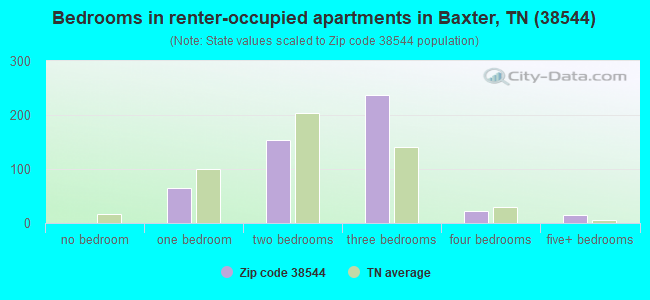
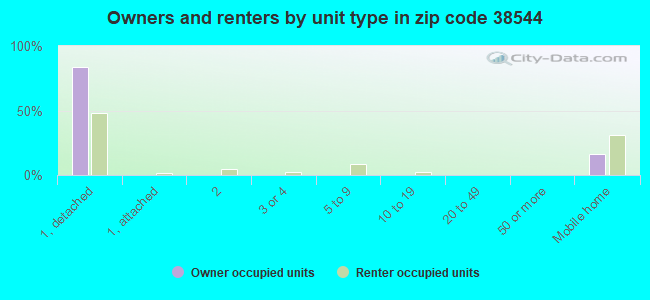
Houses and condos: 3,358 Renter-occupied apartments: 501
% of renters here:
18%
State:
33%
March 2022 cost of living index in zip code 38544: 79.7 (low, U.S. average is 100)
Land area: 82.9 sq. mi. Water area: 2.9 sq. mi.
Population density: 89 people per square mile
(very low).
OSM Map
General Map
Google Map
MSN Map
OSM Map
General Map
Google Map
MSN Map
OSM Map
General Map
Google Map
MSN Map
OSM Map
General Map
Google Map
MSN Map
Please wait while loading the map...
Real estate property taxes paid for housing units in 2022:
This zip code:
0.4% ($1,044)
Tennessee:
0.5% ($1,376)
Median real estate property taxes paid for housing units with mortgages in 2022: $1,244 (0.4%) Median real estate property taxes paid for housing units with no mortgage in 2022: $924 (0.4%)
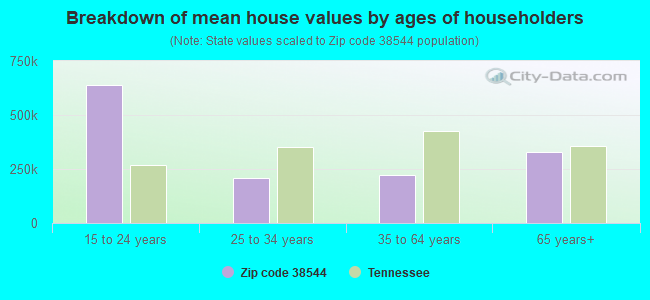
Estimated median house/condo value in 2022: $241,485
38544:
$241,485
Tennessee:
$284,800
According to our research of Tennessee and other state lists, there were 16 registered sex offenders living in 38544 zip code as of April 27, 2024. The ratio of all residents to sex offenders in zip code 38544 is 412 to 1. The ratio of registered sex offenders to all residents in this zip code is near the state average.
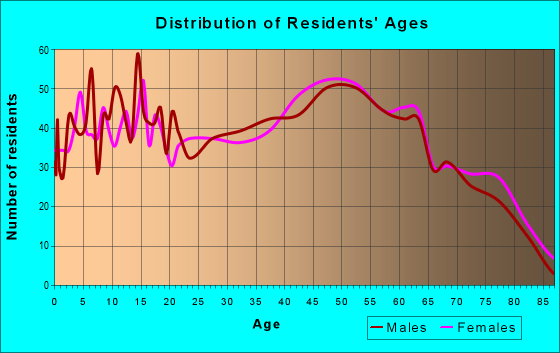
Median resident age:
This zip code:
40.0 years
Tennessee median age:
39.2 years
Average household size:
This zip code:
2.6 people
Tennessee:
2.4 people
Averages for the 2020 tax year for zip code 38544, filed in 2021:
Average Adjusted Gross Income (AGI) in 2020: $50,840 (Individual Income Tax Returns)
Here:
$50,840
State:
$69,014
Salary/wage: $45,043 (reported on 82.0% of returns)
Here:
$45,043
State:
$55,872
(% of AGI for various income ranges: 1058.1% for AGIs below $25k, 3321.9% for AGIs $25k-50k, 6376.5% for AGIs $50k-75k, 8952.8% for AGIs $75k-100k, 13462.0% for AGIs $100k-200k)
Taxable interest for individuals: $1,130 (reported on 27.8% of returns)
This zip code:
$1,130
Tennessee:
$1,945
(% of AGI for various income ranges: 21.9% for AGIs below $25k, 15.4% for AGIs $25k-50k, 20.5% for AGIs $50k-75k, 19.6% for AGIs $75k-100k, 122.0% for AGIs $100k-200k)
Ordinary dividends: $1,969 (reported on 10.4% of returns)
Here:
$1,969
State:
$8,105
(% of AGI for various income ranges: 7.6% for AGIs below $25k, 10.1% for AGIs $25k-50k, 17.3% for AGIs $50k-75k, 29.2% for AGIs $75k-100k, 126.0% for AGIs $100k-200k)
Net capital gain/loss in AGI: +$19,751 (reported on 10.9% of returns)
Here:
+$19,751
State:
+$33,664
(% of AGI for various income ranges: 8.4% for AGIs below $25k, 32.4% for AGIs $25k-50k, 52.2% for AGIs $50k-75k, 100.0% for AGIs $75k-100k, 604.4% for AGIs $100k-200k)
Profit/loss from business: +$14,082 (reported on 18.3% of returns)
Here:
+$14,082
State:
+$18,991
(% of AGI for various income ranges: 179.2% for AGIs below $25k, 133.7% for AGIs $25k-50k, 214.3% for AGIs $50k-75k, 338.4% for AGIs $75k-100k, 1719.2% for AGIs $100k-200k)
Taxable individual retirement arrangement distribution: $17,542 (reported on 7.7% of returns)
38544:
$17,542
Tennessee:
$20,036
(% of AGI for various income ranges: 38.2% for AGIs below $25k, 102.2% for AGIs $25k-50k, 182.2% for AGIs $50k-75k, 216.8% for AGIs $75k-100k, 866.8% for AGIs $100k-200k)
Total itemized deductions: $33,422 (reported on 2.7% of returns)
Here:
$33,422
State:
$40,136
(% of AGI for various income ranges: 265.9% for AGIs $50k-75k, 809.6% for AGIs $100k-200k)
Charity contributions: $23,567 (reported on 1.8% of returns)
Here:
$23,567
State:
$19,852
(% of AGI for various income ranges: 25.9% for AGIs $25k-50k, 483.6% for AGIs $100k-200k)
Taxes paid: $5,314 (reported on 2.1% of returns)
38544:
$5,314
State:
$6,038
(% of AGI for various income ranges: 18.4% for AGIs $25k-50k, 90.8% for AGIs $100k-200k)
Earned income credit: $2,231 (reported on 22.2% of returns)
Here:
$2,231
State:
$2,391
(% of AGI for various income ranges: 106.9% for AGIs below $25k, 80.5% for AGIs $25k-50k)
Percentage of individuals using paid preparers for their 2020 taxes: 95.6%
Here:
96%
State:
93%
(% for various income ranges: 94.4% for AGIs below $25k, 97.8% for AGIs $25k-50k, 95.7% for AGIs $50k-75k, 96.9% for AGIs $75k-100k, 94.3% for AGIs $100k-200k, 85.7% for AGIs over 200k)
Averages for the 2012 tax year for zip code 38544, filed in 2013:
Average Adjusted Gross Income (AGI) in 2012: $39,075 (Individual Income Tax Returns)
Here:
$39,075
State:
$53,767
Salary/wage: $36,465 (reported on 82.7% of returns)
Here:
$36,465
State:
$45,421
(% of AGI for various income ranges: 71.0% for AGIs below $25k, 80.8% for AGIs $25k-50k, 84.1% for AGIs $50k-75k, 80.5% for AGIs $75k-100k, 68.3% for AGIs $100k-200k)
Taxable interest for individuals: $1,173 (reported on 27.7% of returns)
This zip code:
$1,173
Tennessee:
$1,732
(% of AGI for various income ranges: 1.2% for AGIs below $25k, 0.7% for AGIs $25k-50k, 0.4% for AGIs $50k-75k, 0.5% for AGIs $75k-100k, 1.3% for AGIs $100k-200k)
Ordinary dividends: $1,428 (reported on 9.2% of returns)
Here:
$1,428
State:
$6,739
(% of AGI for various income ranges: 0.5% for AGIs below $25k, 0.4% for AGIs $25k-50k, 0.2% for AGIs $50k-75k, 0.1% for AGIs $75k-100k, 0.4% for AGIs $100k-200k)
Net capital gain/loss in AGI: +$1,891 (reported on 8.5% of returns)
Here:
+$1,891
State:
+$19,082
(% of AGI for various income ranges: 0.5% for AGIs $25k-50k, 0.9% for AGIs $50k-75k, 0.3% for AGIs $75k-100k, 0.4% for AGIs $100k-200k)
Profit/loss from business: +$8,331 (reported on 20.3% of returns)
Here:
+$8,331
State:
+$15,240
(% of AGI for various income ranges: 12.0% for AGIs below $25k, 2.3% for AGIs $25k-50k, 3.0% for AGIs $50k-75k, 2.3% for AGIs $75k-100k, 3.8% for AGIs $100k-200k)
Taxable individual retirement arrangement distribution: $11,404 (reported on 8.5% of returns)
38544:
$11,404
Tennessee:
$15,505
(% of AGI for various income ranges: 2.7% for AGIs below $25k, 2.3% for AGIs $25k-50k, 1.6% for AGIs $50k-75k, 2.3% for AGIs $75k-100k, 3.5% for AGIs $100k-200k)
Total itemized deductions: $19,518 (22% of AGI, reported on 14.8% of returns)
Here:
$19,518
State:
$21,976
Here:
22.4% of AGI
State:
17.8% of AGI
(% of AGI for various income ranges: 2.4% for AGIs below $25k, 6.5% for AGIs $25k-50k, 7.2% for AGIs $50k-75k, 9.5% for AGIs $75k-100k, 10.6% for AGIs $100k-200k)
Charity contributions: $4,762 (reported on 10.7% of returns)
Here:
$4,762
State:
$6,709
(% of AGI for various income ranges: 0.8% for AGIs $25k-50k, 1.0% for AGIs $50k-75k, 1.7% for AGIs $75k-100k, 2.8% for AGIs $100k-200k)
Taxes paid: $3,192 (reported on 14.8% of returns)
38544:
$3,192
State:
$4,829
(% of AGI for various income ranges: 0.2% for AGIs below $25k, 0.9% for AGIs $25k-50k, 1.1% for AGIs $50k-75k, 1.7% for AGIs $75k-100k, 2.0% for AGIs $100k-200k)
Earned income credit: $2,400 (reported on 27.3% of returns)
Here:
$2,400
State:
$2,404
(% of AGI for various income ranges: 8.3% for AGIs below $25k, 1.4% for AGIs $25k-50k)
Percentage of individuals using paid preparers for their 2012 taxes: 66.4%
Here:
66%
State:
52%
(% for various income ranges: 65.1% for AGIs below $25k, 66.7% for AGIs $25k-50k, 68.4% for AGIs $50k-75k, 68.4% for AGIs $75k-100k, 69.2% for AGIs $100k-200k)
Averages for the 2004 tax year for zip code 38544, filed in 2005:
Average Adjusted Gross Income (AGI) in 2004: $30,996 (Individual Income Tax Returns)
Here:
$30,996
State:
$44,088
Salary/wage: $29,014 (reported on 85.0% of returns)
Here:
$29,014
State:
$38,825
(% of AGI for various income ranges: 97.8% for AGIs below $10k, 79.3% for AGIs $10k-25k, 85.9% for AGIs $25k-50k, 88.4% for AGIs $50k-75k, 83.2% for AGIs $75k-100k, 49.5% for AGIs over 100k)
Taxable interest for individuals: $1,485 (reported on 32.4% of returns)
This zip code:
$1,485
Tennessee:
$1,802
(% of AGI for various income ranges: 3.7% for AGIs below $10k, 2.1% for AGIs $10k-25k, 1.4% for AGIs $25k-50k, 1.0% for AGIs $50k-75k, 1.5% for AGIs $75k-100k, 1.7% for AGIs over 100k)
Taxable dividends: $1,337 (reported on 11.1% of returns)
Here:
$1,337
State:
$3,727
(% of AGI for various income ranges: 0.9% for AGIs below $10k, 0.4% for AGIs $10k-25k, 0.3% for AGIs $25k-50k, 0.1% for AGIs $50k-75k, 0.2% for AGIs $75k-100k, 1.5% for AGIs over 100k)
Net capital gain/loss: +$7,208 (reported on 9.7% of returns)
Here:
+$7,208
State:
+$15,776
(% of AGI for various income ranges: -0.0% for AGIs below $10k, 0.4% for AGIs $10k-25k, 0.7% for AGIs $25k-50k, 1.0% for AGIs $50k-75k, 0.2% for AGIs $75k-100k, 10.4% for AGIs over 100k)
Profit/loss from business: +$8,146 (reported on 20.1% of returns)
Here:
+$8,146
State:
+$12,882
(% of AGI for various income ranges: 15.4% for AGIs below $10k, 6.0% for AGIs $10k-25k, 2.6% for AGIs $25k-50k, 1.4% for AGIs $50k-75k, 1.1% for AGIs $75k-100k, 15.7% for AGIs over 100k)
IRA payment deduction: $2,778 (reported on 1.4% of returns)
38544:
$2,778
Tennessee:
$2,934
Total itemized deductions: $15,056 (24% of AGI, reported on 14.0% of returns)
Here:
$15,056
State:
$18,035
Here:
24.4% of AGI
State:
19.9% of AGI
(% of AGI for various income ranges: 5.1% for AGIs $10k-25k, 5.6% for AGIs $25k-50k, 8.7% for AGIs $50k-75k, 8.7% for AGIs $75k-100k, 8.5% for AGIs over 100k)
Charity contributions deductions: $3,396 (5% of AGI, reported on 11.6% of returns)
Here:
$3,396
State:
$5,167
Here:
5.3% of AGI
State:
5.3% of AGI
(% of AGI for various income ranges: 0.6% for AGIs $10k-25k, 0.6% for AGIs $25k-50k, 1.4% for AGIs $50k-75k, 1.7% for AGIs $75k-100k, 3.1% for AGIs over 100k)
Total tax: $3,880 (reported on 70.9% of returns)
38544:
$3,880
State:
$7,482
(% of AGI for various income ranges: 4.4% for AGIs below $10k, 3.8% for AGIs $10k-25k, 6.1% for AGIs $25k-50k, 8.3% for AGIs $50k-75k, 10.8% for AGIs $75k-100k, 20.4% for AGIs over 100k)
Earned income credit: $1,696 (reported on 24.4% of returns)
Here:
$1,696
State:
$1,826
Percentage of individuals using paid preparers for their 2004 taxes: 69.8%
Here:
70%
State:
60%
(% for various income ranges: 63.5% for AGIs below $10k, 72.4% for AGIs $10k-25k, 71.4% for AGIs $25k-50k, 70.1% for AGIs $50k-75k, 65.4% for AGIs $75k-100k, 80.3% for AGIs over 100k)
Likely homosexual households (counted as self-reported same-sex unmarried-partner households)
Lesbian couples: 0.7% of all households
Gay men: 0.0% of all households
Household received Food Stamps/SNAP in the past 12 months: 238 Household did not receive Food Stamps/SNAP in the past 12 months: 2,593
Women who had a birth in the past 12 months: 69 (61 now married, 8 unmarried) Women who did not have a birth in the past 12 months: 1,557 (797 now married, 761 unmarried)
Housing units in zip code 38544 with a mortgage: 1,140 (34 second mortgage, 3 both second mortgage and home equity loan) Houses without a mortgage: 60
Median monthly owner costs for units with a mortgage: $1,346 Median monthly owner costs for units without a mortgage: $412
Residents with income below the poverty level in 2022:
This zip code:
11.2%
Whole state:
13.3%
Residents with income below 50% of the poverty level in 2022:
This zip code:
4.7%
Whole state:
7.1%
Median number of rooms in houses and condos:
Here:
6.3
State:
6.5
Median number of rooms in apartments:
Here:
5.0
State:
4.4
Notable locations in this zip code not listed on our city pages
Notable locations in zip code 38544: Thousand Pines Tree Farm (A), Putnam County Landfill (B), Cookville Dock (C), Dekalb County Fire Department Station 58 (D), Putnam County Fire Department Station 13 (E), Putnam County Fire Department Station 14 (F), Putnam County Fire Department Station 32 (G), Baxter Public Library (H), Baxter City Hall (I), Baxter Volunteer Fire Department (J). Display/hide their locations on the map
Churches in zip code 38544 include: Nash Grove Baptist Church (A), Double Springs Baptist Church (B), Cedar Hill Baptist Church (C), Baxter First Baptist Church (D), Stanton Chapel (E), Lilys Chapel (F), Wayside Chapel (G), Vaden Chapel (H), Pleasant View Church (I). Display/hide their locations on the map
Cemeteries: Hughes Cemetery (1), Judd Cemetery (2), Whitaker Cemetery (3), Leftwich Cemetery (4), Bartlett Cemetery (5), Maddux Cemetery (6), Marlow Cemetery (7). Display/hide their locations on the map
Size of family households: 941 2-persons, 431 3-persons, 437 4-persons, 267 5-persons, 41 6-persons, 56 7-or-more-persons
Size of nonfamily households: 559 1-person, 61 2-persons, 28 3-persons
1,133 married couples with children.
348 single-parent households (199 men, 149 women).
98.0% of residents of 38544 zip code speak English at home.
1.1% of residents speak Spanish at home (100% very well).
0.5% of residents speak other Indo-European language at home (53% very well, 47% well).
0.1% of residents speak Asian or Pacific Island language at home (100% very well).
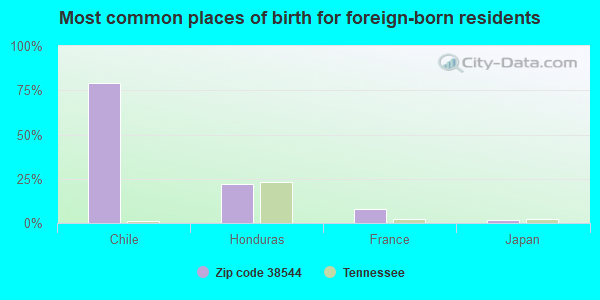
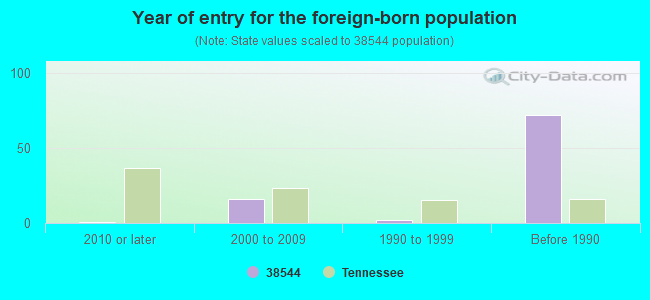
Foreign born population: 63 (0.9%) (80.1% of them are naturalized citizens)
This zip code:
0.9%
Whole state:
5.6%
79%Chile
22%Honduras
8%France
2%Japan
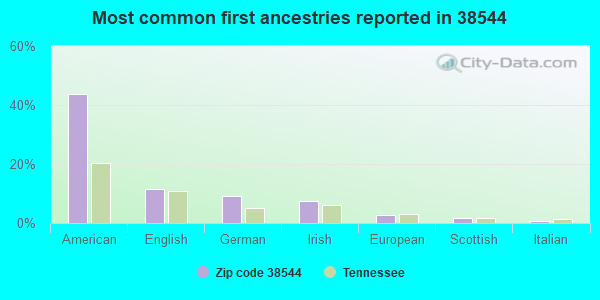
44%American
12%English
9%German
8%Irish
3%European
2%Scottish
1%Italian
Year of entry for the foreign-born population
12010 or later
162000 to 2009
21990 to 1999
72Before 1990
Facilities with environmental interests located in this zip code:
BAXTER ELEMENTARY SCHOOL (125 ELMORE TOWN RD in BAXTER, TN)
(Geographic Names Information System) (National Center for Education Statistics) - STATE ID-0015 Organizations: PUTNAM COUNTY SCHOOL DISTRICT (SCHOOL DISTRICT)
CORNERSTONE MIDDLE SCHOOL (371 FIRST S AV in BAXTER, TN)
(National Center for Education Statistics) - STATE ID-0085 Organizations: PUTNAM COUNTY SCHOOL DISTRICT (SCHOOL DISTRICT)
BAXTER STP (810 ELMORE TOWN ROAD in BAXTER, TN)
National Pollutant Discharge Elimination System NON-MAJOR (Tracking pollutant discharge elimination systems) - permit Business SIC classification: SEWERAGE SYSTEMS Organizations: BILLE J. MEDLEY (CONTACT/OWNER)
Alternative names: BAXTER WWTP
COOKEVILLE WATER TREAT C'VILLE (9722 WATER PLANT ROAD in BAXTER, TN)
National Pollutant Discharge Elimination System NON-MAJOR (Tracking pollutant discharge elimination systems) - permit Business SIC classification: WATER SUPPLY Organizations: RONNIE J. KELLY (CONTACT/OWNER)
Alternative names: COOKEVILLE WATER TREATMENT PLANT
BAXTER MFG. CORP. (PO BOX 128 in BAXTER, TN)
(Resource Conservation and Recovery Act (tracking hazardous waste)) Business NAICS classification: UPHOLSTERED HOUSEHOLD FURNITURE MANUFACTURING.
Housing units lacking complete plumbing facilities: 5.4% Housing units lacking complete kitchen facilities: 2.6%
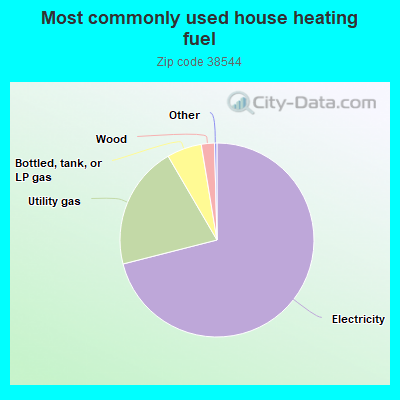
71.1%Electricity
20.6%Utility gas
5.8%Bottled, tank, or LP gas
2.2%Wood
Population in 1990: 5,871. Population change in the 1990s: +37 (+0.6%).
Place of birth for U.S.-born residents:
This state: 5,177
Northeast: 302
Midwest: 550
South: 1,018
West: 218
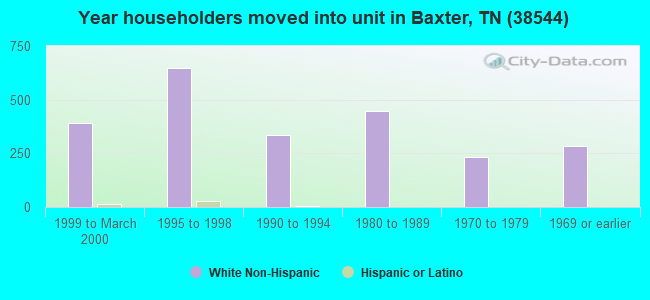
59% of the 38544 zip code residents lived in the same house 5 years ago. Out of people who lived in different houses, 59% lived in this county. Out of people who lived in different counties, 50% lived in Tennessee.
90% of the 38544 zip code residents lived in the same house 1 year ago. Out of people who lived in different houses, 39% moved from this county. Out of people who lived in different houses, 33% moved from different county within same state. Out of people who lived in different houses, 30% moved from different state.
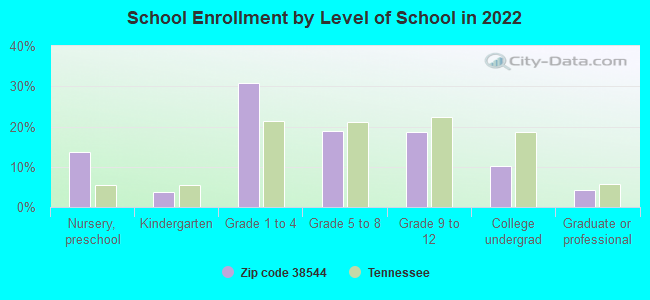
Private vs. public school enrollment:
Students in private schools in grades 1 to 8 (elementary and middle school): 89
Here:
10.0%
Tennessee:
15.0%
Students in private schools in grades 9 to 12 (high school): 12
Here:
3.9%
Tennessee:
16.2%
Students in private undergraduate colleges: 27
Here:
14.7%
Tennessee:
23.5%
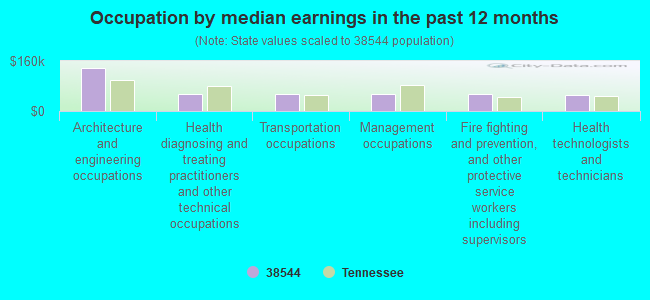
Occupation by median earnings in the past 12 months ($)
137,196Architecture and engineering occupations
54,950Health diagnosing and treating practitioners and other technical occupations
54,841Transportation occupations
54,038Management occupations
53,188Fire fighting and prevention, and other protective service workers including supervisors
51,091Health technologists and technicians
Top industries in this zip code by the number of employees in 2005:
Health Care and Social Assistance: Home Health Care Services (10-19 employees: 1 establishment)
Health Care and Social Assistance: Child Day Care Services (10-19: 1)
Construction: Water and Sewer Line and Related Structures Construction (5-9: 1, 1-4: 2)
Fatal accident statistics in 2014:
Fatal accident count: 1
Vehicles involved in fatal accidents: 1
Fatal accidents caused by drunken drivers: 0
Fatalities: 1
Persons involved in fatal accidents: 1
Pedestrians involved in fatal accidents: 0
Fatal accident statistics in 2013:
Fatal accident count: 1
Vehicles involved in fatal accidents: 2
Fatal accidents caused by drunken drivers: 0
Fatalities: 1
Persons involved in fatal accidents: 4
Pedestrians involved in fatal accidents: 0
2003 - 2018 National Fire Incident Reporting System (NFIRS) incidents
Based on the data from the years 2003 - 2018 the average number of fires per year is 40. The highest number of fire incidents - 91 took place in 2011, and the least - 3 in 2003. The data has a growing trend.
When looking into fire subcategories, the most incidents belonged to: Structure Fires (46.0%), and Outside Fires (35.7%).
Fire incident types reported to NFIRS in Zip Code 38544
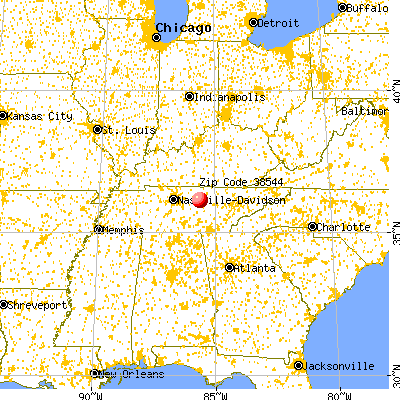


 Nearest zip codes: 38582, 38545, 38548, 38501, 38505, 38564.


 Based on the data from the years 2003 - 2018 the average number of fires per year is 40. The highest number of fire incidents - 91 took place in 2011, and the least - 3 in 2003. The data has a growing trend.
 When looking into fire subcategories, the most incidents belonged to: Structure Fires (46.0%), and Outside Fires (35.7%).