Estimated zip code population in 2022: 8,760 Zip code population in 2010: 8,413 Zip code population in 2000: 7,432
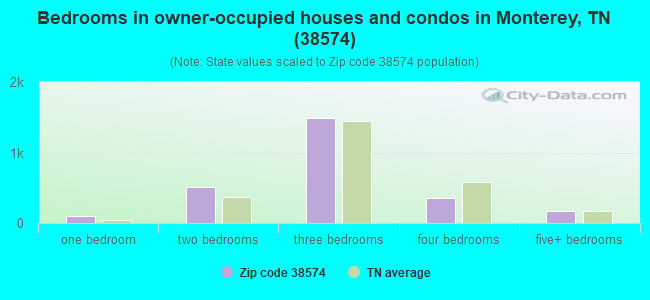
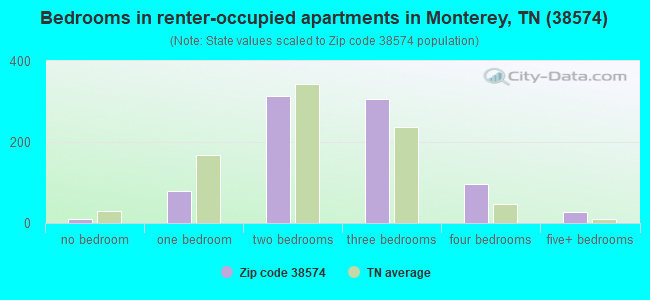
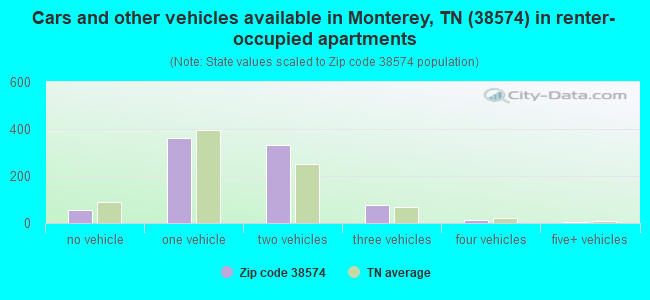
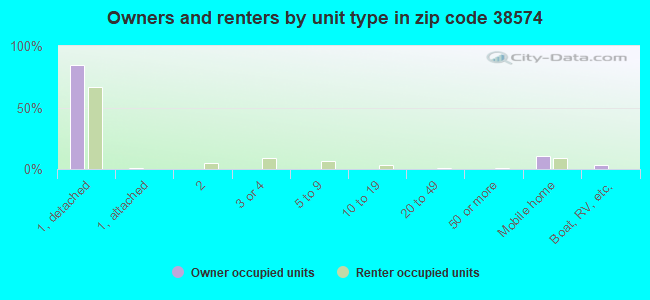
Houses and condos: 3,939 Renter-occupied apartments: 838
% of renters here:
24%
State:
33%
March 2022 cost of living index in zip code 38574: 79.8 (low, U.S. average is 100)
Land area: 172.6 sq. mi. Water area: 0.7 sq. mi.
Population density: 51 people per square mile
(very low).
OSM Map
General Map
Google Map
MSN Map
OSM Map
General Map
Google Map
MSN Map
OSM Map
General Map
Google Map
MSN Map
OSM Map
General Map
Google Map
MSN Map
Please wait while loading the map...
Real estate property taxes paid for housing units in 2022:
This zip code:
0.4% ($770)
Tennessee:
0.5% ($1,376)
Median real estate property taxes paid for housing units with mortgages in 2022: $907 (0.4%) Median real estate property taxes paid for housing units with no mortgage in 2022: $689 (0.4%)
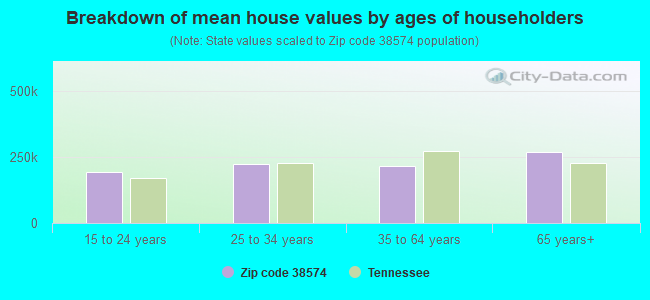
Estimated median house/condo value in 2022: $202,710
38574:
$202,710
Tennessee:
$284,800
According to our research of Tennessee and other state lists, there were 16 registered sex offenders living in 38574 zip code as of April 27, 2024. The ratio of all residents to sex offenders in zip code 38574 is 498 to 1. The ratio of registered sex offenders to all residents in this zip code is lower than the state average.
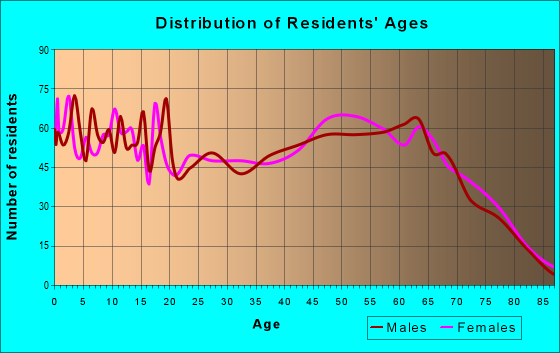
Median resident age:
This zip code:
41.0 years
Tennessee median age:
39.2 years
Average household size:
This zip code:
2.5 people
Tennessee:
2.4 people
Averages for the 2020 tax year for zip code 38574, filed in 2021:
Average Adjusted Gross Income (AGI) in 2020: $51,416 (Individual Income Tax Returns)
Here:
$51,416
State:
$69,014
Salary/wage: $39,144 (reported on 75.6% of returns)
Here:
$39,144
State:
$55,872
(% of AGI for various income ranges: 1109.4% for AGIs below $25k, 3371.8% for AGIs $25k-50k, 5688.8% for AGIs $50k-75k, 7555.5% for AGIs $75k-100k, 10724.2% for AGIs $100k-200k, 46235.0% for AGIs over 200k)
Taxable interest for individuals: $1,173 (reported on 27.6% of returns)
This zip code:
$1,173
Tennessee:
$1,945
(% of AGI for various income ranges: 16.4% for AGIs below $25k, 17.3% for AGIs $25k-50k, 34.4% for AGIs $50k-75k, 73.6% for AGIs $75k-100k, 155.8% for AGIs $100k-200k, 1450.0% for AGIs over 200k)
Ordinary dividends: $3,712 (reported on 10.6% of returns)
Here:
$3,712
State:
$8,105
(% of AGI for various income ranges: 14.1% for AGIs below $25k, 18.7% for AGIs $25k-50k, 44.4% for AGIs $50k-75k, 51.8% for AGIs $75k-100k, 276.3% for AGIs $100k-200k, 1730.0% for AGIs over 200k)
Net capital gain/loss in AGI: +$17,952 (reported on 10.6% of returns)
Here:
+$17,952
State:
+$33,664
(% of AGI for various income ranges: 8.5% for AGIs below $25k, 30.2% for AGIs $25k-50k, 139.8% for AGIs $50k-75k, 188.6% for AGIs $75k-100k, 735.8% for AGIs $100k-200k, 22170.0% for AGIs over 200k)
Profit/loss from business: +$16,924 (reported on 18.0% of returns)
Here:
+$16,924
State:
+$18,991
(% of AGI for various income ranges: 206.9% for AGIs below $25k, 180.1% for AGIs $25k-50k, 305.9% for AGIs $50k-75k, 545.5% for AGIs $75k-100k, 1235.8% for AGIs $100k-200k, 14340.0% for AGIs over 200k)
Taxable individual retirement arrangement distribution: $22,810 (reported on 8.2% of returns)
38574:
$22,810
Tennessee:
$20,036
(% of AGI for various income ranges: 54.3% for AGIs below $25k, 79.1% for AGIs $25k-50k, 163.9% for AGIs $50k-75k, 549.5% for AGIs $75k-100k, 2052.6% for AGIs $100k-200k)
Total itemized deductions: $34,411 (reported on 2.4% of returns)
Here:
$34,411
State:
$40,136
(% of AGI for various income ranges: 225.4% for AGIs $50k-75k, 506.8% for AGIs $100k-200k, 6050.0% for AGIs over 200k)
Charity contributions: $17,186 (reported on 1.9% of returns)
Here:
$17,186
State:
$19,852
(% of AGI for various income ranges: 12.5% for AGIs $25k-50k, 249.5% for AGIs $100k-200k, 3090.0% for AGIs over 200k)
Taxes paid: $5,825 (reported on 2.1% of returns)
38574:
$5,825
State:
$6,038
(% of AGI for various income ranges: 34.9% for AGIs $50k-75k, 80.0% for AGIs $100k-200k, 855.0% for AGIs over 200k)
Earned income credit: $2,429 (reported on 22.3% of returns)
Here:
$2,429
State:
$2,391
(% of AGI for various income ranges: 111.3% for AGIs below $25k, 94.2% for AGIs $25k-50k)
Percentage of individuals using paid preparers for their 2020 taxes: 94.4%
Here:
94%
State:
93%
(% for various income ranges: 94.5% for AGIs below $25k, 95.3% for AGIs $25k-50k, 92.7% for AGIs $50k-75k, 93.5% for AGIs $75k-100k, 93.9% for AGIs $100k-200k, 100.0% for AGIs over 200k)
Averages for the 2012 tax year for zip code 38574, filed in 2013:
Average Adjusted Gross Income (AGI) in 2012: $35,136 (Individual Income Tax Returns)
Here:
$35,136
State:
$53,767
Salary/wage: $30,638 (reported on 81.0% of returns)
Here:
$30,638
State:
$45,421
(% of AGI for various income ranges: 76.8% for AGIs below $25k, 80.5% for AGIs $25k-50k, 72.8% for AGIs $50k-75k, 63.0% for AGIs $75k-100k, 77.1% for AGIs $100k-200k)
Taxable interest for individuals: $848 (reported on 24.7% of returns)
This zip code:
$848
Tennessee:
$1,732
(% of AGI for various income ranges: 0.9% for AGIs below $25k, 0.5% for AGIs $25k-50k, 0.4% for AGIs $50k-75k, 0.6% for AGIs $75k-100k, 0.9% for AGIs $100k-200k)
Ordinary dividends: $3,223 (reported on 8.5% of returns)
Here:
$3,223
State:
$6,739
(% of AGI for various income ranges: 0.5% for AGIs below $25k, 0.5% for AGIs $25k-50k, 0.6% for AGIs $50k-75k, 0.8% for AGIs $75k-100k, 2.5% for AGIs $100k-200k)
Net capital gain/loss in AGI: +$2,707 (reported on 7.7% of returns)
Here:
+$2,707
State:
+$19,082
(% of AGI for various income ranges: 0.6% for AGIs $25k-50k, 0.2% for AGIs $50k-75k, 3.1% for AGIs $100k-200k)
Profit/loss from business: +$8,748 (reported on 17.0% of returns)
Here:
+$8,748
State:
+$15,240
(% of AGI for various income ranges: 9.5% for AGIs below $25k, 3.1% for AGIs $25k-50k, 2.6% for AGIs $50k-75k, 2.4% for AGIs $75k-100k, 5.2% for AGIs $100k-200k)
Taxable individual retirement arrangement distribution: $13,207 (reported on 8.0% of returns)
38574:
$13,207
Tennessee:
$15,505
(% of AGI for various income ranges: 2.2% for AGIs below $25k, 2.3% for AGIs $25k-50k, 3.2% for AGIs $50k-75k, 3.0% for AGIs $75k-100k, 6.6% for AGIs $100k-200k)
Total itemized deductions: $20,937 (27% of AGI, reported on 11.6% of returns)
Here:
$20,937
State:
$21,976
Here:
26.8% of AGI
State:
17.8% of AGI
(% of AGI for various income ranges: 4.0% for AGIs below $25k, 5.2% for AGIs $25k-50k, 7.2% for AGIs $50k-75k, 10.0% for AGIs $75k-100k, 14.9% for AGIs $100k-200k)
Charity contributions: $5,478 (reported on 9.1% of returns)
Here:
$5,478
State:
$6,709
(% of AGI for various income ranges: 0.4% for AGIs below $25k, 0.6% for AGIs $25k-50k, 1.4% for AGIs $50k-75k, 2.1% for AGIs $75k-100k, 4.6% for AGIs $100k-200k)
Taxes paid: $3,551 (reported on 11.6% of returns)
38574:
$3,551
State:
$4,829
(% of AGI for various income ranges: 0.5% for AGIs below $25k, 0.7% for AGIs $25k-50k, 1.1% for AGIs $50k-75k, 1.9% for AGIs $75k-100k, 3.1% for AGIs $100k-200k)
Earned income credit: $2,413 (reported on 27.8% of returns)
Here:
$2,413
State:
$2,404
(% of AGI for various income ranges: 7.4% for AGIs below $25k, 1.6% for AGIs $25k-50k)
Percentage of individuals using paid preparers for their 2012 taxes: 63.4%
Here:
63%
State:
52%
(% for various income ranges: 62.2% for AGIs below $25k, 64.6% for AGIs $25k-50k, 59.0% for AGIs $50k-75k, 70.0% for AGIs $75k-100k, 83.3% for AGIs $100k-200k)
Averages for the 2004 tax year for zip code 38574, filed in 2005:
Average Adjusted Gross Income (AGI) in 2004: $30,952 (Individual Income Tax Returns)
Here:
$30,952
State:
$44,088
Salary/wage: $27,215 (reported on 82.9% of returns)
Here:
$27,215
State:
$38,825
(% of AGI for various income ranges: 90.6% for AGIs below $10k, 76.9% for AGIs $10k-25k, 83.0% for AGIs $25k-50k, 78.0% for AGIs $50k-75k, 72.6% for AGIs $75k-100k, 41.7% for AGIs over 100k)
Taxable interest for individuals: $1,349 (reported on 29.4% of returns)
This zip code:
$1,349
Tennessee:
$1,802
(% of AGI for various income ranges: 1.8% for AGIs below $10k, 1.8% for AGIs $10k-25k, 1.0% for AGIs $25k-50k, 0.6% for AGIs $50k-75k, 0.8% for AGIs $75k-100k, 2.0% for AGIs over 100k)
Taxable dividends: $1,409 (reported on 10.8% of returns)
Here:
$1,409
State:
$3,727
(% of AGI for various income ranges: 1.3% for AGIs below $10k, 0.5% for AGIs $10k-25k, 0.3% for AGIs $25k-50k, 0.8% for AGIs $50k-75k, 0.1% for AGIs $75k-100k, 0.6% for AGIs over 100k)
Net capital gain/loss: +$9,866 (reported on 10.6% of returns)
Here:
+$9,866
State:
+$15,776
(% of AGI for various income ranges: -1.5% for AGIs below $10k, 1.2% for AGIs $10k-25k, 0.7% for AGIs $25k-50k, 1.6% for AGIs $50k-75k, 0.4% for AGIs $75k-100k, 14.9% for AGIs over 100k)
Profit/loss from business: +$7,703 (reported on 19.8% of returns)
Here:
+$7,703
State:
+$12,882
(% of AGI for various income ranges: 17.2% for AGIs below $10k, 9.0% for AGIs $10k-25k, 3.7% for AGIs $25k-50k, 4.1% for AGIs $50k-75k, 1.6% for AGIs $75k-100k, 3.0% for AGIs over 100k)
IRA payment deduction: $3,795 (reported on 1.3% of returns)
38574:
$3,795
Tennessee:
$2,934
Total itemized deductions: $16,761 (23% of AGI, reported on 13.0% of returns)
Here:
$16,761
State:
$18,035
Here:
22.8% of AGI
State:
19.9% of AGI
(% of AGI for various income ranges: 5.5% for AGIs below $10k, 4.5% for AGIs $10k-25k, 5.9% for AGIs $25k-50k, 7.9% for AGIs $50k-75k, 10.0% for AGIs $75k-100k, 9.8% for AGIs over 100k)
Charity contributions deductions: $4,645 (6% of AGI, reported on 10.3% of returns)
Here:
$4,645
State:
$5,167
Here:
5.7% of AGI
State:
5.3% of AGI
(% of AGI for various income ranges: 0.6% for AGIs below $10k, 0.5% for AGIs $10k-25k, 1.0% for AGIs $25k-50k, 1.4% for AGIs $50k-75k, 2.0% for AGIs $75k-100k, 3.9% for AGIs over 100k)
Total tax: $4,002 (reported on 69.8% of returns)
38574:
$4,002
State:
$7,482
(% of AGI for various income ranges: 4.1% for AGIs below $10k, 4.1% for AGIs $10k-25k, 5.9% for AGIs $25k-50k, 8.5% for AGIs $50k-75k, 11.4% for AGIs $75k-100k, 20.6% for AGIs over 100k)
Earned income credit: $1,812 (reported on 25.5% of returns)
Here:
$1,812
State:
$1,826
Percentage of individuals using paid preparers for their 2004 taxes: 69.8%
Here:
70%
State:
60%
(% for various income ranges: 63.9% for AGIs below $10k, 70.8% for AGIs $10k-25k, 72.8% for AGIs $25k-50k, 71.2% for AGIs $50k-75k, 59.3% for AGIs $75k-100k, 80.3% for AGIs over 100k)
Household received Food Stamps/SNAP in the past 12 months: 441 Household did not receive Food Stamps/SNAP in the past 12 months: 3,007
Women who had a birth in the past 12 months: 68 (62 now married, 6 unmarried) Women who did not have a birth in the past 12 months: 1,365 (726 now married, 639 unmarried)
Housing units in zip code 38574 with a mortgage: 1,189 (96 second mortgage, 97 both second mortgage and home equity loan) Median monthly owner costs for units with a mortgage: $1,025 Median monthly owner costs for units without a mortgage: $359
Residents with income below the poverty level in 2022:
This zip code:
18.9%
Whole state:
13.3%
Residents with income below 50% of the poverty level in 2022:
This zip code:
11.6%
Whole state:
7.1%
Median number of rooms in houses and condos:
Here:
6.2
State:
6.5
Median number of rooms in apartments:
Here:
4.8
State:
4.4
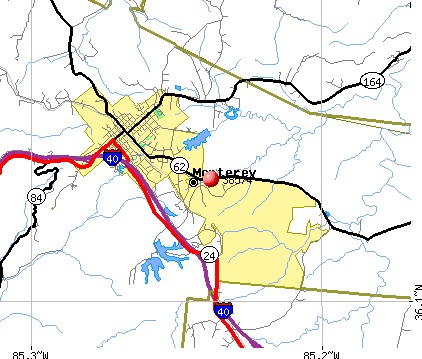
Notable locations in this zip code not listed on our city pages
Notable locations in zip code 38574: Calfkiller (A), Camp Nakanawa (B), Camp Monterey (C), Flat Rock Siding (D), Hickory Corner (E), Welch (F), Dripping Springs (G), Doubling Spur (H), Monterey Volunteer Fire Department (I), Putnam County Fire Department Station 21 (J), Putnam County Fire Department Station 22 (K), Putnam County Fire Department Station 23 (L), Monterey Public Library (M), Monterey City Hall (N), Muddy Pond Volunteer Fire Department (O). Display/hide their locations on the map
Churches in zip code 38574 include: Wesleyan Church (A), Shady Grove Church (B), Sand Springs Baptist Church (C), Monterey Methodist Church (D), Monterey Freewill Baptist Church (E), Monterey First Baptist Church (F), Monterey Church of the Nazarene (G), Church of God of Prophecy (H), Union Grove Church (I). Display/hide their locations on the map
Cemeteries: Swallows Cemetery (1), Terry Cemetery (2), Shaver Cemetery (3), Walker Cemetery (4), Welch Cemetery (5), Welch Memorial Cemetery (6), Wilson Cemetery (7). Display/hide their locations on the map
Lakes and reservoirs: Monterey Lake (A), Mayland Lake (B), Monterey Lake Number Two (C), Monterey Lake Number One (D), J E Walker Lake (E), City of Monterey Lake (F), Camp Monterey Lake (G), Lad Lake (H). Display/hide their locations on the map
Streams, rivers, and creeks: Looper Branch (A), Little Piney Creek (B), Bartlett Creek (C), Jack Branch (D), George Branch (E), Garrison Branch (F), Fond Branch (G), Flintrock Branch (H), Polebridge Branch (I). Display/hide their locations on the map
In group quarters: 89 (-1 institutionalized population)
Size of family households: 1,185 2-persons, 525 3-persons, 411 4-persons, 150 5-persons, 151 6-persons, 32 7-or-more-persons
Size of nonfamily households: 827 1-person, 82 2-persons, 72 3-persons
1,283 married couples with children.
475 single-parent households (68 men, 407 women).
93.1% of residents of 38574 zip code speak English at home.
5.3% of residents speak Spanish at home (62% very well, 2% well, 34% not well, 2% not at all).
1.7% of residents speak other Indo-European language at home (100% very well).
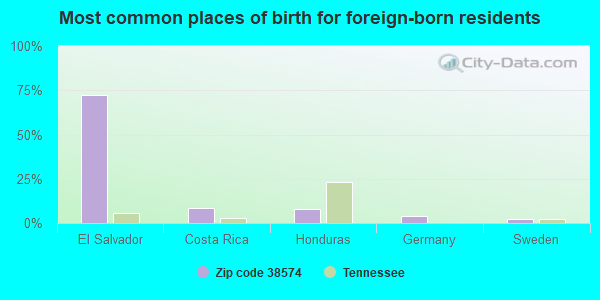
Foreign born population: 394 (4.5%) (29.4% of them are naturalized citizens)
This zip code:
4.5%
Whole state:
5.6%
72%El Salvador
8%Costa Rica
8%Honduras
4%Germany
2%Sweden
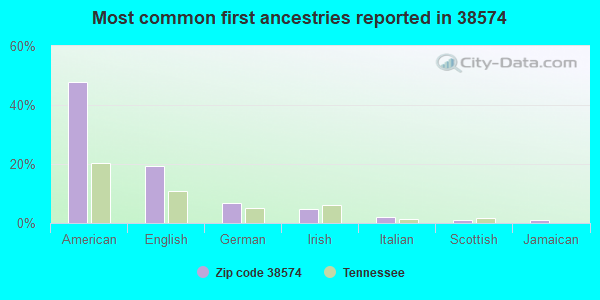
48%American
19%English
7%German
5%Irish
2%Italian
1%Scottish
1%Jamaican
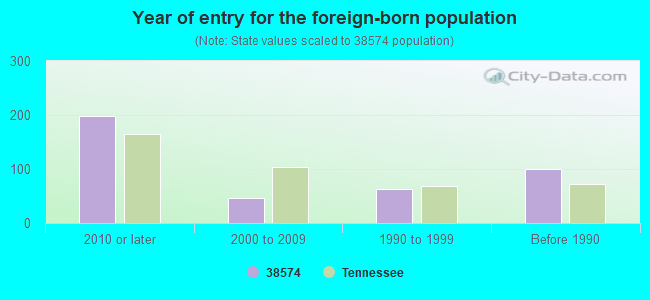
Year of entry for the foreign-born population
1992010 or later
472000 to 2009
631990 to 1999
100Before 1990
Facilities with environmental interests located in this zip code:
BURKS MIDDLE SCHOOL (300 CROSSVILLE ST in MONTEREY, TN)
(National Center for Education Statistics) - STATE ID-0025 Organizations: PUTNAM COUNTY SCHOOL DISTRICT (SCHOOL DISTRICT)
AMERICAN SAND SUPPLY (ROCKY POINT ROAD in MONTEREY, TN)
National Pollutant Discharge Elimination System NON-MAJOR (Tracking pollutant discharge elimination systems) - permit Business SIC classification: CONSTRUCTION SAND AND GRAVEL Alternative names: LLOYD BOWMAN
AMERICAN SAND SUPPLY (U. S. HIGHWAY 70N in MONTEREY, TN)
National Pollutant Discharge Elimination System NON-MAJOR (Tracking pollutant discharge elimination systems) - permit Business SIC classification: CONSTRUCTION SAND AND GRAVEL
AMERICAN SAND SUPPLY (SAND SPRINGS ROAD & HWY 70W in MONTEREY, TN)
National Pollutant Discharge Elimination System NON-MAJOR (Tracking pollutant discharge elimination systems) - permit Business SIC classification: CONSTRUCTION SAND AND GRAVEL
AMERICAN SAND SUPPLY (U.S. HIGHWAY 70 in MONTEREY, TN)
National Pollutant Discharge Elimination System NON-MAJOR (Tracking pollutant discharge elimination systems) - permit Business SIC classification: CONSTRUCTION SAND AND GRAVEL
CUMBERLAND CONTAINER CORPORATION (1027 NORTH CHESTNUT STREET in MONTEREY, TN)
AIR MINOR (AIRS/AFS) Business SIC classification: CORRUGATED AND SOLID FIBER BOXES
Housing units lacking complete plumbing facilities: 2.7% Housing units lacking complete kitchen facilities: 2.3%
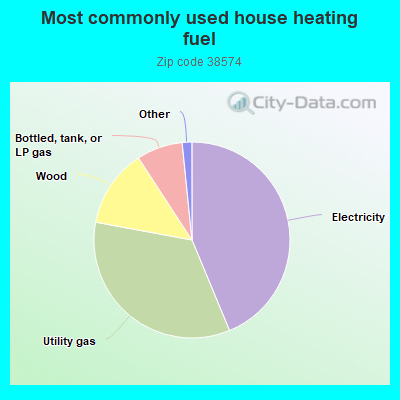
43.8%Electricity
34.2%Utility gas
12.9%Wood
7.6%Bottled, tank, or LP gas
0.8%Fuel oil, kerosene, etc.
0.7%Other fuel
Population in 1990: 5,030. Population change in the 1990s: +2,402 (+47.8%).
Place of birth for U.S.-born residents:
This state: 4,658
Northeast: 538
Midwest: 1,488
South: 1,047
West: 645
58% of the 38574 zip code residents lived in the same house 5 years ago. Out of people who lived in different houses, 44% lived in this county. Out of people who lived in different counties, 50% lived in Tennessee.
92% of the 38574 zip code residents lived in the same house 1 year ago. Out of people who lived in different houses, 26% moved from this county. Out of people who lived in different houses, 49% moved from different county within same state. Out of people who lived in different houses, 29% moved from different state. Out of people who lived in different houses, 1% moved from abroad.
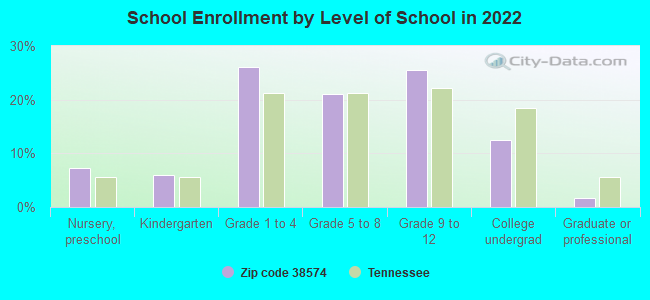
Private vs. public school enrollment:
Students in private schools in grades 1 to 8 (elementary and middle school): 137
Here:
14.3%
Tennessee:
15.0%
Students in private schools in grades 9 to 12 (high school): 49
Here:
9.5%
Tennessee:
16.2%
Students in private undergraduate colleges: 54
Here:
20.8%
Tennessee:
23.5%
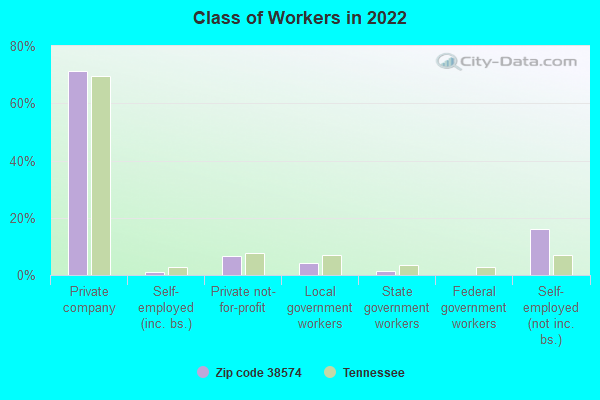
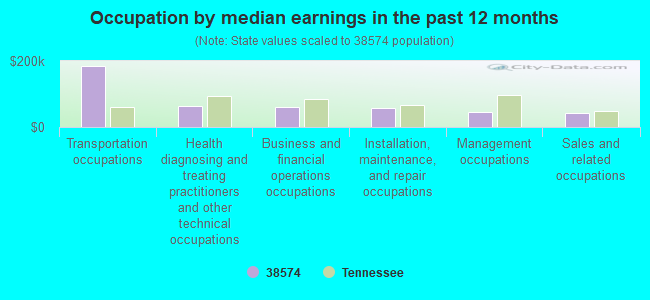
Occupation by median earnings in the past 12 months ($)
185,174Transportation occupations
62,132Health diagnosing and treating practitioners and other technical occupations
59,464Business and financial operations occupations
56,813Installation, maintenance, and repair occupations
44,528Management occupations
41,230Sales and related occupations
Companies with federal contracts located in this zip code:
AMERICAN SAND SUPPLY INC (9130 MONTEREY HWY in MONTEREY, TN; small business) : $77,222 in 7 contractsfrom 2003 to 2005
Contracts for Mineral Construction Materials, Bulk by Army, U.S. Army Corps of Engineers - civil program financing only Signed by year:2000: $0; 2001: $0; 2002: $0; 2003: $8,000; 2004: $41,310; 2005: $27,912; 2006: $0.
Biggest contracts:
$13,956 with Army for Mineral Construction Materials, Bulk. Signed on 2005-09-21. Completion date: 2005-09-30.
$13,956 with U.S. Army Corps of Engineers - civil program financing only for Mineral Construction Materials, Bulk. Signed on 2005-09-21. Completion date: 2005-09-30.
$11,655, same as above.Signed on 2004-04-16. Completion date: 2004-04-30.
$11,655 with Army for Mineral Construction Materials, Bulk. Signed on 2004-04-16. Completion date: 2004-04-30.
Top industries in this zip code by the number of employees in 2005:
Health Care and Social Assistance: Nursing Care Facilities (100-249 employees: 1 establishment)
Educational Services: Elementary and Secondary Schools (20-49: 1, 1-4: 1)
Finance and Insurance: Commercial Banking (10-19: 1, 1-4: 1)
Construction: Commercial and Institutional Building Construction (10-19: 1, 1-4: 1)
People in group quarters in 2010:
82 people in nursing facilities/skilled-nursing facilities
People in group quarters in 2000:
105 people in nursing homes
Fatal accident statistics in 2014:
Fatal accident count: 2
Vehicles involved in fatal accidents: 2
Fatal accidents caused by drunken drivers: 1
Fatalities: 2
Persons involved in fatal accidents: 3
Pedestrians involved in fatal accidents: 0
Fatal accident statistics in 2012:
Fatal accident count: 1
Vehicles involved in fatal accidents: 1
Fatal accidents caused by drunken drivers: 0
Fatalities: 1
Persons involved in fatal accidents: 1
Pedestrians involved in fatal accidents: 0
2002 - 2018 National Fire Incident Reporting System (NFIRS) incidents
Based on the data from the years 2002 - 2018 the average number of fires per year is 35. The highest number of fire incidents - 78 took place in 2016, and the least - 7 in 2003. The data has a rising trend.
When looking into fire subcategories, the most reports belonged to: Structure Fires (41.2%), and Outside Fires (35.1%).
Fire incident types reported to NFIRS in Zip Code 38574
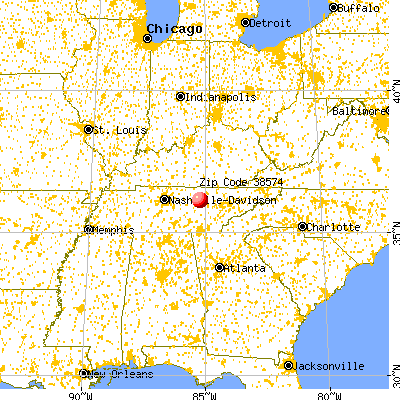


 Nearest zip codes: 38554, 38580, 38578, 38542, 38589, 38506.
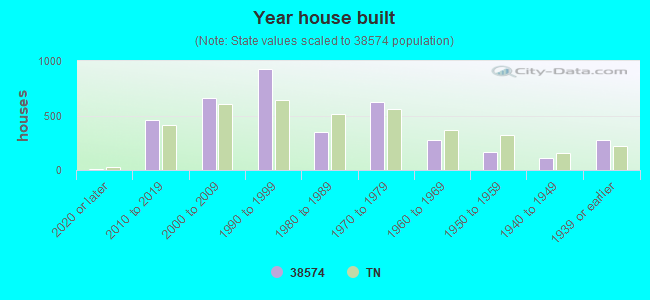


 Based on the data from the years 2002 - 2018 the average number of fires per year is 35. The highest number of fire incidents - 78 took place in 2016, and the least - 7 in 2003. The data has a rising trend.
 When looking into fire subcategories, the most reports belonged to: Structure Fires (41.2%), and Outside Fires (35.1%).