Monterey, Tennessee
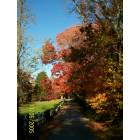
Monterey: fall time in monterey
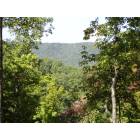
Monterey: Summer view at the Cabin
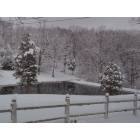
Monterey: snow of 2005
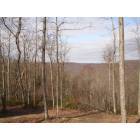
Monterey: Winter view at the Cabin
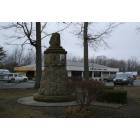
Monterey: Standing Stone monument
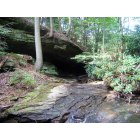
Monterey: williams woods monterey tn
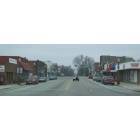
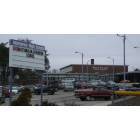
Monterey: Commercial Ave, downtown Monterey
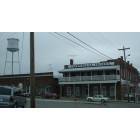
Monterey: The historic Imperial Hotel
Monterey: Monterey High School
Monterey: Tienda Monterrey
- add
your
Submit your own pictures of this town and show them to the world
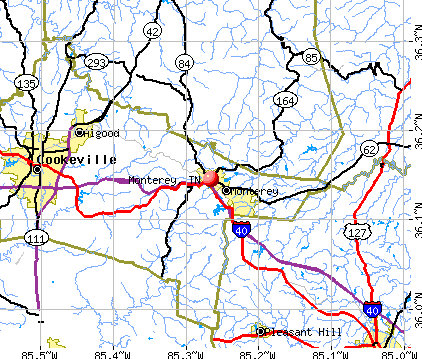
- OSM Map
- General Map
- Google Map
- MSN Map
Population change since 2000: +0.7%
 |
| Males: 1,414 | |
| Females: 1,322 |
| Median resident age: | 27.9 years |
| Tennessee median age: | 39.2 years |
Zip codes: 38574.
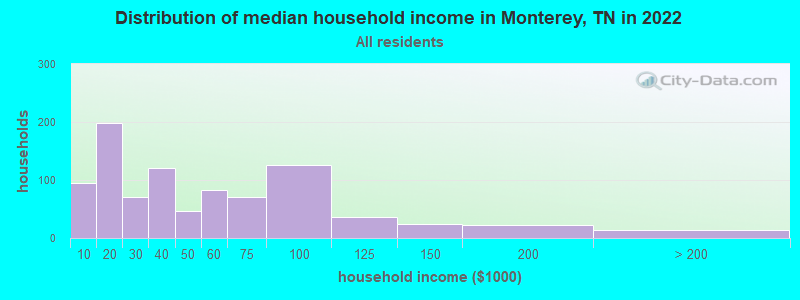
| Monterey: | $38,870 |
| TN: | $65,254 |
Estimated per capita income in 2022: $17,590 (it was $12,265 in 2000)
Monterey town income, earnings, and wages data
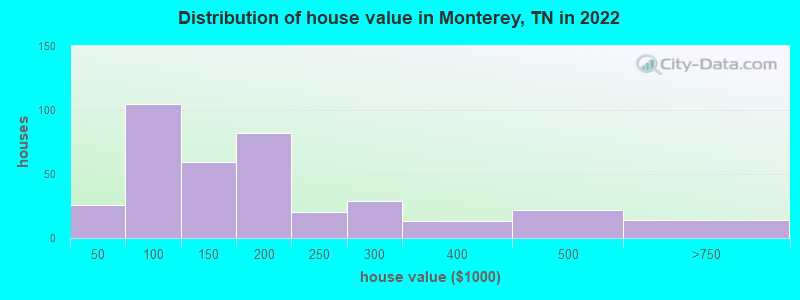
Estimated median house or condo value in 2022: $173,755 (it was $64,500 in 2000)
| Monterey: | $173,755 |
| TN: | $284,800 |
Mean prices in 2022: all housing units: $189,788; detached houses: $193,564; mobile homes: $126,484
Median gross rent in 2022: $672.
(31.5% for White Non-Hispanic residents, 30.7% for Hispanic or Latino residents, 78.7% for American Indian residents, 4.8% for two or more races residents)
Detailed information about poverty and poor residents in Monterey, TN


Compare current foreclosures near Monterey, TN:
| Photo | Address | Area | Beds / Baths | Price | Details |
|---|---|---|---|---|---|

|
#1
Clarkrange Hwy
Monterey, TN 38574
|
1,708 sq. feet
|
2 baths - beds |
show details | |

|
#2
Old Walton Rd
Monterey, TN 38574
|
936 sq. feet
|
1 baths - beds |
show details | |

|
#3
Greek Dr
Monterey, TN 38574
|
1,134 sq. feet
|
1 baths - beds |
show details | |

|
#4
Ashburn Rd
Monterey, TN 38574
|
800 sq. feet
|
- baths - beds |
show details | |

|
#5
S Poplar St
Monterey, TN 38574
|
1,728 sq. feet
|
- baths - beds |
show details | |

|
#6
Craig Rd
Monterey, TN 38574
|
- sq. feet
|
- baths - beds |
show details | |

|
#7
Clarkrange Hwy
Monterey, TN 38574
|
- sq. feet
|
- baths - beds |
show details | |

|
#8
High Rock Loop
Monterey, TN 38574
|
- sq. feet
|
- baths - beds |
show details | |

|
#9
Winding Trails Rd
Monterey, TN 38574
|
- sq. feet
|
- baths - beds |
show details | |

|
#10
Hillwood St
Monterey, TN 38574
|
1,792 sq. feet
|
- baths - beds |
show details |
| Photo | Address | Area | Beds / Baths | Price | Details |
|---|---|---|---|---|---|

|
#11
Garrett Ave
Monterey, TN 38574
|
- sq. feet
|
- baths - beds |
show details | |

|
#12
Hillwood St
Monterey, TN 38574
|
- sq. feet
|
- baths - beds |
show details | |

|
#13
Okalona Rd
Rickman, TN 38580
|
1,152 sq. feet
|
1 baths 3 beds |
show details | |

|
#14
Rocky Point Rd
Cookeville, TN 38506
|
2,297 sq. feet
|
3 baths - beds |
show details | |

|
#15
N Shady Lane Loop
Clarkrange, TN 38553
|
1,512 sq. feet
|
2 baths - beds |
show details | |

|
#16
Webb Ave
Cookeville, TN 38506
|
1,040 sq. feet
|
2 baths - beds |
show details | |

|
#17
Spring Creek Rd
Cookeville, TN 38506
|
1,305 sq. feet
|
2 baths - beds |
show details | |

|
#18
E 13th St
Cookeville, TN 38501
|
1,473 sq. feet
|
1 baths - beds |
show details | |

|
#19
N Pine Hill Rd
Cookeville, TN 38501
|
936 sq. feet
|
1 baths - beds |
show details | |

|
#20
Woodwinds Dr
Cookeville, TN 38501
|
1,749 sq. feet
|
2 baths - beds |
show details |
| Photo | Address | Area | Beds / Baths | Price | Details |
|---|---|---|---|---|---|

|
#21
Simmons Rd
Sparta, TN 38583
|
1,326 sq. feet
|
1 baths - beds |
show details | |

|
#22
Monterey Hwy
Sparta, TN 38583
|
1,352 sq. feet
|
2 baths - beds |
show details | |

|
#23
Hawthorne Rd
Sparta, TN 38583
|
1,284 sq. feet
|
2 baths - beds |
show details | |

|
#24
Bunker Hill Rd
Cookeville, TN 38506
|
1,484 sq. feet
|
1 baths - beds |
show details | |

|
#25
Frank Sims Rd
Sparta, TN 38583
|
1,216 sq. feet
|
1 baths - beds |
show details | |

|
#26
Shannon Dr
Cookeville, TN 38506
|
1,200 sq. feet
|
1 baths - beds |
show details | |

|
#27
Bay View Dr
Cookeville, TN 38506
|
2,128 sq. feet
|
2 baths - beds |
show details | |

|
#28
Old Baldwin Rd
Crossville, TN 38571
|
960 sq. feet
|
1 baths - beds |
show details | |

|
#29
Ray Cemetery Rd
Sparta, TN 38583
|
1,844 sq. feet
|
2 baths - beds |
show details | |

|
#30
Mcclain Rd
Cookeville, TN 38501
|
1,436 sq. feet
|
2 baths - beds |
show details |
| Photo | Address | Area | Beds / Baths | Price | Details |
|---|---|---|---|---|---|

|
#31
S Walnut Ave
Cookeville, TN 38501
|
986 sq. feet
|
1 baths - beds |
show details | |

|
#32
Johnnie Bud Ln
Cookeville, TN 38501
|
1,344 sq. feet
|
2 baths - beds |
show details | |

|
#33
Gaw St
Cookeville, TN 38501
|
1,185 sq. feet
|
1 baths - beds |
show details | |

|
#34
Page Rd
Clarkrange, TN 38553
|
1,184 sq. feet
|
1 baths - beds |
show details | |

|
#35
Highland Ave
Cookeville, TN 38501
|
1,242 sq. feet
|
1 baths - beds |
show details | |

|
#36
Flintwood Ave
Cookeville, TN 38506
|
1,352 sq. feet
|
2 baths - beds |
show details | |

|
#37
Bowers Rd
Livingston, TN 38570
|
480 sq. feet
|
2 baths - beds |
show details | |

|
#38
E Stevens St
Cookeville, TN 38501
|
1,152 sq. feet
|
1 baths - beds |
show details | |

|
#39
Wildwood Rd
Cookeville, TN 38501
|
1,025 sq. feet
|
1 baths - beds |
show details | |

|
#40
Hunter Ave
Cookeville, TN 38501
|
1,056 sq. feet
|
2 baths - beds |
show details |
| Photo | Address | Area | Beds / Baths | Price | Details |
|---|---|---|---|---|---|

|
#41
Monterey Hwy
Sparta, TN 38583
|
1,980 sq. feet
|
1 baths - beds |
show details | |

|
#42
Post Oak Bridge Rd
Cookeville, TN 38506
|
1,120 sq. feet
|
1 baths - beds |
show details | |

|
#43
Mcclellan Ct
Cookeville, TN 38501
|
1,536 sq. feet
|
1 baths - beds |
show details | |

|
#44
Hillsdale Dr
Cookeville, TN 38506
|
1,736 sq. feet
|
2 baths - beds |
show details | |

|
#45
Bryant Ave
Cookeville, TN 38501
|
1,200 sq. feet
|
1 baths - beds |
show details | |

|
#46
Miller Rdg
Crossville, TN 38571
|
1,233 sq. feet
|
1 baths - beds |
show details | |

|
#47
Ivey Rd
Crossville, TN 38571
|
1,728 sq. feet
|
2 baths - beds |
show details | |

|
#48
Greenland Ave
Cookeville, TN 38501
|
1,704 sq. feet
|
1 baths - beds |
show details | |

|
#49
Middleford Dr
Cookeville, TN 38506
|
1,334 sq. feet
|
2 baths - beds |
show details | |

|
Check over 1 million property listings on Foreclosure.com!
|
browse all offers | |||


- 2,21078.9%White alone
- 56320.1%Hispanic
- 281.0%Two or more races
- 70.2%American Indian alone
- 40.1%Black alone
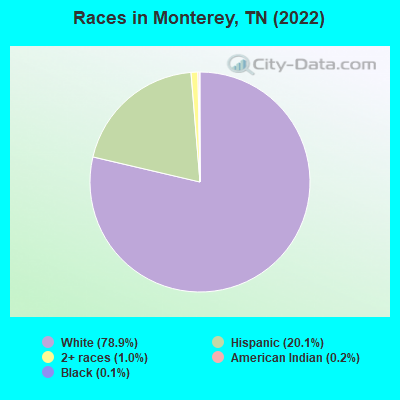
Races in Monterey detailed stats: ancestries, foreign born residents, place of birth
According to our research of Tennessee and other state lists, there were 15 registered sex offenders living in Monterey, Tennessee as of April 26, 2024.
The ratio of all residents to sex offenders in Monterey is 195 to 1.
Type |
2009 |
2010 |
2011 |
2012 |
2013 |
2014 |
2015 |
2016 |
2017 |
2018 |
2019 |
2020 |
2021 |
2022 |
|---|---|---|---|---|---|---|---|---|---|---|---|---|---|---|
| Murders (per 100,000) | 0 (0.0) | 1 (35.1) | 0 (0.0) | 0 (0.0) | 0 (0.0) | 0 (0.0) | 1 (34.9) | 0 (0.0) | 0 (0.0) | 0 (0.0) | 0 (0.0) | 0 (0.0) | 0 (0.0) | 0 (0.0) |
| Rapes (per 100,000) | 0 (0.0) | 1 (35.1) | 1 (34.8) | 0 (0.0) | 0 (0.0) | 0 (0.0) | 0 (0.0) | 0 (0.0) | 0 (0.0) | 0 (0.0) | 0 (0.0) | 1 (34.4) | 0 (0.0) | 0 (0.0) |
| Robberies (per 100,000) | 0 (0.0) | 0 (0.0) | 1 (34.8) | 0 (0.0) | 1 (35.3) | 0 (0.0) | 0 (0.0) | 0 (0.0) | 1 (34.9) | 1 (34.8) | 0 (0.0) | 1 (34.4) | 0 (0.0) | 0 (0.0) |
| Assaults (per 100,000) | 6 (203.9) | 10 (350.9) | 8 (278.2) | 2 (69.0) | 5 (176.7) | 5 (174.9) | 9 (314.5) | 16 (559.8) | 16 (558.1) | 10 (347.8) | 9 (311.6) | 8 (275.3) | 10 (345.4) | 3 (109.1) |
| Burglaries (per 100,000) | 24 (815.5) | 23 (807.0) | 20 (695.4) | 4 (138.0) | 13 (459.5) | 12 (419.7) | 14 (489.2) | 11 (384.9) | 15 (523.2) | 19 (660.9) | 14 (484.8) | 3 (103.2) | 13 (449.1) | 9 (327.3) |
| Thefts (per 100,000) | 38 (1,291) | 77 (2,702) | 23 (799.7) | 67 (2,312) | 24 (848.4) | 55 (1,924) | 31 (1,083) | 19 (664.8) | 30 (1,046) | 36 (1,252) | 32 (1,108) | 34 (1,170) | 38 (1,313) | 17 (618.2) |
| Auto thefts (per 100,000) | 5 (169.9) | 2 (70.2) | 5 (173.9) | 3 (103.5) | 4 (141.4) | 6 (209.9) | 5 (174.7) | 5 (174.9) | 12 (418.6) | 9 (313.0) | 5 (173.1) | 6 (206.5) | 9 (310.9) | 9 (327.3) |
| Arson (per 100,000) | 1 (34.0) | 1 (35.1) | 0 (0.0) | 0 (0.0) | 1 (35.3) | 2 (70.0) | 0 (0.0) | 1 (35.0) | 0 (0.0) | 0 (0.0) | 0 (0.0) | 0 (0.0) | 0 (0.0) | 0 (0.0) |
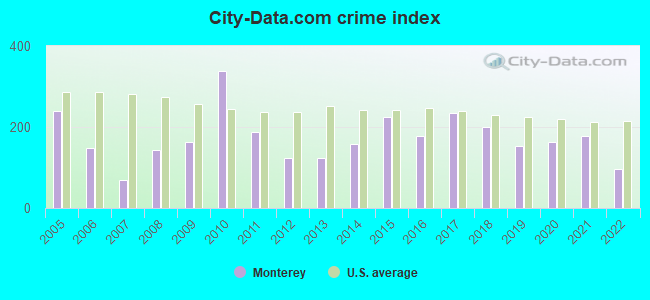
| City-Data.com crime index | 163.1 | 338.6 | 188.5 | 124.2 | 123.4 | 158.1 | 224.3 | 179.5 | 234.0 | 201.4 | 154.4 | 163.5 | 177.9 | 95.6 |
The City-Data.com crime index weighs serious crimes and violent crimes more heavily. Higher means more crime, U.S. average is 246.1. It adjusts for the number of visitors and daily workers commuting into cities.
Crime rate in Monterey detailed stats: murders, rapes, robberies, assaults, burglaries, thefts, arson
Full-time law enforcement employees in 2021, including police officers: 10 (9 officers - 9 male; 0 female).
| Officers per 1,000 residents here: | 3.11 |
| Tennessee average: | 2.57 |
 Recent articles from our blog. Our writers, many of them Ph.D. graduates or candidates, create easy-to-read articles on a wide variety of topics.

 | Your thoughts on Monterey vs Crossville (16 replies) |
| Monterey to Jamestown to Livingston ? (8 replies) |
| I made it to the Monterey, TN area (39 replies) |
| Truck Lanes on I-40 (8 replies) |
| 2023 a record year for new housing in Putnam County (2 replies) |
| Rail Trail to extend across all of Putnam County? (3 replies) |
Latest news from Monterey, TN collected exclusively by city-data.com from local newspapers, TV, and radio stations
Ancestries: American (39.1%), English (24.2%), Italian (3.5%), Irish (3.2%), German (2.2%), Scottish (1.6%).
Current Local Time: CST time zone
Incorporated in 1901
Elevation: 1875 feet
Land area: 2.95 square miles.
Population density: 927 people per square mile (low).
275 residents are foreign born (8.8% Latin America).
| This town: | 9.7% |
| Tennessee: | 5.4% |
Median real estate property taxes paid for housing units with mortgages in 2022: $1,315 (0.7%)
Median real estate property taxes paid for housing units with no mortgage in 2022: $904 (0.5%)
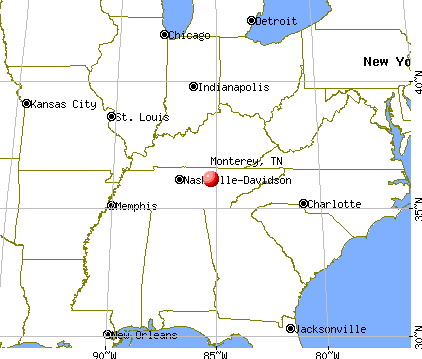
Nearest city with pop. 50,000+: Murfreesboro, TN  (66.2 miles , pop. 68,816).
Nearest city with pop. 200,000+: Nashville-Davidson, TN (83.6 miles , pop. 545,524).
Nearest city with pop. 1,000,000+: Chicago, IL (414.7 miles , pop. 2,896,016).
Nearest cities:
), ), )Latitude: 36.15 N, Longitude: 85.27 W
Area code: 931

Monterey, Tennessee accommodation & food services, waste management - Economy and Business Data
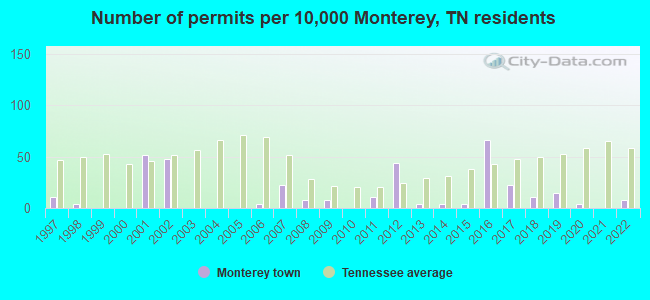
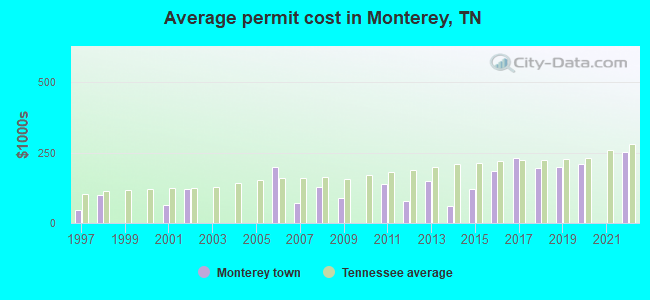
Single-family new house construction building permits:
- 2022: 2 buildings, average cost: $253,200
- 2020: 1 building, cost: $209,100
- 2019: 4 buildings, average cost: $197,600
- 2018: 3 buildings, average cost: $195,200
- 2017: 6 buildings, average cost: $231,200
- 2016: 18 buildings, average cost: $185,800
- 2015: 1 building, cost: $120,000
- 2014: 1 building, cost: $60,000
- 2013: 1 building, cost: $150,000
- 2012: 12 buildings, average cost: $77,800
- 2011: 3 buildings, average cost: $138,300
- 2009: 2 buildings, average cost: $88,500
- 2008: 2 buildings, average cost: $127,500
- 2007: 6 buildings, average cost: $70,700
- 2006: 1 building, cost: $199,000
- 2002: 13 buildings, average cost: $121,800
- 2001: 14 buildings, average cost: $64,300
- 1998: 1 building, cost: $98,000
- 1997: 3 buildings, average cost: $46,700
| Here: | 3.1% |
| Tennessee: | 3.0% |
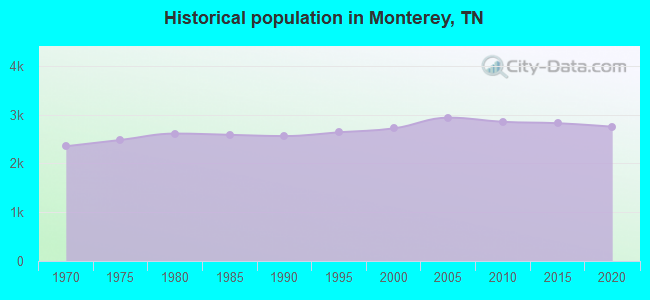
Population change in the 1990s: +135 (+5.2%).
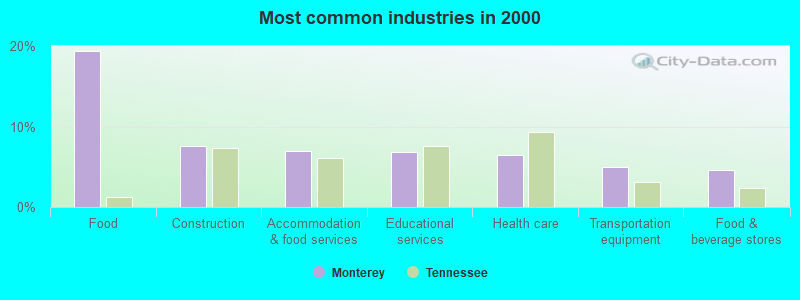
- Food (19.4%)
- Construction (7.5%)
- Accommodation & food services (7.0%)
- Educational services (6.8%)
- Health care (6.5%)
- Transportation equipment (5.0%)
- Food & beverage stores (4.6%)
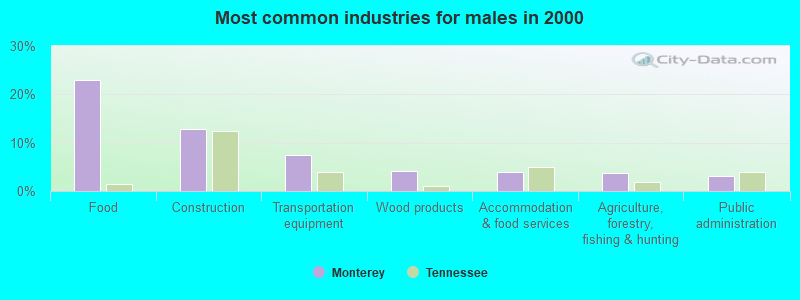
- Food (23.0%)
- Construction (12.9%)
- Transportation equipment (7.5%)
- Wood products (4.2%)
- Accommodation & food services (3.9%)
- Agriculture, forestry, fishing & hunting (3.8%)
- Public administration (3.1%)
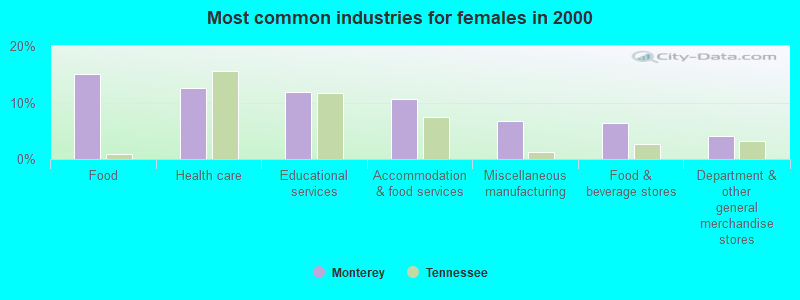
- Food (15.1%)
- Health care (12.6%)
- Educational services (11.8%)
- Accommodation & food services (10.6%)
- Miscellaneous manufacturing (6.8%)
- Food & beverage stores (6.4%)
- Department & other general merchandise stores (4.1%)
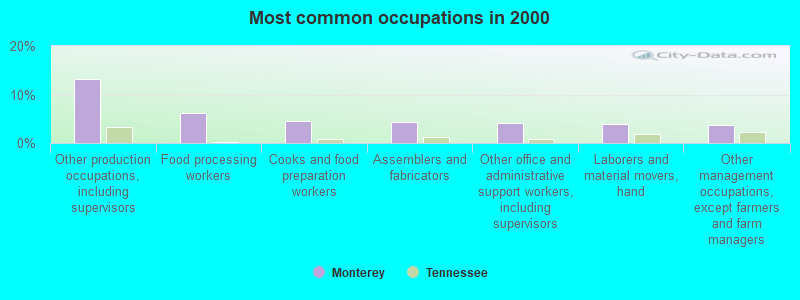
- Other production occupations, including supervisors (13.3%)
- Food processing workers (6.3%)
- Cooks and food preparation workers (4.5%)
- Assemblers and fabricators (4.4%)
- Other office and administrative support workers, including supervisors (4.2%)
- Laborers and material movers, hand (3.9%)
- Other management occupations, except farmers and farm managers (3.8%)
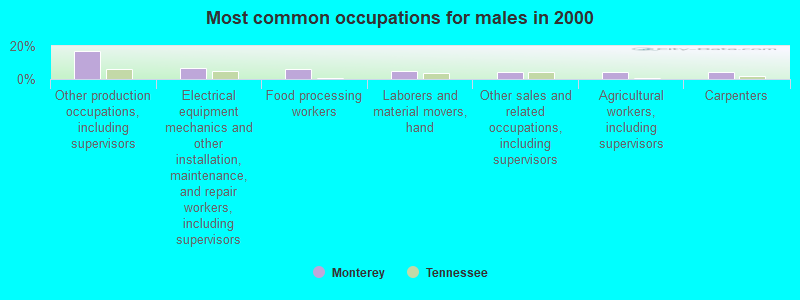
- Other production occupations, including supervisors (17.0%)
- Electrical equipment mechanics and other installation, maintenance, and repair workers, including supervisors (6.9%)
- Food processing workers (6.0%)
- Laborers and material movers, hand (4.6%)
- Other sales and related occupations, including supervisors (4.4%)
- Agricultural workers, including supervisors (4.4%)
- Carpenters (4.1%)
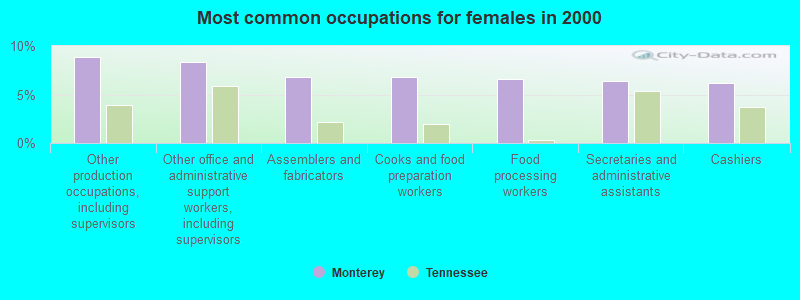
- Other production occupations, including supervisors (8.9%)
- Other office and administrative support workers, including supervisors (8.3%)
- Assemblers and fabricators (6.8%)
- Cooks and food preparation workers (6.8%)
- Food processing workers (6.6%)
- Secretaries and administrative assistants (6.4%)
- Cashiers (6.2%)
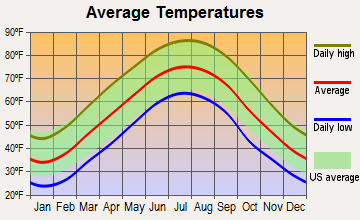
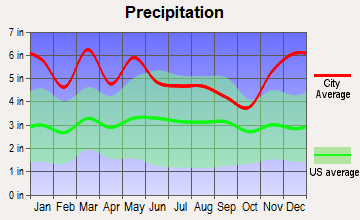
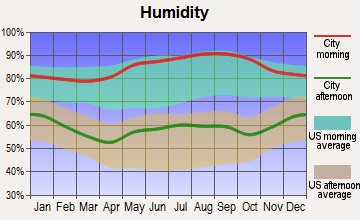
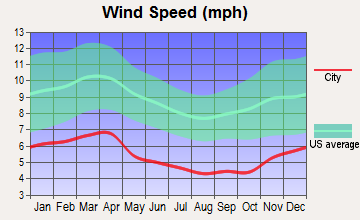
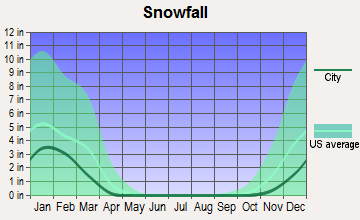
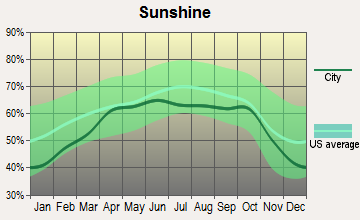
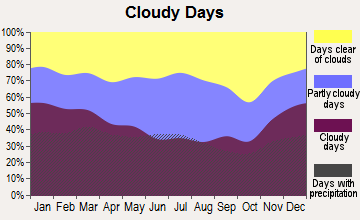
Average climate in Monterey, Tennessee
Based on data reported by over 4,000 weather stations
|
|

(lower is better)
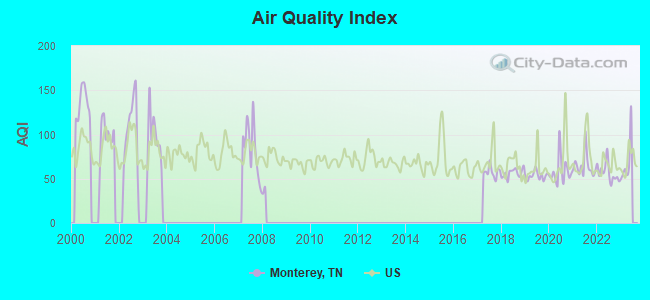
Air Quality Index (AQI) level in 2022 was 56.8. This is better than average.
| City: | 56.8 |
| U.S.: | 72.6 |
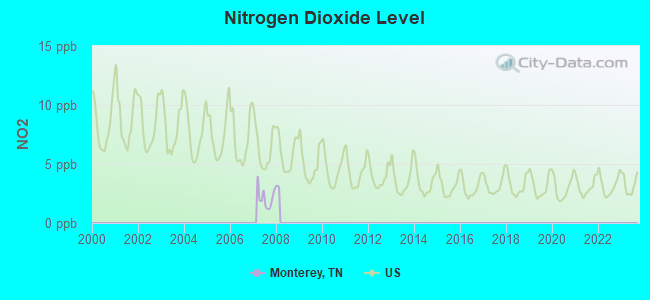
Nitrogen Dioxide (NO2) [ppb] level in 2007 was 2.13. This is significantly better than average. Closest monitor was 8.6 miles away from the city center.
| City: | 2.13 |
| U.S.: | 5.11 |
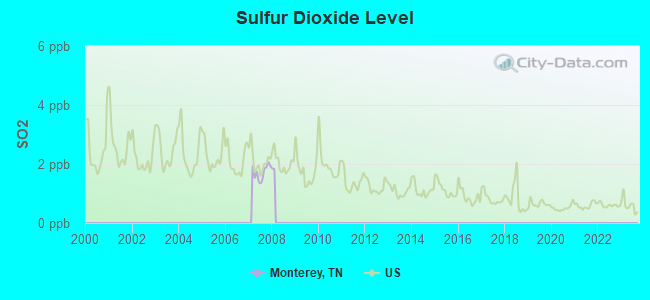
Sulfur Dioxide (SO2) [ppb] level in 2007 was 1.72. This is about average. Closest monitor was 8.6 miles away from the city center.
| City: | 1.72 |
| U.S.: | 1.51 |
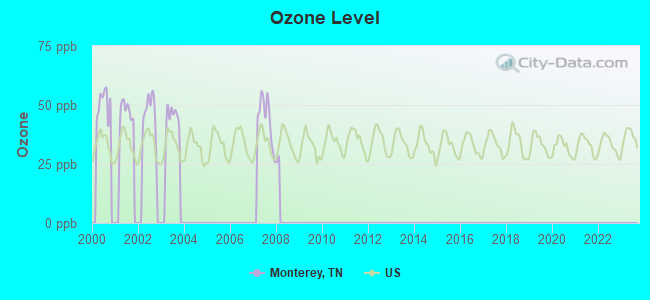
Ozone [ppb] level in 2007 was 44.0. This is worse than average. Closest monitor was 8.6 miles away from the city center.
| City: | 44.0 |
| U.S.: | 33.3 |
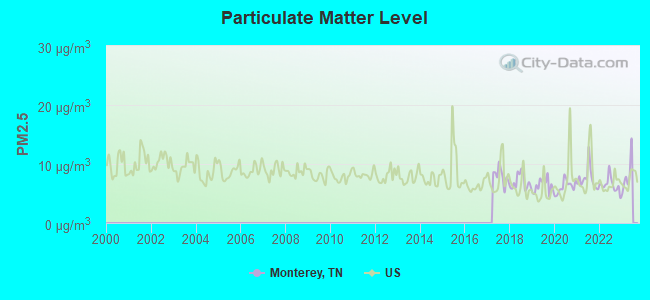
Particulate Matter (PM2.5) [µg/m3] level in 2022 was 6.46. This is better than average. Closest monitor was 12.9 miles away from the city center.
| City: | 6.46 |
| U.S.: | 8.11 |
Tornado activity:
Monterey-area historical tornado activity is near Tennessee state average. It is 34% greater than the overall U.S. average.
On 4/3/1974, a category F4 (max. wind speeds 207-260 mph) tornado 10.5 miles away from the Monterey town center killed 10 people and injured 51 people and caused between $500,000 and $5,000,000 in damages.
On 4/3/1974, a category F4 tornado 12.6 miles away from the town center killed 7 people and injured 150 people and caused between $500,000 and $5,000,000 in damages.
Earthquake activity:
Monterey-area historical earthquake activity is significantly above Tennessee state average. It is 125% greater than the overall U.S. average.On 7/27/1980 at 18:52:21, a magnitude 5.2 (5.1 MB, 4.7 MS, 5.0 UK, 5.2 UK, Class: Moderate, Intensity: VI - VII) earthquake occurred 160.0 miles away from the city center
On 4/18/2008 at 09:36:59, a magnitude 5.4 (5.1 MB, 4.8 MS, 5.4 MW, 5.2 MW) earthquake occurred 215.0 miles away from the city center
On 4/29/2003 at 08:59:39, a magnitude 4.9 (4.4 MB, 4.6 MW, 4.9 LG, Class: Light, Intensity: IV - V) earthquake occurred 116.0 miles away from Monterey center
On 11/30/1973 at 07:48:41, a magnitude 4.7 (4.7 MB, 4.6 ML) earthquake occurred 76.8 miles away from Monterey center
On 12/12/2018 at 09:14:43, a magnitude 4.4 (4.4 MW, Depth: 4.9 mi) earthquake occurred 47.5 miles away from Monterey center
On 4/18/2008 at 09:36:59, a magnitude 5.2 (5.2 MW, Depth: 8.9 mi) earthquake occurred 215.0 miles away from the city center
Magnitude types: regional Lg-wave magnitude (LG), body-wave magnitude (MB), local magnitude (ML), surface-wave magnitude (MS), moment magnitude (MW)
Natural disasters:
The number of natural disasters in Putnam County (13) is near the US average (15).Major Disasters (Presidential) Declared: 8
Emergencies Declared: 2
Causes of natural disasters: Floods: 7, Storms: 6, Tornadoes: 3, Winds: 3, Winter Storms: 3, Flash Floods: 2, Heavy Rain: 1, Hurricane: 1, Ice Storm: 1, Snowfall: 1, Other: 1 (Note: some incidents may be assigned to more than one category).

Hospitals and medical centers in Monterey:
Colleges/universities with over 2000 students nearest to Monterey:
- Tennessee Technological University (about 14 miles; Cookeville, TN; Full-time enrollment: 9,761)
- Roane State Community College (about 41 miles; Harriman, TN; FT enrollment: 4,302)
- Pellissippi State Community College (about 63 miles; Knoxville, TN; FT enrollment: 7,271)
- Middle Tennessee State University (about 65 miles; Murfreesboro, TN; FT enrollment: 21,628)
- Lindsey Wilson College (about 67 miles; Columbia, KY; FT enrollment: 2,552)
- Cleveland State Community College (about 69 miles; Cleveland, TN; FT enrollment: 2,500)
- Volunteer State Community College (about 71 miles; Gallatin, TN; FT enrollment: 5,311)
Public high school in Monterey:
- MONTEREY HIGH SCHOOL (Students: 365, Location: 112 ELM ST, Grades: PK-12)
Private high school in Monterey:
Public elementary/middle school in Monterey:
- BURKS ELEMENTARY (Students: 300, Location: 300 CROSSVILLE ST, Grades: KG-8)
Private elementary/middle school in Monterey:
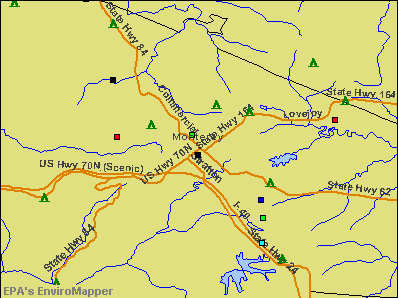
Points of interest:
Notable locations in Monterey: Monterey Volunteer Fire Department (A), Putnam County Fire Department Station 21 (B), Monterey Public Library (C), Monterey City Hall (D). Display/hide their locations on the map
Churches in Monterey include: Wesleyan Church (A), Monterey Methodist Church (B), Monterey Freewill Baptist Church (C), Monterey First Baptist Church (D), Monterey Church of the Nazarene (E), Church of God of Prophecy (F). Display/hide their locations on the map
Cemetery: Welch Memorial Cemetery (1). Display/hide its location on the map
Park in Monterey: Whitaker Park (1). Display/hide its location on the map
Drinking water stations with addresses in Monterey and their reported violations in the past:
MONTEREY WATER DEPT (Population served: 4,692, Surface water):Past monitoring violations:HERITAGE ACADEMY (Population served: 100, Groundwater):
- Monitoring and Reporting (DBP) - Between JUL-2009 and SEP-2009, Contaminant: Chlorine. Follow-up actions: St Public Notif requested (SEP-01-2009), St Violation/Reminder Notice (SEP-01-2009), St Compliance achieved (DEC-31-2009)
- 2 routine major monitoring violations
Past monitoring violations:MOUNTAIN RIDGE GOLF CLUB (Population served: 30, Groundwater):
- Monitoring and Reporting (DBP) - Between APR-2007 and JUN-2007, Contaminant: Chlorine. Follow-up actions: St Compliance achieved (JUL-01-2007), St Public Notif requested (JUL-31-2007), St Violation/Reminder Notice (JUL-31-2007)
Past monitoring violations:
- 3 routine major monitoring violations
Drinking water stations with addresses in Monterey that have no violations reported:
- EAST FORK U D (Population served: 2,937, Primary Water Source Type: Purch surface water)
| This town: | 2.7 people |
| Tennessee: | 2.5 people |
| This town: | 66.5% |
| Whole state: | 67.3% |
| This town: | 6.1% |
| Whole state: | 5.8% |
Likely homosexual households (counted as self-reported same-sex unmarried-partner households)
- Lesbian couples: 0.4% of all households
- Gay men: 0.3% of all households
105 people in nursing homes in 2000
Banks with branches in Monterey (2011 data):
- First Volunteer Bank of Tennessee: Monterey Branch at 210 East Commercial Avenue, branch established on 1972/12/18. Info updated 2008/10/30: Bank assets: $641.6 mil, Deposits: $561.9 mil, headquarters in Chattanooga, TN, positive income, Commercial Lending Specialization, 23 total offices, Holding Company: First Volunteer Corporation
- Bank of Putnam County: Monterey Branch at 100 Commercial Avenue, branch established on 1968/10/04. Info updated 2006/11/03: Bank assets: $371.3 mil, Deposits: $339.3 mil, headquarters in Cookeville, TN, positive income, 8 total offices, Holding Company: B.P.c. Corporation
For population 15 years and over in Monterey:
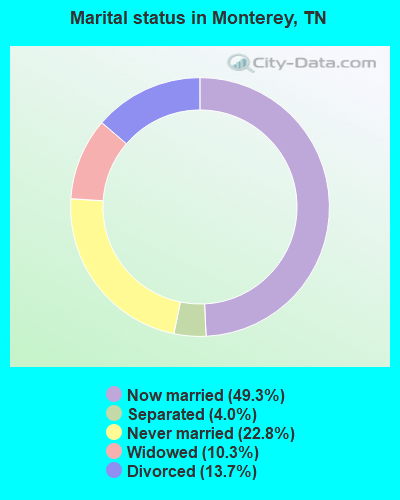
- Never married: 22.8%
- Now married: 49.3%
- Separated: 4.0%
- Widowed: 10.3%
- Divorced: 13.7%
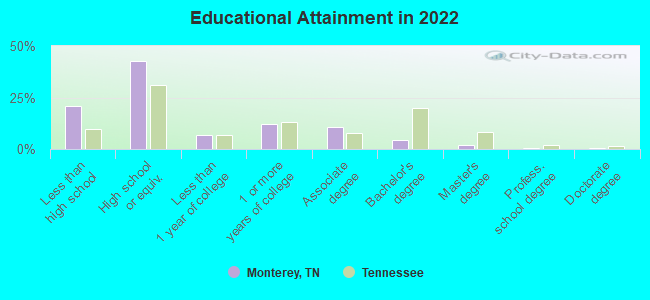
For population 25 years and over in Monterey:
- High school or higher: 74.4%
- Bachelor's degree or higher: 6.3%
- Graduate or professional degree: 2.9%
- Unemployed: 5.4%
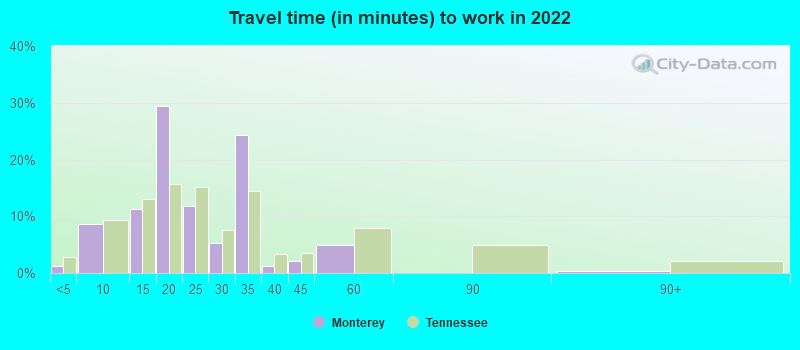
- Mean travel time to work (commute): 24.8 minutes
| Here: | 14.8 |
| Tennessee average: | 11.4 |
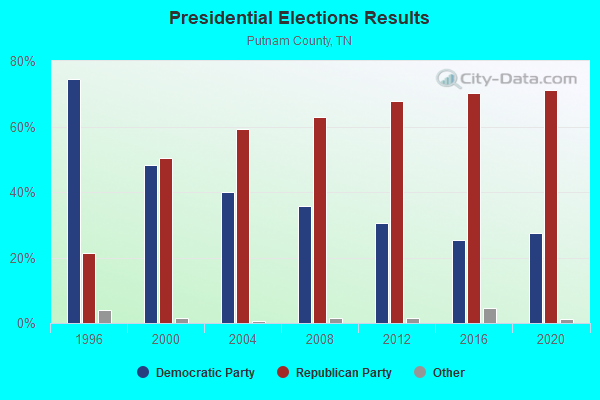
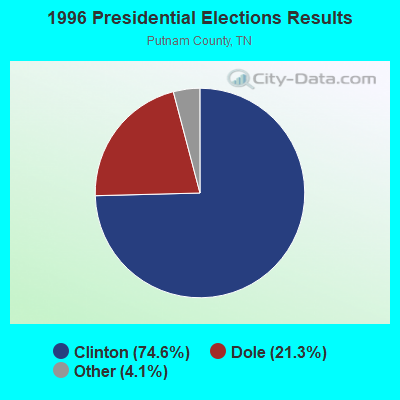
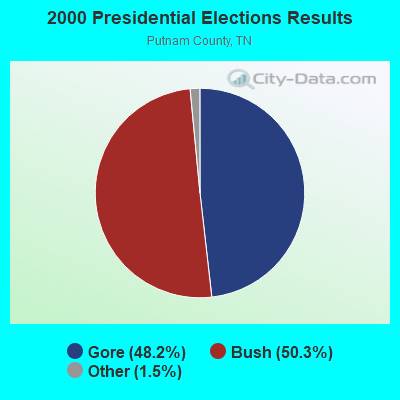
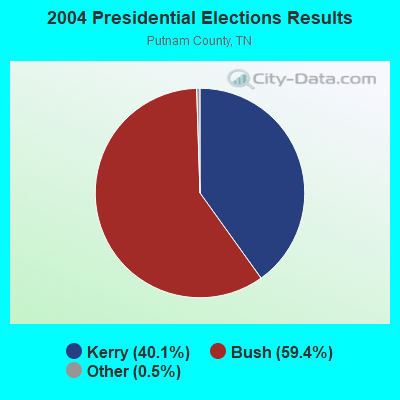
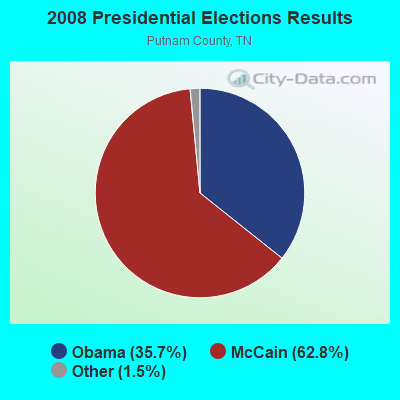

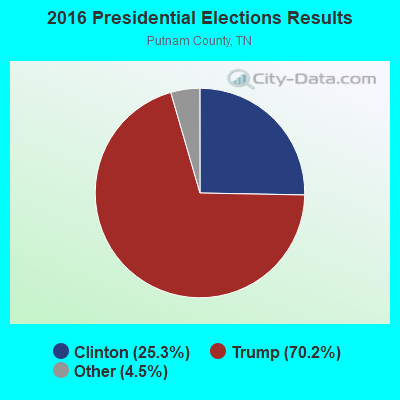
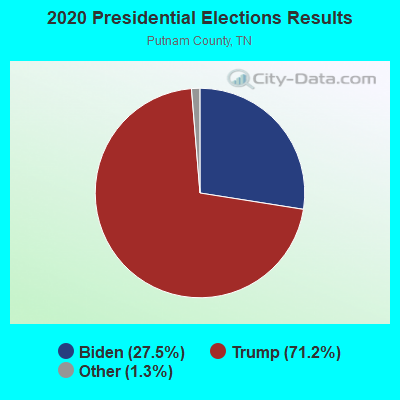
Graphs represent county-level data. Detailed 2008 Election Results
Religion statistics for Monterey, TN (based on Putnam County data)
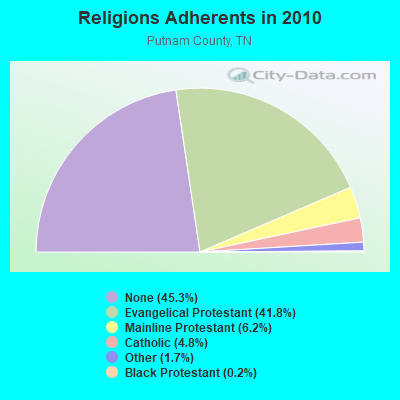
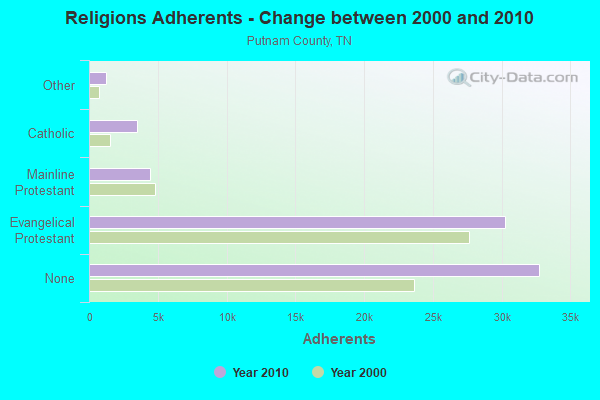
| Religion | Adherents | Congregations |
|---|---|---|
| Evangelical Protestant | 30,222 | 124 |
| Mainline Protestant | 4,456 | 20 |
| Catholic | 3,500 | 1 |
| Other | 1,213 | 6 |
| Black Protestant | 180 | 1 |
| None | 32,750 | - |
Food Environment Statistics:
| Putnam County: | 2.29 / 10,000 pop. |
| Tennessee: | 1.99 / 10,000 pop. |
| Putnam County: | 0.29 / 10,000 pop. |
| Tennessee: | 0.17 / 10,000 pop. |
| Putnam County: | 0.57 / 10,000 pop. |
| Tennessee: | 0.65 / 10,000 pop. |
| This county: | 7.74 / 10,000 pop. |
| Tennessee: | 5.16 / 10,000 pop. |
| Here: | 8.03 / 10,000 pop. |
| Tennessee: | 6.56 / 10,000 pop. |
| Putnam County: | 12.7% |
| Tennessee: | 11.4% |
| Putnam County: | 27.3% |
| Tennessee: | 30.2% |
| Putnam County: | 18.6% |
| Tennessee: | 13.5% |
Health and Nutrition:
| Monterey: | 46.6% |
| State: | 49.3% |
| Monterey: | 42.0% |
| State: | 46.1% |
| Here: | 28.9 |
| Tennessee: | 28.8 |
| Monterey: | 24.2% |
| State: | 21.0% |
| Monterey: | 12.1% |
| Tennessee: | 10.5% |
| Monterey: | 6.8 |
| Tennessee: | 6.8 |
| Here: | 33.5% |
| Tennessee: | 33.9% |
| This city: | 52.2% |
| Tennessee: | 55.9% |
| Monterey: | 76.4% |
| Tennessee: | 79.1% |
More about Health and Nutrition of Monterey, TN Residents
| Local government employment and payroll (March 2022) | |||||
| Function | Full-time employees | Monthly full-time payroll | Average yearly full-time wage | Part-time employees | Monthly part-time payroll |
|---|---|---|---|---|---|
| Police Protection - Officers | 9 | $35,243 | $46,991 | 0 | $0 |
| Water Supply | 7 | $24,067 | $41,258 | 2 | $1,154 |
| Streets and Highways | 2 | $3,022 | $18,132 | 0 | $0 |
| Other Government Administration | 2 | $4,294 | $25,764 | 0 | $0 |
| Sewerage | 2 | $8,728 | $52,368 | 0 | $0 |
| Police - Other | 1 | $3,667 | $44,004 | 0 | $0 |
| Parks and Recreation | 1 | $3,375 | $40,500 | 0 | $0 |
| Solid Waste Management | 1 | $2,524 | $30,288 | 2 | $1,862 |
| Totals for Government | 25 | $84,920 | $40,762 | 4 | $3,016 |
Monterey government finances - Expenditure in 2021 (per resident):
- Current Operations - Water Utilities: $1,707,000 ($623.90)
Police Protection: $1,016,000 ($371.35)
Sewerage: $416,000 ($152.05)
Financial Administration: $393,000 ($143.64)
Regular Highways: $278,000 ($101.61)
Solid Waste Management: $250,000 ($91.37)
Libraries: $35,000 ($12.79)
Local Fire Protection: $29,000 ($10.60)
Central Staff Services: $5,000 ($1.83)
- Total Salaries and Wages: $1,292,000 ($472.22)
Monterey government finances - Revenue in 2021 (per resident):
- Charges - Sewerage: $832,000 ($304.09)
Solid Waste Management: $254,000 ($92.84)
- Miscellaneous - Rents: $291,000 ($106.36)
General Revenue - Other: $84,000 ($30.70)
Fines and Forfeits: $21,000 ($7.68)
Interest Earnings: $3,000 ($1.10)
- Revenue - Water Utilities: $1,565,000 ($572.00)
- State Intergovernmental - Highways: $6,000 ($2.19)
- Tax - General Sales and Gross Receipts: $876,000 ($320.18)
Property: $593,000 ($216.74)
Alcoholic Beverage License: $93,000 ($33.99)
Alcoholic Beverage Sales: $93,000 ($33.99)
Other Selective Sales: $78,000 ($28.51)
Occupation and Business License - Other: $19,000 ($6.94)
| Businesses in Monterey, TN | ||||
| Name | Count | Name | Count | |
|---|---|---|---|---|
| Ace Hardware | 1 | Hardee's | 1 | |
| Burger King | 1 | Subway | 1 | |
| Dairy Queen | 1 | Super 8 | 1 | |
| FedEx | 1 | U-Haul | 1 | |
| H&R Block | 1 | |||
Strongest AM radio stations in Monterey:
- WKVL (850 AM; daytime; 50 kW; KNOXVILLE, TN; Owner: HORNE RADIO, LLC)
- WATX (1590 AM; 2 kW; ALGOOD, TN; Owner: JWC BROADCASTING)
- WWAM (820 AM; daytime; 50 kW; JASPER, TN; Owner: SHELTON BROADCASTING SYSTEM)
- WSM (650 AM; 50 kW; NASHVILLE, TN; Owner: GAYLORD ENTERTAINMENT COMPANY)
- WFLI (1070 AM; 50 kW; LOOKOUT MOUNTAIN, TN; Owner: WFLI, INC.)
- WAMB (1160 AM; 50 kW; DONELSON, TN; Owner: GREAT SOUTHERN BROADCASTING COMPANY, INC.)
- WPTN (780 AM; daytime; 1 kW; COOKEVILLE, TN; Owner: CLEAR CHANNEL BROADCASTING LICENSES, INC.)
- WKDA (1200 AM; 50 kW; NASHVILLE, TN; Owner: RADIO NASHVILLE, INC.)
- WLAC (1510 AM; 50 kW; NASHVILLE, TN; Owner: CAPSTAR TX LIMITED PARTNERSHIP)
- WNQM (1300 AM; 50 kW; NASHVILLE, TN; Owner: WNQM. INC.)
- WLIV (920 AM; 1 kW; LIVINGSTON, TN; Owner: SUNNY BROADCASTING, L.L.C.)
- WHUB (1400 AM; 1 kW; COOKEVILLE, TN; Owner: CLEAR CHANNEL BROADCASTING LICENSES, INC.)
- WECO (940 AM; 5 kW; WARTBURG, TN; Owner: MORGAN COUNTY B/CASTING CO.)
Strongest FM radio stations in Monterey:
- WKXD-FM (106.9 FM; MONTEREY, TN; Owner: JWC BROADCASTING)
- WGSQ (94.7 FM; COOKEVILLE, TN; Owner: CLEAR CHANNEL BROADCASTING LICENSES, INC.)
- WWOG (90.9 FM; COOKEVILLE, TN; Owner: SOMERSET EDUCATIONAL BROADCASTING FOUNDATION)
- WLIV-FM (104.7 FM; MONTEREY, TN; Owner: WKXN INC)
- WOWF (102.5 FM; CROSSVILLE, TN; Owner: PEG BROADCASTING, INC.)
- WLQK (95.9 FM; LIVINGSTON, TN; Owner: JWC BROADCASTING)
- WGIC (98.5 FM; COOKEVILLE, TN; Owner: CLEAR CHANNEL BROADCASTING LICENSES, INC.)
- W206AJ (89.1 FM; COOKEVILLE, TN; Owner: WAY-FM MEDIA GROUP, INC.)
- WHRS (91.7 FM; COOKEVILLE, TN; Owner: NASHVILLE PUBLIC RADIO)
- WMKW (89.3 FM; CROSSVILLE, TN; Owner: THE MOODY BIBLE INSTITUTE OF CHICAGO)
- WBXE (93.7 FM; BAXTER, TN; Owner: JWC BROADCASTING)
- WWSR (105.7 FM; ROCKWOOD, TN; Owner: SOUTHERN MEDIA GROUP, INC.)
- WDVX (89.9 FM; CLINTON, TN; Owner: CUMBERLAND COMMUNITIES COMMUNI CORP.)
- WRKK-FM (105.5 FM; SPARTA, TN; Owner: CLEAR CHANNEL BROADCASTING LICENSES, INC.)
- WCLC-FM (105.1 FM; JAMESTOWN, TN; Owner: BIBLE BELIEVERS NETWORK, INC.)
- WECO-FM (101.3 FM; WARTBURG, TN; Owner: MORGAN COUNTY BROADCASTING CO., INC.)
- WXVL (99.3 FM; CROSSVILLE, TN; Owner: CLEAR CHANNEL BROADCASTING LICENSES, INC.)
- WZYZ (90.1 FM; SPENCER, TN; Owner: CHURCH FAITH TRINITY ASSEMBLIES)
- W211AS (90.1 FM; SPENCER, TN; Owner: AMERICAN FAMILY ASSOCIATION)
- WDEB-FM (103.9 FM; JAMESTOWN, TN; Owner: BAZ BROADCASTING, INC.)
TV broadcast stations around Monterey:
- WCTE (Channel 22; COOKEVILLE, TN; Owner: UPPER CUMBERLAND BROADCAST COUNCIL)
- WBXX-TV (Channel 20; CROSSVILLE, TN; Owner: ACME TV LICENSES OF TENNESSEE, LLC)
- W57CZ (Channel 57; COOKEVILLE, TN; Owner: TRINITY BROADCASTING NETWORK)
- WFLI-TV (Channel 53; CLEVELAND, TN; Owner: CHATTANOOGA MEDIA HOLDINGS, L.L.C.)
- National Bridge Inventory (NBI) Statistics
- 29Number of bridges
- 246ft / 75.5mTotal length
- $7,716,000Total costs
- 395,018Total average daily traffic
- 117,058Total average daily truck traffic
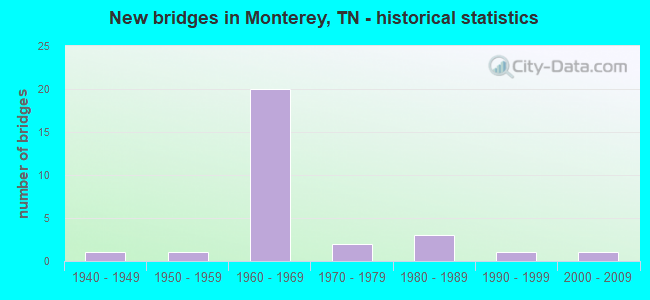
- New bridges - historical statistics
- 11940-1949
- 11950-1959
- 201960-1969
- 21970-1979
- 31980-1989
- 11990-1999
- 12000-2009
FCC Registered Antenna Towers: 97 (See the full list of FCC Registered Antenna Towers)
FCC Registered Private Land Mobile Towers: 1 (See the full list of FCC Registered Private Land Mobile Towers in Monterey, TN)
FCC Registered Broadcast Land Mobile Towers: 9 (See the full list of FCC Registered Broadcast Land Mobile Towers)
FCC Registered Microwave Towers: 15 (See the full list of FCC Registered Microwave Towers in this town)
FCC Registered Paging Towers: 2 (See the full list of FCC Registered Paging Towers)
FCC Registered Amateur Radio Licenses: 57 (See the full list of FCC Registered Amateur Radio Licenses in Monterey)
FAA Registered Aircraft Manufacturers and Dealers: 1 (See the full list of FAA Registered Manufacturers and Dealers in Monterey)
FAA Registered Aircraft: 12 (See the full list of FAA Registered Aircraft)
2002 - 2018 National Fire Incident Reporting System (NFIRS) incidents
- Fire incident types reported to NFIRS in Monterey, TN
- 23440.4%Structure Fires
- 21036.3%Outside Fires
- 12421.4%Mobile Property/Vehicle Fires
- 111.9%Other
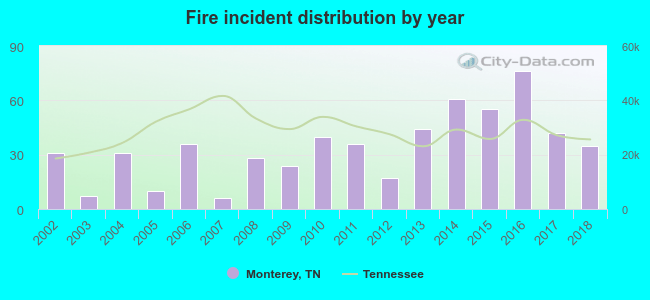 According to the data from the years 2002 - 2018 the average number of fire incidents per year is 34. The highest number of fires - 76 took place in 2016, and the least - 6 in 2007. The data has a rising trend.
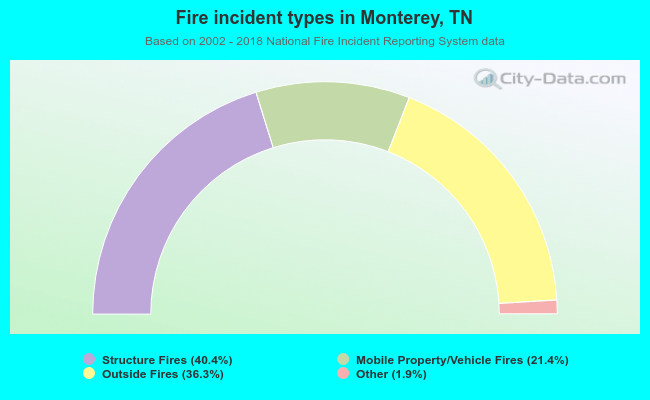 When looking into fire subcategories, the most incidents belonged to: Structure Fires (40.4%), and Outside Fires (36.3%).
| Most common first names in Monterey, TN among deceased individuals | ||
| Name | Count | Lived (average) |
|---|---|---|
| James | 84 | 70.8 years |
| William | 49 | 75.4 years |
| John | 47 | 76.2 years |
| Mary | 44 | 79.8 years |
| Robert | 34 | 72.0 years |
| Willie | 32 | 74.2 years |
| George | 28 | 78.0 years |
| Charles | 24 | 72.5 years |
| Thomas | 17 | 70.1 years |
| Betty | 15 | 69.3 years |
| Most common last names in Monterey, TN among deceased individuals | ||
| Last name | Count | Lived (average) |
|---|---|---|
| Phillips | 94 | 73.7 years |
| Buckner | 41 | 72.2 years |
| Looper | 40 | 77.6 years |
| Wilson | 35 | 75.6 years |
| Walker | 34 | 76.3 years |
| Bilbrey | 33 | 73.4 years |
| Henry | 30 | 76.3 years |
| Whittaker | 30 | 75.2 years |
| Norrod | 27 | 77.3 years |
| Harris | 25 | 79.0 years |
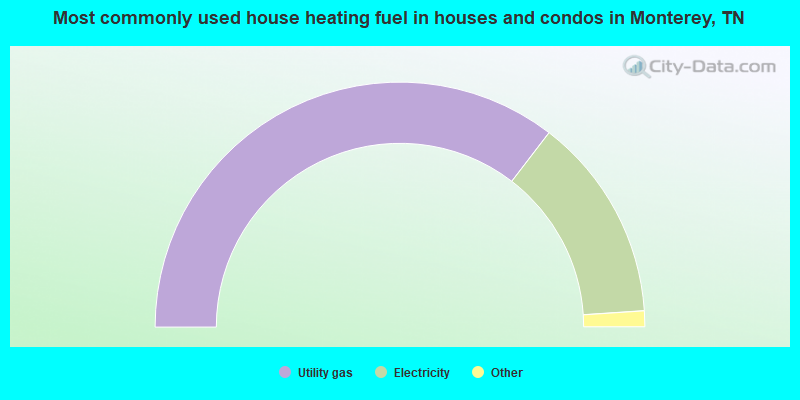
- 70.9%Utility gas
- 27.1%Electricity
- 1.0%Wood
- 1.0%Other fuel
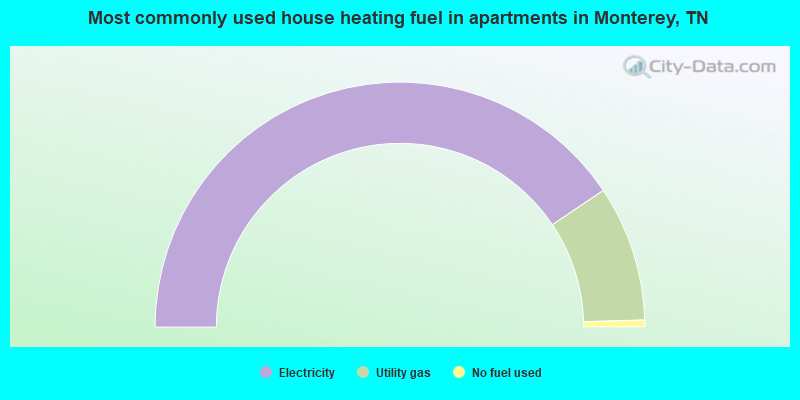
- 81.2%Electricity
- 17.9%Utility gas
- 0.9%No fuel used
Monterey compared to Tennessee state average:
- Median household income below state average.
- Median house value below state average.
- Unemployed percentage below state average.
- Black race population percentage significantly below state average.
- Hispanic race population percentage significantly above state average.
- Median age below state average.
- Foreign-born population percentage above state average.
- Renting percentage above state average.
- Length of stay since moving in significantly above state average.
- Institutionalized population percentage above state average.
- Number of college students below state average.
- Percentage of population with a bachelor's degree or higher significantly below state average.
Monterey on our top lists:
- #61 on the list of "Top 101 cities with the most residents born in Guatemala (population 500+)"
- #79 (38574) on the list of "Top 101 zip codes with the largest percentage of United States first ancestries (pop 5,000+)"
- #35 on the list of "Top 101 counties with the smallest number of children under 18 without health insurance coverage in 2000 (pop. 50,000+)"
- #69 on the list of "Top 101 counties with the lowest ground withdrawal of fresh water for public supply"
- #93 on the list of "Top 101 counties with the smallest number of people without health insurance coverage in 2000 (pop. 50,000+)"

|
Total of 4 patent applications in 2008-2024.