Estimated zip code population in 2022: 1,440 Zip code population in 2010: 1,923 Zip code population in 2000: 2,055
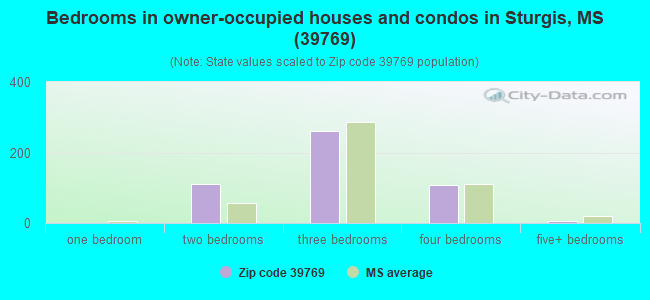
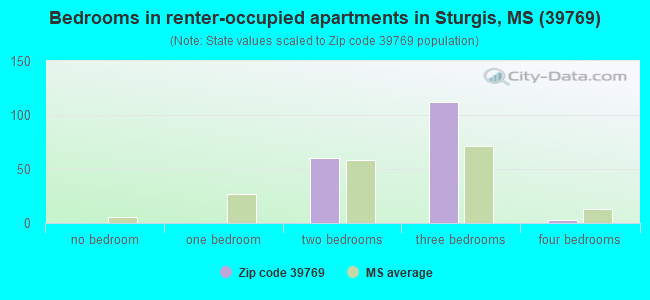
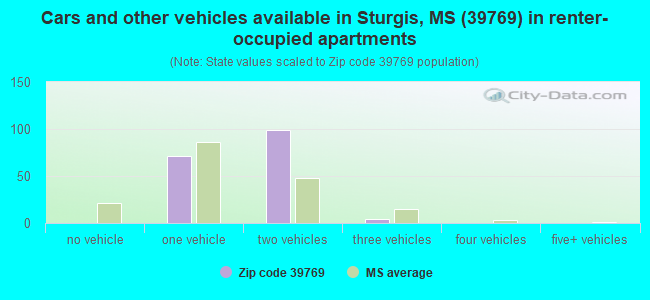
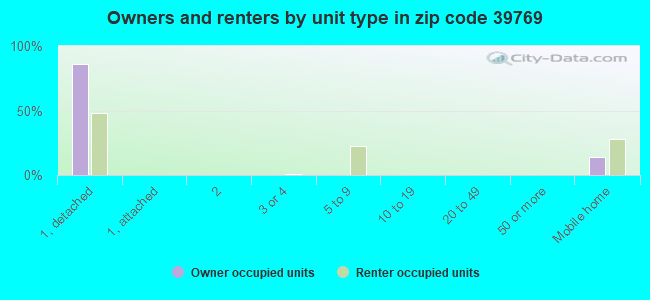
Houses and condos: 778 Renter-occupied apartments: 174
% of renters here:
26%
State:
30%
March 2022 cost of living index in zip code 39769: 79.1 (low, U.S. average is 100)
Land area: 142.0 sq. mi. Water area: 0.3 sq. mi.
Population density: 10 people per square mile
(very low).
OSM Map
General Map
Google Map
MSN Map
OSM Map
General Map
Google Map
MSN Map
OSM Map
General Map
Google Map
MSN Map
OSM Map
General Map
Google Map
MSN Map
Please wait while loading the map...
Real estate property taxes paid for housing units in 2022:
This zip code:
0.4% ($749)
Mississippi:
0.7% ($1,161)
Median real estate property taxes paid for housing units with mortgages in 2022: $1,274 (0.7%) Median real estate property taxes paid for housing units with no mortgage in 2022: $597 (0.4%)
Business Search- 14 Million verified businesses
Males: 757
(52.6%)
Females: 682
(47.4%)
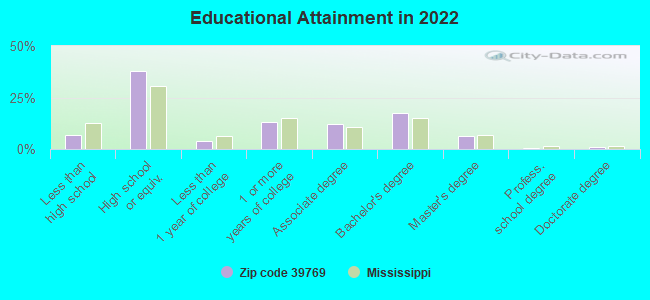
For population 25 years and over in 39769:
High school or higher: 94.0%
Bachelor's degree or higher: 26.2%
Graduate or professional degree: 8.6%
Unemployed: 2.2%
Mean travel time to work (commute): 31.6 minutes
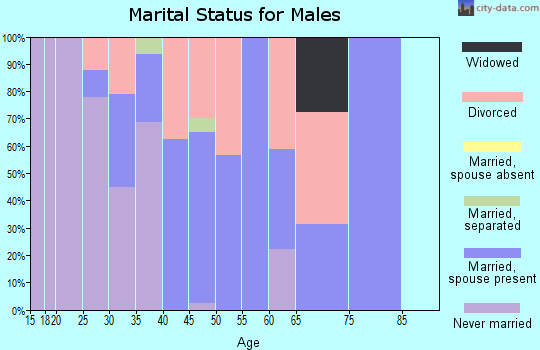
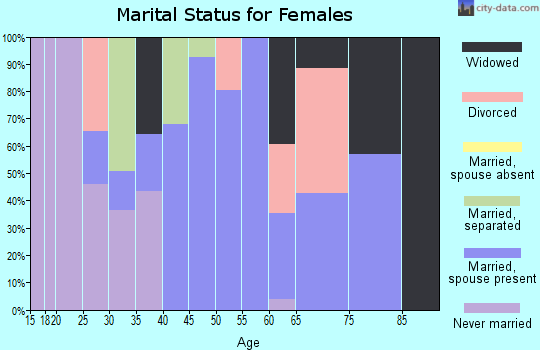
For population 15 years and over in 39769:
Never married: 22.4%
Now married: 60.0%
Separated: 0.2%
Widowed: 5.2%
Divorced: 12.3%
Zip code 39769 compared to state average:
Unemployed percentage below state average.
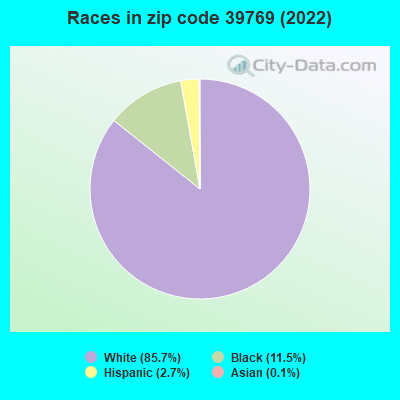
Black race population percentage significantly below state average.
Foreign-born population percentage significantly below state average.
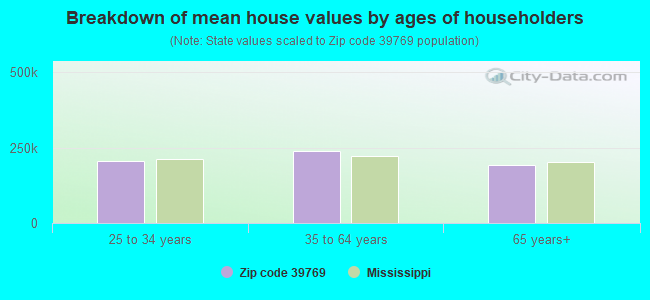
Estimated median house/condo value in 2022: $181,763
39769:
$181,763
Mississippi:
$162,500
According to our research of Mississippi and other state lists, there was 1 registered sex offender living in 39769 zip code as of April 27, 2024. The ratio of all residents to sex offenders in zip code 39769 is 1,999 to 1. The ratio of registered sex offenders to all residents in this zip code is much lower than the state average.
Median resident age:
This zip code:
36.2 years
Mississippi median age:
38.9 years
Average household size:
This zip code:
2.2 people
Mississippi:
2.5 people
Averages for the 2020 tax year for zip code 39769, filed in 2021:
Average Adjusted Gross Income (AGI) in 2020: $50,936 (Individual Income Tax Returns)
Here:
$50,936
State:
$54,084
Salary/wage: $45,350 (reported on 76.5% of returns)
Here:
$45,350
State:
$45,187
(% of AGI for various income ranges: 1302.5% for AGIs below $25k, 3583.3% for AGIs $25k-50k, 6987.8% for AGIs $50k-75k, 9048.0% for AGIs $75k-100k, 15540.0% for AGIs $100k-200k)
Taxable interest for individuals: $756 (reported on 30.9% of returns)
This zip code:
$756
Mississippi:
$1,434
(% of AGI for various income ranges: 10.5% for AGIs below $25k, 29.3% for AGIs $25k-50k, 45.6% for AGIs $50k-75k, 52.0% for AGIs $75k-100k, 95.0% for AGIs $100k-200k)
Ordinary dividends: $1,343 (reported on 8.6% of returns)
Here:
$1,343
State:
$6,661
(% of AGI for various income ranges: 20.0% for AGIs below $25k, 30.0% for AGIs $50k-75k, 45.0% for AGIs $100k-200k)
Net capital gain/loss in AGI: +$2,900 (reported on 8.6% of returns)
Here:
+$2,900
State:
+$16,833
(% of AGI for various income ranges: 55.3% for AGIs $25k-50k, 226.7% for AGIs $100k-200k)
Profit/loss from business: +$9,183 (reported on 22.2% of returns)
Here:
+$9,183
State:
+$7,724
(% of AGI for various income ranges: 170.5% for AGIs below $25k, 250.7% for AGIs $25k-50k, 264.4% for AGIs $50k-75k, 438.0% for AGIs $75k-100k, 798.3% for AGIs $100k-200k)
Taxable individual retirement arrangement distribution: $10,550 (reported on 7.4% of returns)
39769:
$10,550
Mississippi:
$17,717
(% of AGI for various income ranges: 112.5% for AGIs below $25k, 453.3% for AGIs $50k-75k)
Total itemized deductions: $22,667 (reported on 3.7% of returns)
Here:
$22,667
State:
$34,027
(% of AGI for various income ranges: 755.6% for AGIs $50k-75k)
Charity contributions: $6,500 (reported on 2.5% of returns)
Here:
$6,500
State:
$14,997
(% of AGI for various income ranges: 86.7% for AGIs $25k-50k)
Taxes paid: $5,200 (reported on 3.7% of returns)
39769:
$5,200
State:
$6,353
(% of AGI for various income ranges: 173.3% for AGIs $50k-75k)
Earned income credit: $2,456 (reported on 19.8% of returns)
Here:
$2,456
State:
$2,689
(% of AGI for various income ranges: 117.5% for AGIs below $25k, 105.3% for AGIs $25k-50k)
Percentage of individuals using paid preparers for their 2020 taxes: 93.8%
Here:
94%
State:
94%
(% for various income ranges: 96.4% for AGIs below $25k, 95.0% for AGIs $25k-50k, 92.9% for AGIs $50k-75k, 87.5% for AGIs $75k-100k, 90.9% for AGIs $100k-200k)
Averages for the 2012 tax year for zip code 39769, filed in 2013:
Average Adjusted Gross Income (AGI) in 2012: $40,509 (Individual Income Tax Returns)
Here:
$40,509
State:
$46,197
Salary/wage: $35,610 (reported on 80.8% of returns)
Here:
$35,610
State:
$38,549
(% of AGI for various income ranges: 71.5% for AGIs below $25k, 80.9% for AGIs $25k-50k, 77.8% for AGIs $50k-75k, 74.6% for AGIs $75k-100k, 47.2% for AGIs $100k-200k)
Taxable interest for individuals: $870 (reported on 29.5% of returns)
This zip code:
$870
Mississippi:
$1,482
(% of AGI for various income ranges: 1.2% for AGIs below $25k, 0.2% for AGIs $25k-50k, 1.0% for AGIs $50k-75k, 0.5% for AGIs $75k-100k, 0.4% for AGIs $100k-200k)
Ordinary dividends: $1,200 (reported on 9.0% of returns)
Here:
$1,200
State:
$5,401
Net capital gain/loss in AGI: +$6,433 (reported on 7.7% of returns)
Here:
+$6,433
State:
+$12,121
Profit/loss from business: +$6,844 (reported on 23.1% of returns)
Here:
+$6,844
State:
+$10,220
(% of AGI for various income ranges: 12.4% for AGIs below $25k, 3.5% for AGIs $25k-50k, 3.1% for AGIs $50k-75k, 3.6% for AGIs $75k-100k)
Taxable individual retirement arrangement distribution: $7,700 (reported on 6.4% of returns)
39769:
$7,700
Mississippi:
$13,665
Total itemized deductions: $18,671 (28% of AGI, reported on 21.8% of returns)
Here:
$18,671
State:
$22,078
Here:
27.8% of AGI
State:
21.8% of AGI
(% of AGI for various income ranges: 7.5% for AGIs below $25k, 10.8% for AGIs $25k-50k, 8.4% for AGIs $50k-75k, 10.9% for AGIs $75k-100k, 11.7% for AGIs $100k-200k)
Charity contributions: $4,717 (reported on 15.4% of returns)
Here:
$4,717
State:
$6,081
(% of AGI for various income ranges: 2.5% for AGIs $25k-50k, 1.4% for AGIs $50k-75k, 2.0% for AGIs $75k-100k, 2.3% for AGIs $100k-200k)
Taxes paid: $3,718 (reported on 21.8% of returns)
39769:
$3,718
State:
$5,794
(% of AGI for various income ranges: 0.8% for AGIs below $25k, 1.5% for AGIs $25k-50k, 1.7% for AGIs $50k-75k, 2.4% for AGIs $75k-100k, 3.1% for AGIs $100k-200k)
Earned income credit: $2,376 (reported on 26.9% of returns)
Here:
$2,376
State:
$2,710
(% of AGI for various income ranges: 10.0% for AGIs below $25k, 1.1% for AGIs $25k-50k)
Percentage of individuals using paid preparers for their 2012 taxes: 60.3%
Here:
60%
State:
60%
(% for various income ranges: 60.6% for AGIs below $25k, 57.1% for AGIs $25k-50k, 54.5% for AGIs $50k-75k, 62.5% for AGIs $75k-100k, 80.0% for AGIs $100k-200k)
Averages for the 2004 tax year for zip code 39769, filed in 2005:
Average Adjusted Gross Income (AGI) in 2004: $32,680 (Individual Income Tax Returns)
Here:
$32,680
State:
$36,110
Salary/wage: $30,406 (reported on 83.7% of returns)
Here:
$30,406
State:
$31,757
(% of AGI for various income ranges: 123.0% for AGIs below $10k, 78.0% for AGIs $10k-25k, 82.2% for AGIs $25k-50k, 77.6% for AGIs $50k-75k, 78.2% for AGIs $75k-100k, 58.1% for AGIs over 100k)
Taxable interest for individuals: $1,793 (reported on 29.7% of returns)
This zip code:
$1,793
Mississippi:
$1,649
(% of AGI for various income ranges: 2.2% for AGIs below $10k, 2.6% for AGIs $10k-25k, 1.1% for AGIs $25k-50k, 0.8% for AGIs $50k-75k, 0.5% for AGIs $75k-100k, 4.7% for AGIs over 100k)
Taxable dividends: $1,085 (reported on 9.5% of returns)
Here:
$1,085
State:
$3,089
(% of AGI for various income ranges: 0.6% for AGIs $10k-25k, 0.2% for AGIs $25k-50k, 0.3% for AGIs $50k-75k, 0.7% for AGIs $75k-100k)
Net capital gain/loss: +$5,585 (reported on 7.1% of returns)
Here:
+$5,585
State:
+$8,427
(% of AGI for various income ranges: -2.4% for AGIs below $10k, 0.1% for AGIs $25k-50k, 1.7% for AGIs $50k-75k, 6.2% for AGIs $75k-100k)
Profit/loss from business: +$7,403 (reported on 19.3% of returns)
Here:
+$7,403
State:
+$8,818
(% of AGI for various income ranges: -5.0% for AGIs below $10k, 5.6% for AGIs $10k-25k, 5.4% for AGIs $25k-50k, 4.8% for AGIs $50k-75k, 5.1% for AGIs $75k-100k)
IRA payment deduction: $3,500 (reported on 1.3% of returns)
39769:
$3,500
Mississippi:
$3,024
Total itemized deductions: $15,445 (24% of AGI, reported on 18.3% of returns)
Here:
$15,445
State:
$17,896
Here:
24.4% of AGI
State:
22.5% of AGI
(% of AGI for various income ranges: 3.8% for AGIs $10k-25k, 7.7% for AGIs $25k-50k, 8.0% for AGIs $50k-75k, 11.2% for AGIs $75k-100k, 17.9% for AGIs over 100k)
Charity contributions deductions: $3,790 (6% of AGI, reported on 15.9% of returns)
Here:
$3,790
State:
$4,735
Here:
5.9% of AGI
State:
5.7% of AGI
(% of AGI for various income ranges: 1.7% for AGIs $25k-50k, 1.7% for AGIs $50k-75k, 3.6% for AGIs $75k-100k, 3.6% for AGIs over 100k)
Total tax: $3,541 (reported on 74.0% of returns)
39769:
$3,541
State:
$5,562
(% of AGI for various income ranges: 4.2% for AGIs below $10k, 3.5% for AGIs $10k-25k, 6.4% for AGIs $25k-50k, 9.1% for AGIs $50k-75k, 11.2% for AGIs $75k-100k, 13.2% for AGIs over 100k)
Earned income credit: $1,749 (reported on 25.6% of returns)
Here:
$1,749
State:
$2,107
Percentage of individuals using paid preparers for their 2004 taxes: 69.9%
Here:
70%
State:
65%
(% for various income ranges: 59.7% for AGIs below $10k, 69.9% for AGIs $10k-25k, 75.0% for AGIs $25k-50k, 69.9% for AGIs $50k-75k, 69.4% for AGIs $75k-100k, 90.0% for AGIs over 100k)
Household received Food Stamps/SNAP in the past 12 months: 5 Household did not receive Food Stamps/SNAP in the past 12 months: 658
Women who had a birth in the past 12 months: 25 (23 now married, 2 unmarried) Women who did not have a birth in the past 12 months: 201 (121 now married, 79 unmarried)
Housing units in zip code 39769 with a mortgage: 183 (18 second mortgage, 3 both second mortgage and home equity loan) Median monthly owner costs for units with a mortgage: $1,210 Median monthly owner costs for units without a mortgage: $368
Residents with income below the poverty level in 2022:
This zip code:
17.2%
Whole state:
19.1%
Residents with income below 50% of the poverty level in 2022:
This zip code:
7.0%
Whole state:
10.3%
Median number of rooms in houses and condos:
Here:
6.1
State:
6.3
Median number of rooms in apartments:
Here:
4.4
State:
4.8
Notable locations in this zip code not listed on our city pages
Churches in zip code 39769 include: Pleasant Ridge Baptist Church (A), Big Creek Methodist Church (B), Sturgis United Methodist Church (C), Sturgis Presbyterian Church (D), Sturgis Baptist Church (E), Morgan Chapel Baptist Church (F), Chestnut Grove Baptist Church (G), Wake Forest Baptist Church (H), Spring Hill Church (I). Display/hide their locations on the map
Cemeteries: Mount Olive Cemetery (1), Wake Forest Cemetery (2), Sturgis Cemetery (3), Pleasant Ridge Cemetery (4), Morgan Chapel Cemetery (5), Beg Creek Cemetery (6), Bethel Cemetery (7). Display/hide their locations on the map
Streams, rivers, and creeks: Bearfoot Branch (A), Bogue Fallah (B), Boughenia Creek (C), Camp Branch (D), Dry Creek (E), Golden Horn Creek (F), Lawson Branch (G), Panther Creek (H), Red Bank Creek (I). Display/hide their locations on the map
Size of family households: 190 2-persons, 52 3-persons, 44 4-persons, 49 5-persons, 3 6-persons, 13 7-or-more-persons
Size of nonfamily households: 307 1-person, 5 2-persons
176 married couples with children.
154 single-parent households (36 men, 118 women).
96.2% of residents of 39769 zip code speak English at home.
4.4% of residents speak Spanish at home (100% very well).
0.2% of residents speak other Indo-European language at home (100% very well).
Foreign born population: 0 (0.0%)
:
0.0%
Whole state:
2.2%
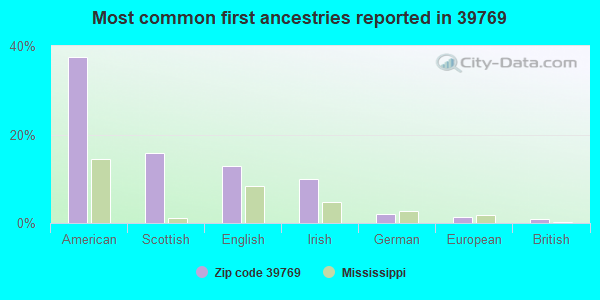
37%American
16%Scottish
13%English
10%Irish
2%German
1%European
1%British
Facilities with environmental interests located in this zip code:
GARNERS MEAT PROCESSING (2412 HAMIL ROAD in STURGIS, MS)
STATE MASTER (Mississippi compliance, permits, activity tracking ) - ENSITE-MS0037419, National Pollutant Discharge Elimination System Permit National Pollutant Discharge Elimination System NON-MAJOR (Tracking pollutant discharge elimination systems) - permit Business SIC classification: MEAT PACKING PLANTS Alternative names: GARNER S MEAT PROCESSING, GARNER'S MEAT PROCESSING PLANT, GRANER'S MEAT PROCESSING PLANT, OKTIBBEHA COUNTY
Housing units lacking complete plumbing facilities: 2.9% Housing units lacking complete kitchen facilities: 4.5%
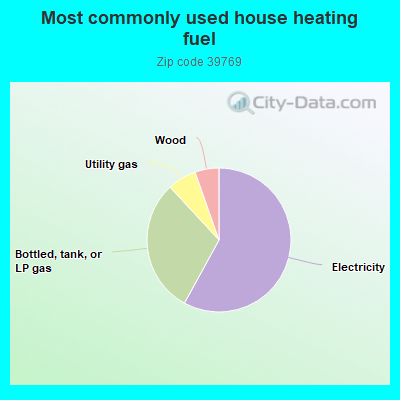
58.1%Electricity
30.2%Bottled, tank, or LP gas
6.5%Utility gas
5.4%Wood
Population in 1990: 814. Population change in the 1990s: +1,241 (+152.5%).
Place of birth for U.S.-born residents:
This state: 1,211
Northeast: 14
Midwest: 14
South: 163
West: 32
62% of the 39769 zip code residents lived in the same house 5 years ago. Out of people who lived in different houses, 63% lived in this county. Out of people who lived in different counties, 50% lived in Mississippi.
95% of the 39769 zip code residents lived in the same house 1 year ago. Out of people who lived in different houses, 15% moved from this county. Out of people who lived in different houses, 40% moved from different county within same state. Out of people who lived in different houses, 49% moved from different state.
Private vs. public school enrollment:
Students in private schools in grades 1 to 8 (elementary and middle school): 54
Here:
37.4%
Mississippi:
16.1%
Students in private schools in grades 9 to 12 (high school): 20
Here:
57.9%
Mississippi:
14.6%
Students in private undergraduate colleges:
Here:
0.0%
Mississippi:
12.8%
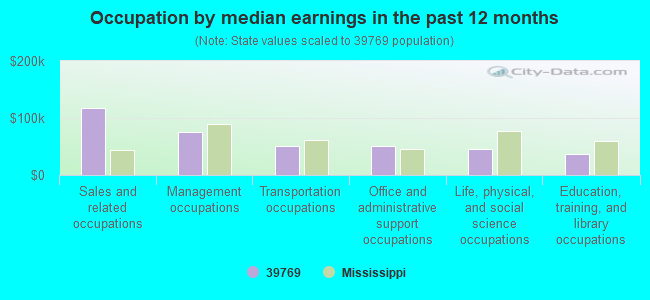
Occupation by median earnings in the past 12 months ($)
117,428Sales and related occupations
76,191Management occupations
50,768Transportation occupations
50,730Office and administrative support occupations
45,187Life, physical, and social science occupations
37,132Education, training, and library occupations
Top industries in this zip code by the number of employees in 2005:
Administrative and Support and Waste Management and Remediation Services: Landscaping Services (1-4: 2)
Other Services (except Public Administration): Religious Organizations (1-4: 2)
Construction: Drywall and Insulation Contractors (1-4: 2)
Construction: Site Preparation Contractors (1-4: 1)
Other Services (except Public Administration): Civic and Social Organizations (1-4: 1)
Health Care and Social Assistance: Other Residential Care Facilities (1-4: 1)
Fatal accident statistics in 2014:
Fatal accident count: 1
Vehicles involved in fatal accidents: 1
Fatal accidents caused by drunken drivers: 0
Fatalities: 1
Persons involved in fatal accidents: 1
Pedestrians involved in fatal accidents: 0
Fatal accident statistics in 2013:
Fatal accident count: 1
Vehicles involved in fatal accidents: 1
Fatal accidents caused by drunken drivers: 0
Fatalities: 1
Persons involved in fatal accidents: 1
Pedestrians involved in fatal accidents: 0
2002 - 2018 National Fire Incident Reporting System (NFIRS) incidents
According to the data from the years 2002 - 2018 the average number of fires per year is 16. The highest number of reported fires - 29 took place in 2006, and the least - 2 in 2003. The data has a rising trend.
When looking into fire subcategories, the most incidents belonged to: Structure Fires (47.3%), and Outside Fires (42.1%).
Fire incident types reported to NFIRS in Zip Code 39769


 Nearest zip codes: 39735, 39339, 39759, 39752, 39750, 39762.
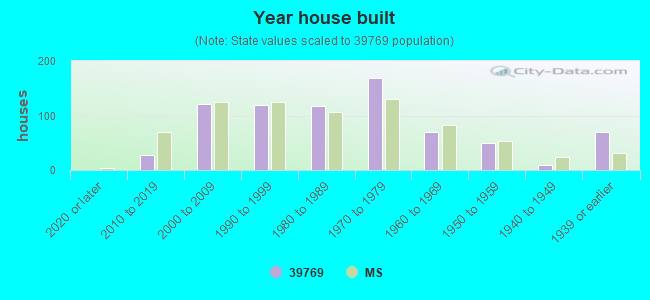


 According to the data from the years 2002 - 2018 the average number of fires per year is 16. The highest number of reported fires - 29 took place in 2006, and the least - 2 in 2003. The data has a rising trend.
 When looking into fire subcategories, the most incidents belonged to: Structure Fires (47.3%), and Outside Fires (42.1%).