Estimated zip code population in 2022: 2,773 Zip code population in 2010: 2,763 Zip code population in 2000: 2,896
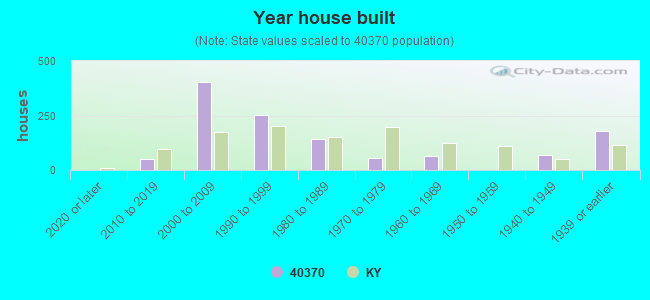
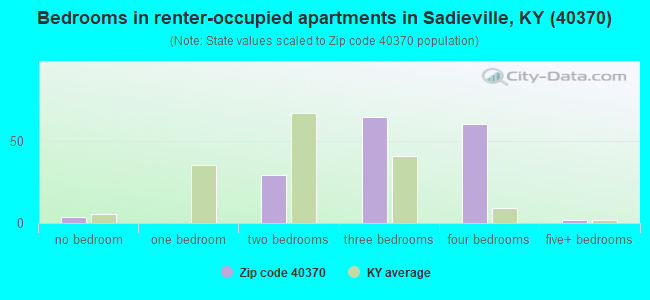
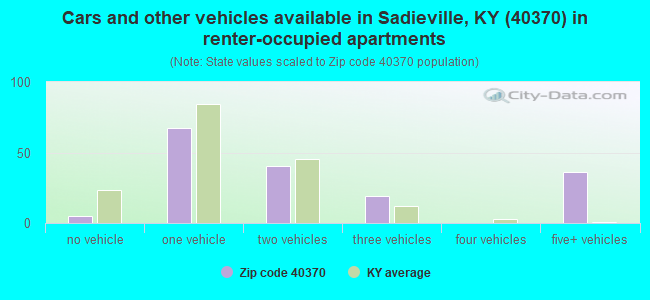
Houses and condos: 1,233 Renter-occupied apartments: 167
% of renters here:
15%
State:
31%
March 2022 cost of living index in zip code 40370: 83.8 (less than average, U.S. average is 100)
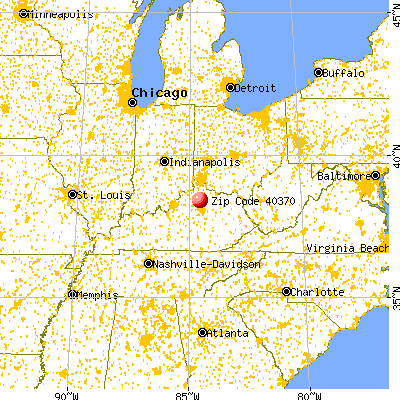
Land area: 83.2 sq. mi. Water area: 0.7 sq. mi.
Population density: 33 people per square mile
(very low).
OSM Map
General Map
Google Map
MSN Map
OSM Map
General Map
Google Map
MSN Map
OSM Map
General Map
Google Map
MSN Map
OSM Map
General Map
Google Map
MSN Map
Please wait while loading the map...
Real estate property taxes paid for housing units in 2022:
This zip code:
0.5% ($1,531)
Kentucky:
0.7% ($1,456)
Median real estate property taxes paid for housing units with mortgages in 2022: $1,671 (0.5%) Median real estate property taxes paid for housing units with no mortgage in 2022: $920 (0.4%)
Business Search- 14 Million verified businesses
Males: 1,358
(49.0%)
Females: 1,415
(51.0%)
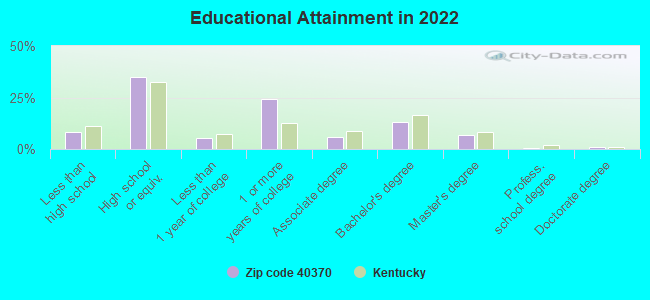
For population 25 years and over in 40370:
High school or higher: 90.8%
Bachelor's degree or higher: 20.9%
Graduate or professional degree: 8.0%
Unemployed: 9.0%
Mean travel time to work (commute): 28.9 minutes
For population 15 years and over in 40370:
Never married: 19.0%
Now married: 68.4%
Separated: 0.6%
Widowed: 2.7%
Divorced: 9.4%
Zip code 40370 compared to state average:
Unemployed percentage above state average.
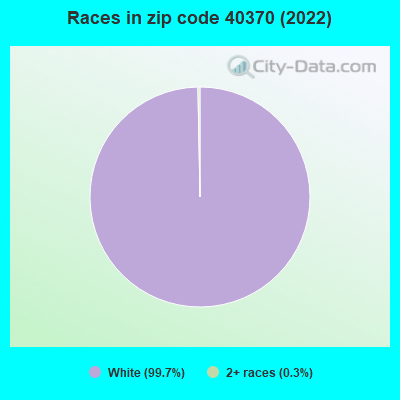
Black race population percentage significantly below state average.
Hispanic race population percentage significantly below state average.
Median age above state average.
Foreign-born population percentage significantly below state average.
Renting percentage below state average.
Length of stay since moving in significantly above state average.
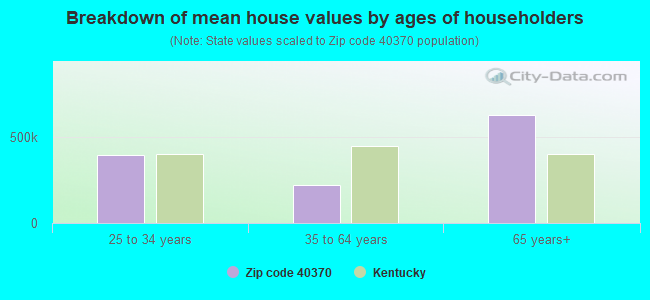
Estimated median house/condo value in 2022: $287,130
40370:
$287,130
Kentucky:
$196,300
According to our research of Kentucky and other state lists, there were 6 registered sex offenders living in 40370 zip code as of May 14, 2024. The ratio of all residents to sex offenders in zip code 40370 is 425 to 1. The ratio of registered sex offenders to all residents in this zip code is near the state average.
Median resident age:
This zip code:
46.9 years
Kentucky median age:
39.4 years
Average household size:
This zip code:
2.5 people
Kentucky:
2.4 people
Averages for the 2020 tax year for zip code 40370, filed in 2021:
Average Adjusted Gross Income (AGI) in 2020: $62,505 (Individual Income Tax Returns)
Here:
$62,505
State:
$61,342
Salary/wage: $56,622 (reported on 86.4% of returns)
Here:
$56,622
State:
$50,827
(% of AGI for various income ranges: 1116.4% for AGIs below $25k, 3698.8% for AGIs $25k-50k, 6468.2% for AGIs $50k-75k, 9200.7% for AGIs $75k-100k, 14378.8% for AGIs $100k-200k)
Taxable interest for individuals: $306 (reported on 25.8% of returns)
This zip code:
$306
Kentucky:
$1,441
(% of AGI for various income ranges: 4.6% for AGIs below $25k, 7.2% for AGIs $25k-50k, 4.1% for AGIs $50k-75k, 33.6% for AGIs $75k-100k, 11.9% for AGIs $100k-200k)
Ordinary dividends: $1,844 (reported on 13.6% of returns)
Here:
$1,844
State:
$7,388
(% of AGI for various income ranges: 36.4% for AGIs $25k-50k, 28.2% for AGIs $50k-75k, 60.0% for AGIs $75k-100k, 68.1% for AGIs $100k-200k)
Net capital gain/loss in AGI: +$4,760 (reported on 11.4% of returns)
Here:
+$4,760
State:
+$19,475
(% of AGI for various income ranges: 9.2% for AGIs $25k-50k, 62.4% for AGIs $50k-75k, 24.3% for AGIs $75k-100k, 344.4% for AGIs $100k-200k)
Profit/loss from business: +$8,842 (reported on 14.4% of returns)
Here:
+$8,842
State:
+$11,386
(% of AGI for various income ranges: 81.1% for AGIs below $25k, 156.0% for AGIs $25k-50k, 335.3% for AGIs $50k-75k, 130.7% for AGIs $75k-100k, 193.8% for AGIs $100k-200k)
Taxable individual retirement arrangement distribution: $20,340 (reported on 7.6% of returns)
40370:
$20,340
Kentucky:
$18,941
(% of AGI for various income ranges: 140.0% for AGIs $25k-50k, 555.9% for AGIs $50k-75k, 461.9% for AGIs $100k-200k)
Total itemized deductions: $24,178 (reported on 6.8% of returns)
Here:
$24,178
State:
$32,473
(% of AGI for various income ranges: 185.2% for AGIs $25k-50k, 340.7% for AGIs $75k-100k, 772.5% for AGIs $100k-200k)
Charity contributions: $7,286 (reported on 5.3% of returns)
Here:
$7,286
State:
$13,472
(% of AGI for various income ranges: 91.2% for AGIs $50k-75k, 221.9% for AGIs $100k-200k)
Taxes paid: $8,000 (reported on 6.8% of returns)
40370:
$8,000
State:
$7,830
(% of AGI for various income ranges: 50.8% for AGIs $25k-50k, 117.9% for AGIs $75k-100k, 267.5% for AGIs $100k-200k)
Earned income credit: $2,132 (reported on 14.4% of returns)
Here:
$2,132
State:
$2,336
(% of AGI for various income ranges: 83.9% for AGIs below $25k, 68.0% for AGIs $25k-50k)
Percentage of individuals using paid preparers for their 2020 taxes: 94.7%
Here:
95%
State:
94%
(% for various income ranges: 94.3% for AGIs below $25k, 93.8% for AGIs $25k-50k, 95.7% for AGIs $50k-75k, 94.4% for AGIs $75k-100k, 95.2% for AGIs $100k-200k, 100.0% for AGIs over 200k)
Averages for the 2012 tax year for zip code 40370, filed in 2013:
Average Adjusted Gross Income (AGI) in 2012: $50,200 (Individual Income Tax Returns)
Here:
$50,200
State:
$50,814
Salary/wage: $47,286 (reported on 85.6% of returns)
Here:
$47,286
State:
$42,723
(% of AGI for various income ranges: 68.1% for AGIs below $25k, 85.7% for AGIs $25k-50k, 82.6% for AGIs $50k-75k, 85.0% for AGIs $75k-100k, 77.9% for AGIs $100k-200k)
Taxable interest for individuals: $715 (reported on 27.2% of returns)
This zip code:
$715
Kentucky:
$1,381
(% of AGI for various income ranges: 1.3% for AGIs below $25k, 0.4% for AGIs $25k-50k, 0.4% for AGIs $50k-75k, 0.3% for AGIs $75k-100k, 0.2% for AGIs $100k-200k)
Ordinary dividends: $1,556 (reported on 14.4% of returns)
Here:
$1,556
State:
$6,239
(% of AGI for various income ranges: 1.3% for AGIs below $25k, 0.4% for AGIs $25k-50k, 0.4% for AGIs $50k-75k, 0.2% for AGIs $75k-100k, 0.4% for AGIs $100k-200k)
Net capital gain/loss in AGI: +$2,727 (reported on 12.0% of returns)
Here:
+$2,727
State:
+$11,336
(% of AGI for various income ranges: 1.2% for AGIs below $25k, 0.4% for AGIs $25k-50k, 0.6% for AGIs $50k-75k, 1.0% for AGIs $100k-200k)
Profit/loss from business: +$10,233 (reported on 16.8% of returns)
Here:
+$10,233
State:
+$10,862
(% of AGI for various income ranges: 14.1% for AGIs below $25k, 3.0% for AGIs $25k-50k, 2.0% for AGIs $50k-75k, 7.0% for AGIs $75k-100k)
Taxable individual retirement arrangement distribution: $12,556 (reported on 7.2% of returns)
40370:
$12,556
Kentucky:
$14,296
(% of AGI for various income ranges: 4.8% for AGIs below $25k, 2.2% for AGIs $50k-75k, 5.1% for AGIs $75k-100k)
Total itemized deductions: $18,465 (21% of AGI, reported on 34.4% of returns)
Here:
$18,465
State:
$21,160
Here:
21.1% of AGI
State:
20.0% of AGI
(% of AGI for various income ranges: 7.7% for AGIs below $25k, 9.5% for AGIs $25k-50k, 10.4% for AGIs $50k-75k, 15.1% for AGIs $75k-100k, 15.5% for AGIs $100k-200k)
Charity contributions: $3,072 (reported on 25.6% of returns)
Here:
$3,072
State:
$4,303
(% of AGI for various income ranges: 1.0% for AGIs $25k-50k, 1.1% for AGIs $50k-75k, 2.1% for AGIs $75k-100k, 2.2% for AGIs $100k-200k)
Taxes paid: $7,547 (reported on 34.4% of returns)
40370:
$7,547
State:
$8,496
(% of AGI for various income ranges: 1.1% for AGIs below $25k, 2.8% for AGIs $25k-50k, 3.9% for AGIs $50k-75k, 6.2% for AGIs $75k-100k, 7.5% for AGIs $100k-200k)
Earned income credit: $2,179 (reported on 19.2% of returns)
Here:
$2,179
State:
$2,273
(% of AGI for various income ranges: 7.3% for AGIs below $25k, 1.2% for AGIs $25k-50k)
Percentage of individuals using paid preparers for their 2012 taxes: 62.4%
Here:
62%
State:
60%
(% for various income ranges: 60.9% for AGIs below $25k, 65.5% for AGIs $25k-50k, 63.6% for AGIs $50k-75k, 53.8% for AGIs $75k-100k, 66.7% for AGIs $100k-200k)
Averages for the 2004 tax year for zip code 40370, filed in 2005:
Average Adjusted Gross Income (AGI) in 2004: $42,041 (Individual Income Tax Returns)
Here:
$42,041
State:
$41,540
Salary/wage: $41,552 (reported on 86.9% of returns)
Here:
$41,552
State:
$36,432
(% of AGI for various income ranges: 86.1% for AGIs below $10k, 79.0% for AGIs $10k-25k, 86.5% for AGIs $25k-50k, 86.5% for AGIs $50k-75k, 92.5% for AGIs $75k-100k, 82.3% for AGIs over 100k)
Taxable interest for individuals: $832 (reported on 41.2% of returns)
This zip code:
$832
Kentucky:
$1,571
(% of AGI for various income ranges: 5.7% for AGIs below $10k, 1.8% for AGIs $10k-25k, 1.3% for AGIs $25k-50k, 0.7% for AGIs $50k-75k, 0.2% for AGIs $75k-100k, 0.2% for AGIs over 100k)
Taxable dividends: $699 (reported on 14.0% of returns)
Here:
$699
State:
$3,453
(% of AGI for various income ranges: 0.6% for AGIs below $10k, 0.3% for AGIs $10k-25k, 0.3% for AGIs $25k-50k, 0.2% for AGIs $50k-75k, 0.1% for AGIs $75k-100k, 0.2% for AGIs over 100k)
Net capital gain/loss: +$4,554 (reported on 12.5% of returns)
Here:
+$4,554
State:
+$9,663
(% of AGI for various income ranges: 2.6% for AGIs below $10k, 0.3% for AGIs $10k-25k, 1.2% for AGIs $25k-50k, 1.8% for AGIs $50k-75k, 0.5% for AGIs $75k-100k, 2.1% for AGIs over 100k)
Profit/loss from business: +$7,841 (reported on 18.0% of returns)
Here:
+$7,841
State:
+$9,233
(% of AGI for various income ranges: 7.9% for AGIs below $10k, 6.0% for AGIs $10k-25k, 3.8% for AGIs $25k-50k, 4.8% for AGIs $50k-75k, 0.1% for AGIs $75k-100k, 2.6% for AGIs over 100k)
Total itemized deductions: $16,210 (23% of AGI, reported on 37.7% of returns)
Here:
$16,210
State:
$17,474
Here:
22.8% of AGI
State:
21.0% of AGI
(% of AGI for various income ranges: 11.9% for AGIs $10k-25k, 11.0% for AGIs $25k-50k, 15.4% for AGIs $50k-75k, 17.7% for AGIs $75k-100k, 16.5% for AGIs over 100k)
Charity contributions deductions: $2,182 (3% of AGI, reported on 30.5% of returns)
Here:
$2,182
State:
$3,494
Here:
2.9% of AGI
State:
4.0% of AGI
(% of AGI for various income ranges: 0.7% for AGIs $10k-25k, 1.0% for AGIs $25k-50k, 1.9% for AGIs $50k-75k, 1.5% for AGIs $75k-100k, 2.4% for AGIs over 100k)
Total tax: $5,050 (reported on 77.4% of returns)
40370:
$5,050
State:
$6,162
(% of AGI for various income ranges: 3.6% for AGIs below $10k, 4.7% for AGIs $10k-25k, 6.3% for AGIs $25k-50k, 8.4% for AGIs $50k-75k, 9.2% for AGIs $75k-100k, 15.3% for AGIs over 100k)
Earned income credit: $1,558 (reported on 16.6% of returns)
Here:
$1,558
State:
$1,723
Percentage of individuals using paid preparers for their 2004 taxes: 67.1%
Here:
67%
State:
66%
(% for various income ranges: 62.3% for AGIs below $10k, 70.9% for AGIs $10k-25k, 70.2% for AGIs $25k-50k, 65.7% for AGIs $50k-75k, 67.9% for AGIs $75k-100k, 59.3% for AGIs over 100k)
Household received Food Stamps/SNAP in the past 12 months: 67 Household did not receive Food Stamps/SNAP in the past 12 months: 1,027
Women who had a birth in the past 12 months: 10 (5 now married, 5 unmarried) Women who did not have a birth in the past 12 months: 538 (301 now married, 238 unmarried)
Housing units in zip code 40370 with a mortgage: 693 (73 second mortgage, 64 both second mortgage and home equity loan) Median monthly owner costs for units with a mortgage: $1,469 Median monthly owner costs for units without a mortgage: $426
Residents with income below the poverty level in 2022:
This zip code:
10.0%
Whole state:
16.5%
Residents with income below 50% of the poverty level in 2022:
This zip code:
3.4%
Whole state:
9.0%
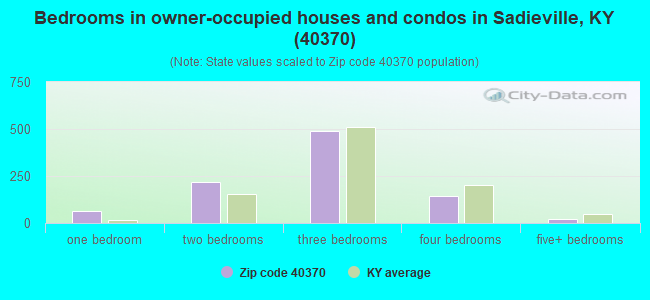
Median number of rooms in houses and condos:
Here:
6.0
State:
6.4
Median number of rooms in apartments:
Here:
7.4
State:
4.4
Notable locations in this zip code not listed on our city pages
Cemeteries: K of P Cemetery (1), Hensley Cemetery (2), Barnett Cemetery (3), Nelson Cemetery (4), Hinton Cemetery (5), Gillespie Cemetery (6). Display/hide their locations on the map
Streams, rivers, and creeks: Mile Run (A), West Fork Eagle Creek (B), Straight Fork (C), Spoon Branch (D), Little Eagle Creek (E), Rays Fork (F), Rogers Gap Creek (G), Hall Branch (H), Shawnee Branch (I). Display/hide their locations on the map
Size of family households: 527 2-persons, 146 3-persons, 131 4-persons, 84 5-persons, 28 6-persons, 2 7-or-more-persons
Size of nonfamily households: 141 1-person, 28 2-persons
403 married couples with children.
167 single-parent households (137 men, 30 women).
99.3% of residents of 40370 zip code speak English at home.
0.1% of residents speak Spanish at home (50% well, 50% not at all).
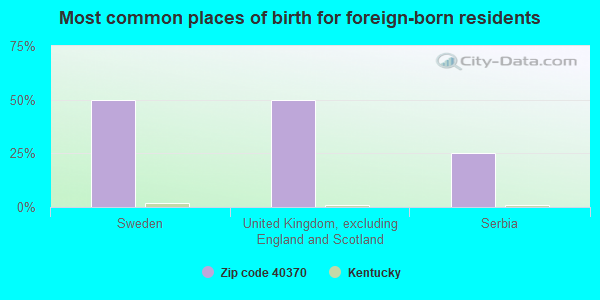
Foreign born population: 4 (0.1%) (100.0% of them are naturalized citizens)
This zip code:
0.1%
Whole state:
4.0%
50%Sweden
50%United Kingdom, excluding England and Scotland
25%Serbia
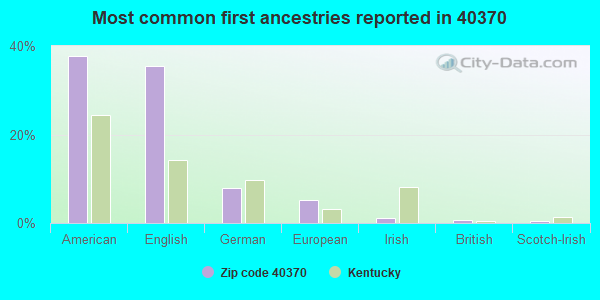
38%American
35%English
8%German
5%European
1%Irish
1%British
0%Scotch-Irish
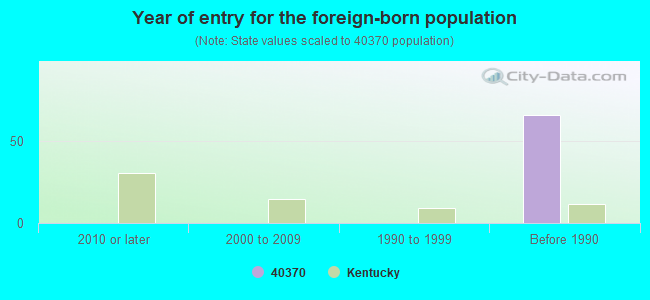
Year of entry for the foreign-born population
02010 or later
02000 to 2009
01990 to 1999
66Before 1990
Facilities with environmental interests located in this zip code:
MIKES I 75 CHEVRON (PORTER PIKE in SADIEVILLE, KY)
National Pollutant Discharge Elimination System NON-MAJOR (Tracking pollutant discharge elimination systems) - permit Business SIC classification: GASOLINE SERVICE STATIONS
NORFOLK SOUTHERN RAILWAY CO (MP 58.8 1 MI N OF CYNTHIANA PK in SADIEVILLE, KY)
(Resource Conservation and Recovery Act (tracking hazardous waste)) Business NAICS classification: LINE-HAUL RAILROADS.
Housing units lacking complete plumbing facilities: 2.6% Housing units lacking complete kitchen facilities: 1.0%
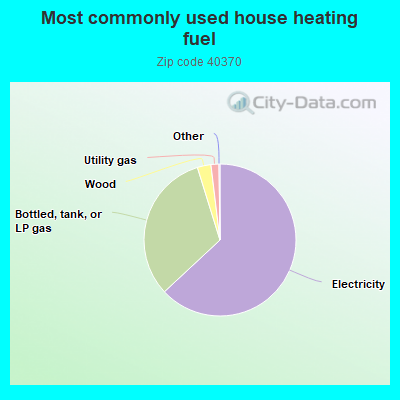
63.2%Electricity
32.2%Bottled, tank, or LP gas
2.9%Wood
1.7%Utility gas
Population in 1990: 2,694. Population change in the 1990s: +202 (+7.5%).
Place of birth for U.S.-born residents:
This state: 2,054
Northeast: 109
Midwest: 295
South: 207
West: 27
62% of the 40370 zip code residents lived in the same house 5 years ago. Out of people who lived in different houses, 40% lived in this county. Out of people who lived in different counties, 50% lived in Kentucky.
92% of the 40370 zip code residents lived in the same house 1 year ago. Out of people who lived in different houses, 9% moved from this county. Out of people who lived in different houses, 91% moved from different county within same state. Out of people who lived in different houses, 2% moved from different state.
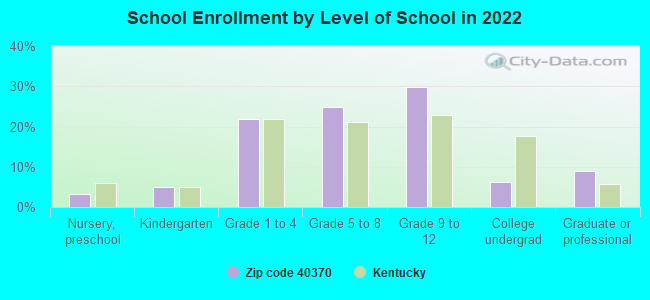
Private vs. public school enrollment:
Students in private schools in grades 1 to 8 (elementary and middle school): 33
Here:
12.4%
Kentucky:
17.2%
Students in private schools in grades 9 to 12 (high school): 18
Here:
10.7%
Kentucky:
15.2%
Students in private undergraduate colleges:
Here:
0.0%
Kentucky:
19.6%
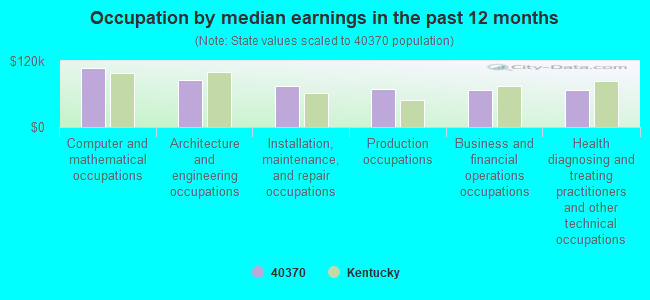
Occupation by median earnings in the past 12 months ($)
107,490Computer and mathematical occupations
85,887Architecture and engineering occupations
73,937Installation, maintenance, and repair occupations
68,391Production occupations
66,810Business and financial operations occupations
66,695Health diagnosing and treating practitioners and other technical occupations
Top industries in this zip code by the number of employees in 2005:
Accommodation and Food Services: Limited-Service Restaurants (50-99 employees: 1 establishment)
Construction: Drywall and Insulation Contractors (1-4: 1)
Construction: Land Subdivision (1-4: 1)
Management of Companies and Enterprises: Corporate, Subsidiary, and Regional Managing Offices (1-4: 1)
Construction: New Single-Family Housing Construction (except Operative Builders) (1-4: 1)
Construction: Residential Remodelers (1-4: 1)
Construction: Poured Concrete Foundation and Structure Contractors (1-4: 1)
Administrative and Support and Waste Management and Remediation Services: Landscaping Services (1-4: 1)
Fatal accident statistics in 2014:
Fatal accident count: 1
Vehicles involved in fatal accidents: 1
Fatal accidents caused by drunken drivers: 0
Fatalities: 1
Persons involved in fatal accidents: 1
Pedestrians involved in fatal accidents: 3
Fatal accident statistics in 2013:
Fatal accident count: 1
Vehicles involved in fatal accidents: 1
Fatal accidents caused by drunken drivers: 0
Fatalities: 1
Persons involved in fatal accidents: 1
Pedestrians involved in fatal accidents: 0
Home Mortgage Disclosure Act Aggregated Statistics For Year 2009 (Based on 4 partial tracts)
A) FHA, FSA/RHS & VA Home Purchase Loans
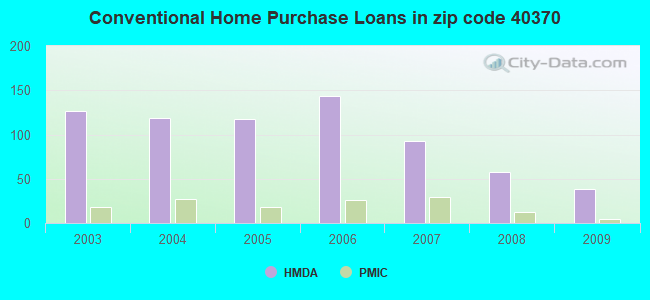
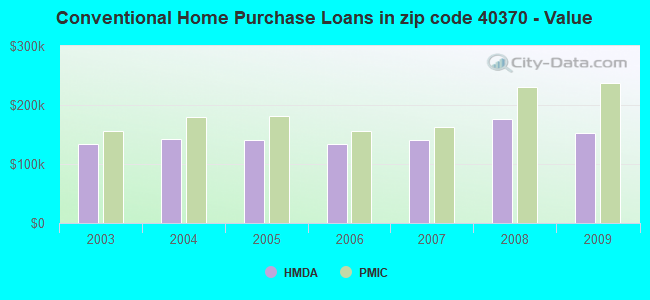
B) Conventional Home Purchase Loans
C) Refinancings
D) Home Improvement Loans
F) Non-occupant Loans on < 5 Family Dwellings (A B C & D)
G) Loans On Manufactured Home Dwelling (A B C & D)
Number
Average Value
Number
Average Value
Number
Average Value
Number
Average Value
Number
Average Value
Number
Average Value
LOANS ORIGINATED
14
$171,125
38
$153,188
266
$155,495
17
$33,324
29
$111,870
24
$75,992
APPLICATIONS APPROVED, NOT ACCEPTED
1
$146,920
6
$157,960
7
$162,554
1
$9,060
0
$0
1
$142,760
APPLICATIONS DENIED
2
$181,535
8
$172,324
85
$154,033
3
$103,693
3
$282,907
10
$89,277
APPLICATIONS WITHDRAWN
6
$120,618
7
$165,723
45
$172,573
1
$74,290
2
$129,730
3
$116,560
FILES CLOSED FOR INCOMPLETENESS
0
$0
0
$0
9
$155,153
1
$31,600
1
$31,600
1
$82,050
Aggregated Statistics For Year 2008 (Based on 4 partial tracts)
A) FHA, FSA/RHS & VA Home Purchase Loans
B) Conventional Home Purchase Loans
C) Refinancings
D) Home Improvement Loans
F) Non-occupant Loans on < 5 Family Dwellings (A B C & D)
G) Loans On Manufactured Home Dwelling (A B C & D)
Number
Average Value
Number
Average Value
Number
Average Value
Number
Average Value
Number
Average Value
Number
Average Value
LOANS ORIGINATED
19
$137,308
58
$175,609
150
$150,880
22
$35,666
23
$118,587
25
$86,161
APPLICATIONS APPROVED, NOT ACCEPTED
2
$213,505
6
$96,460
13
$155,141
6
$24,210
1
$56,650
3
$69,143
APPLICATIONS DENIED
3
$151,853
16
$127,386
98
$150,599
24
$41,261
1
$66,530
22
$64,658
APPLICATIONS WITHDRAWN
3
$127,097
7
$193,450
30
$197,448
3
$62,890
0
$0
2
$136,935
FILES CLOSED FOR INCOMPLETENESS
0
$0
3
$176,783
5
$179,186
1
$56,650
1
$55,440
0
$0
Aggregated Statistics For Year 2007 (Based on 4 partial tracts)
A) FHA, FSA/RHS & VA Home Purchase Loans
B) Conventional Home Purchase Loans
C) Refinancings
D) Home Improvement Loans
F) Non-occupant Loans on < 5 Family Dwellings (A B C & D)
G) Loans On Manufactured Home Dwelling (A B C & D)
Number
Average Value
Number
Average Value
Number
Average Value
Number
Average Value
Number
Average Value
Number
Average Value
LOANS ORIGINATED
14
$132,153
93
$140,641
156
$146,054
52
$37,546
21
$101,245
30
$91,358
APPLICATIONS APPROVED, NOT ACCEPTED
1
$150,240
11
$139,049
22
$147,665
8
$33,380
2
$78,510
4
$106,580
APPLICATIONS DENIED
2
$133,890
28
$135,041
89
$155,175
21
$59,711
6
$192,060
17
$70,691
APPLICATIONS WITHDRAWN
2
$87,810
13
$130,863
30
$142,688
8
$35,260
5
$133,694
2
$58,765
FILES CLOSED FOR INCOMPLETENESS
0
$0
1
$138,600
10
$154,201
0
$0
1
$55,440
0
$0
Aggregated Statistics For Year 2006 (Based on 4 partial tracts)
A) FHA, FSA/RHS & VA Home Purchase Loans
B) Conventional Home Purchase Loans
C) Refinancings
D) Home Improvement Loans
F) Non-occupant Loans on < 5 Family Dwellings (A B C & D)
G) Loans On Manufactured Home Dwelling (A B C & D)
Number
Average Value
Number
Average Value
Number
Average Value
Number
Average Value
Number
Average Value
Number
Average Value
LOANS ORIGINATED
19
$137,536
143
$133,648
157
$135,539
55
$49,211
31
$115,519
37
$75,489
APPLICATIONS APPROVED, NOT ACCEPTED
2
$153,635
11
$106,029
20
$112,502
4
$30,950
4
$94,250
6
$93,235
APPLICATIONS DENIED
1
$112,170
26
$77,265
90
$130,155
16
$56,322
6
$57,210
19
$80,324
APPLICATIONS WITHDRAWN
3
$116,483
16
$160,111
45
$124,955
7
$47,751
1
$135,270
6
$58,755
FILES CLOSED FOR INCOMPLETENESS
0
$0
3
$98,983
18
$146,958
1
$184,680
0
$0
1
$89,510
Aggregated Statistics For Year 2005 (Based on 4 partial tracts)
A) FHA, FSA/RHS & VA Home Purchase Loans
B) Conventional Home Purchase Loans
C) Refinancings
D) Home Improvement Loans
F) Non-occupant Loans on < 5 Family Dwellings (A B C & D)
G) Loans On Manufactured Home Dwelling (A B C & D)
Number
Average Value
Number
Average Value
Number
Average Value
Number
Average Value
Number
Average Value
Number
Average Value
LOANS ORIGINATED
13
$137,992
118
$140,628
164
$133,970
33
$49,939
15
$63,671
29
$81,566
APPLICATIONS APPROVED, NOT ACCEPTED
0
$0
22
$91,472
27
$125,009
6
$28,448
1
$67,080
7
$71,751
APPLICATIONS DENIED
2
$88,375
31
$105,467
116
$120,080
13
$28,211
2
$236,080
28
$74,649
APPLICATIONS WITHDRAWN
2
$51,190
17
$153,629
69
$125,266
9
$143,649
1
$104,780
7
$79,131
FILES CLOSED FOR INCOMPLETENESS
0
$0
2
$110,050
17
$143,009
2
$56,145
0
$0
3
$100,297
Aggregated Statistics For Year 2004 (Based on 4 partial tracts)
A) FHA, FSA/RHS & VA Home Purchase Loans
B) Conventional Home Purchase Loans
C) Refinancings
D) Home Improvement Loans
F) Non-occupant Loans on < 5 Family Dwellings (A B C & D)
G) Loans On Manufactured Home Dwelling (A B C & D)
Number
Average Value
Number
Average Value
Number
Average Value
Number
Average Value
Number
Average Value
Number
Average Value
LOANS ORIGINATED
15
$105,096
119
$142,407
158
$126,089
33
$43,397
21
$104,206
36
$75,456
APPLICATIONS APPROVED, NOT ACCEPTED
3
$160,337
16
$139,497
35
$123,535
5
$58,118
0
$0
10
$83,605
APPLICATIONS DENIED
5
$105,688
27
$112,344
120
$118,520
13
$42,751
2
$95,080
25
$90,624
APPLICATIONS WITHDRAWN
3
$137,680
17
$133,429
82
$125,898
3
$16,953
2
$68,665
7
$89,429
FILES CLOSED FOR INCOMPLETENESS
1
$67,980
7
$152,039
11
$118,822
1
$2,220
0
$0
5
$57,662
Aggregated Statistics For Year 2003 (Based on 4 partial tracts)
A) FHA, FSA/RHS & VA Home Purchase Loans
B) Conventional Home Purchase Loans
C) Refinancings
D) Home Improvement Loans
F) Non-occupant Loans on < 5 Family Dwellings (A B C & D)


 Nearest zip codes: 41010, 40324, 41003, 40379, 41097, 41031.