Estimated zip code population in 2022: 7,917 Zip code population in 2010: 8,251 Zip code population in 2000: 8,273
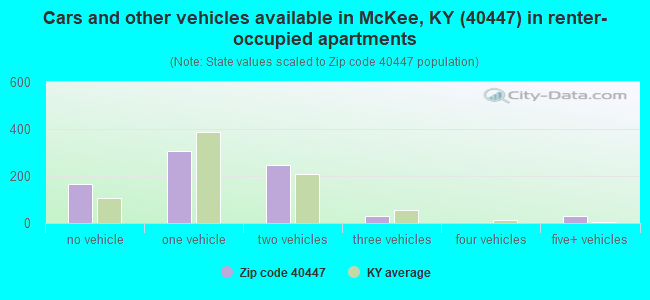
Houses and condos: 4,037 Renter-occupied apartments: 783
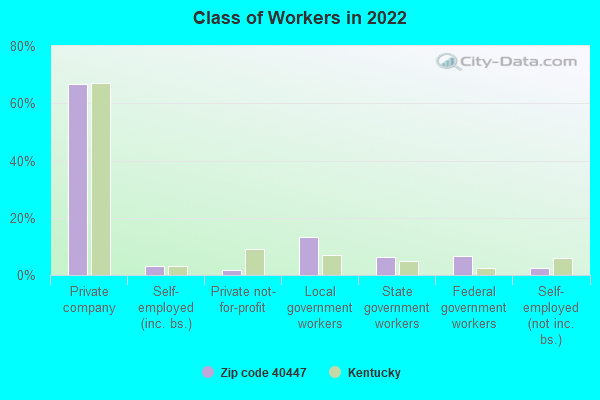
% of renters here:
23%
State:
31%
March 2022 cost of living index in zip code 40447: 81.5 (low, U.S. average is 100)
Land area: 249.7 sq. mi. Water area: 1.0 sq. mi.
Population density: 32 people per square mile
(very low).
OSM Map
General Map
Google Map
MSN Map
OSM Map
General Map
Google Map
MSN Map
OSM Map
General Map
Google Map
MSN Map
OSM Map
General Map
Google Map
MSN Map
Please wait while loading the map...
Real estate property taxes paid for housing units in 2022:
This zip code:
0.5% ($573)
Kentucky:
0.7% ($1,456)
Median real estate property taxes paid for housing units with mortgages in 2022: $686 (0.4%) Median real estate property taxes paid for housing units with no mortgage in 2022: $523 (0.6%)
Business Search- 14 Million verified businesses
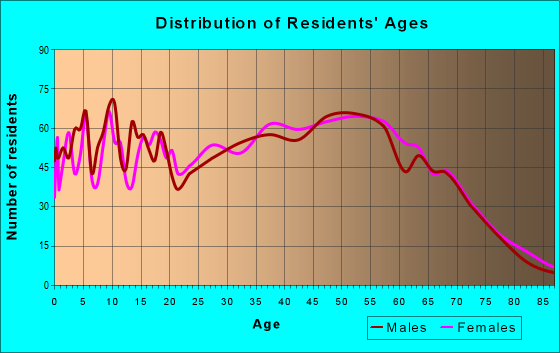
Males: 3,882
(49.0%)
Females: 4,035
(51.0%)
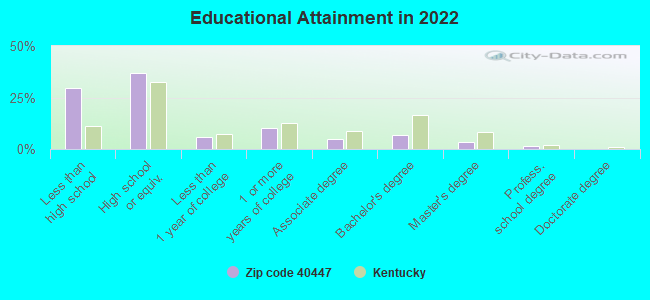
For population 25 years and over in 40447:
High school or higher: 67.7%
Bachelor's degree or higher: 11.5%
Graduate or professional degree: 4.9%
Unemployed: 9.0%
Mean travel time to work (commute): 39.3 minutes
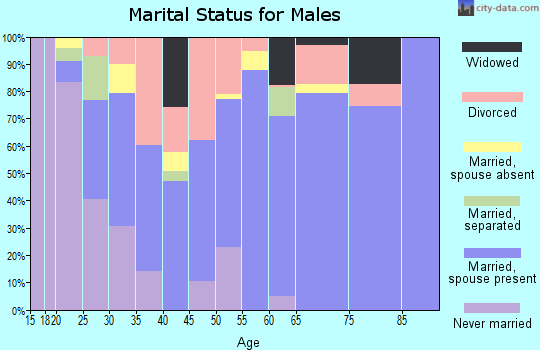
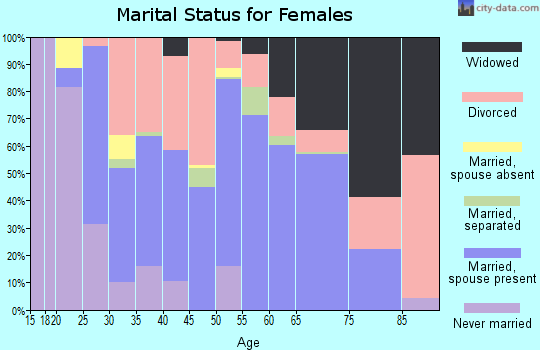
For population 15 years and over in 40447:
Never married: 19.8%
Now married: 50.6%
Separated: 2.2%
Widowed: 9.8%
Divorced: 17.7%
Zip code 40447 compared to state average:
Median household income below state average.
Median house value below state average.
Unemployed percentage above state average.
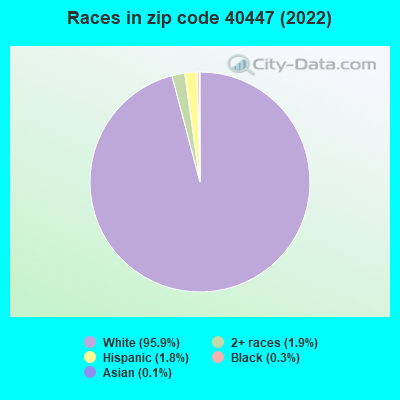
Black race population percentage significantly below state average.
Hispanic race population percentage below state average.
Foreign-born population percentage significantly below state average.
Length of stay since moving in above state average.
House age below state average.
Number of college students below state average.
Percentage of population with a bachelor's degree or higher significantly below state average.
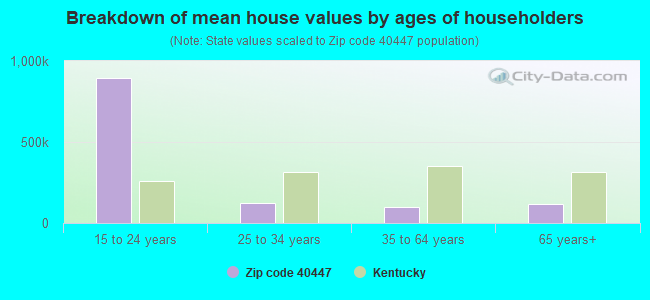
Estimated median house/condo value in 2022: $109,573
40447:
$109,573
Kentucky:
$196,300
According to our research of Kentucky and other state lists, there were 18 registered sex offenders living in 40447 zip code as of April 27, 2024. The ratio of all residents to sex offenders in zip code 40447 is 442 to 1. The ratio of registered sex offenders to all residents in this zip code is near the state average.
Median resident age:
This zip code:
42.5 years
Kentucky median age:
39.4 years
Average household size:
This zip code:
2.3 people
Kentucky:
2.4 people
Averages for the 2020 tax year for zip code 40447, filed in 2021:
Average Adjusted Gross Income (AGI) in 2020: $42,153 (Individual Income Tax Returns)
Here:
$42,153
State:
$61,342
Salary/wage: $37,930 (reported on 82.4% of returns)
Here:
$37,930
State:
$50,827
(% of AGI for various income ranges: 1060.6% for AGIs below $25k, 3507.2% for AGIs $25k-50k, 6707.2% for AGIs $50k-75k, 9383.3% for AGIs $75k-100k, 16645.0% for AGIs $100k-200k)
Taxable interest for individuals: $434 (reported on 15.2% of returns)
This zip code:
$434
Kentucky:
$1,441
(% of AGI for various income ranges: 5.6% for AGIs below $25k, 5.7% for AGIs $25k-50k, 10.0% for AGIs $50k-75k, 11.3% for AGIs $75k-100k, 40.0% for AGIs $100k-200k)
Ordinary dividends: $1,478 (reported on 3.6% of returns)
Here:
$1,478
State:
$7,388
(% of AGI for various income ranges: 0.1% for AGIs below $25k, 3.3% for AGIs $25k-50k, 31.6% for AGIs $50k-75k, 29.2% for AGIs $100k-200k)
Net capital gain/loss in AGI: +$5,000 (reported on 4.0% of returns)
Here:
+$5,000
State:
+$19,475
(% of AGI for various income ranges: 5.2% for AGIs below $25k, 25.7% for AGIs $25k-50k, 213.3% for AGIs $75k-100k)
Profit/loss from business: +$7,079 (reported on 19.2% of returns)
Here:
+$7,079
State:
+$11,386
(% of AGI for various income ranges: 182.4% for AGIs below $25k, 112.0% for AGIs $25k-50k, 277.6% for AGIs $50k-75k, 86.0% for AGIs $75k-100k, 440.8% for AGIs $100k-200k)
Taxable individual retirement arrangement distribution: $14,870 (reported on 4.0% of returns)
40447:
$14,870
Kentucky:
$18,941
(% of AGI for various income ranges: 20.8% for AGIs below $25k, 75.4% for AGIs $25k-50k, 366.4% for AGIs $50k-75k)
Total itemized deductions: $29,050 (reported on 0.8% of returns)
Here:
$29,050
State:
$32,473
(% of AGI for various income ranges: 107.6% for AGIs $25k-50k)
Taxes paid: $6,450 (reported on 0.8% of returns)
40447:
$6,450
State:
$7,830
(% of AGI for various income ranges: 23.9% for AGIs $25k-50k)
Earned income credit: $2,585 (reported on 29.6% of returns)
Here:
$2,585
State:
$2,336
(% of AGI for various income ranges: 162.5% for AGIs below $25k, 116.5% for AGIs $25k-50k)
Percentage of individuals using paid preparers for their 2020 taxes: 96.8%
Here:
97%
State:
94%
(% for various income ranges: 96.3% for AGIs below $25k, 97.1% for AGIs $25k-50k, 97.1% for AGIs $50k-75k, 95.2% for AGIs $75k-100k, 100.0% for AGIs $100k-200k, 100.0% for AGIs over 200k)
Averages for the 2012 tax year for zip code 40447, filed in 2013:
Average Adjusted Gross Income (AGI) in 2012: $33,379 (Individual Income Tax Returns)
Here:
$33,379
State:
$50,814
Salary/wage: $31,398 (reported on 84.9% of returns)
Here:
$31,398
State:
$42,723
(% of AGI for various income ranges: 70.8% for AGIs below $25k, 85.7% for AGIs $25k-50k, 86.7% for AGIs $50k-75k, 85.6% for AGIs $75k-100k, 62.2% for AGIs $100k-200k)
Taxable interest for individuals: $667 (reported on 18.1% of returns)
This zip code:
$667
Kentucky:
$1,381
(% of AGI for various income ranges: 0.6% for AGIs below $25k, 0.2% for AGIs $25k-50k, 0.1% for AGIs $50k-75k, 0.1% for AGIs $75k-100k, 1.1% for AGIs $100k-200k)
Ordinary dividends: $500 (reported on 5.5% of returns)
Here:
$500
State:
$6,239
(% of AGI for various income ranges: 0.2% for AGIs below $25k, 0.2% for AGIs $75k-100k)
Net capital gain/loss in AGI: +$875 (reported on 8.4% of returns)
Here:
+$875
State:
+$11,336
(% of AGI for various income ranges: 0.6% for AGIs below $25k, 0.3% for AGIs $25k-50k)
Profit/loss from business: +$6,985 (reported on 20.2% of returns)
Here:
+$6,985
State:
+$10,862
(% of AGI for various income ranges: 12.5% for AGIs below $25k, 2.0% for AGIs $25k-50k, 2.7% for AGIs $50k-75k, 4.0% for AGIs $75k-100k)
Taxable individual retirement arrangement distribution: $10,510 (reported on 4.2% of returns)
40447:
$10,510
Kentucky:
$14,296
(% of AGI for various income ranges: 1.2% for AGIs below $25k, 1.4% for AGIs $25k-50k, 2.7% for AGIs $50k-75k)
Total itemized deductions: $16,119 (23% of AGI, reported on 13.4% of returns)
Here:
$16,119
State:
$21,160
Here:
22.6% of AGI
State:
20.0% of AGI
(% of AGI for various income ranges: 3.7% for AGIs below $25k, 4.5% for AGIs $25k-50k, 6.4% for AGIs $50k-75k, 11.1% for AGIs $75k-100k, 10.8% for AGIs $100k-200k)
Charity contributions: $3,584 (reported on 8.0% of returns)
Here:
$3,584
State:
$4,303
(% of AGI for various income ranges: 0.6% for AGIs $25k-50k, 0.8% for AGIs $50k-75k, 1.7% for AGIs $75k-100k, 2.1% for AGIs $100k-200k)
Taxes paid: $5,166 (reported on 13.4% of returns)
40447:
$5,166
State:
$8,496
(% of AGI for various income ranges: 0.4% for AGIs below $25k, 1.0% for AGIs $25k-50k, 2.0% for AGIs $50k-75k, 4.1% for AGIs $75k-100k, 5.1% for AGIs $100k-200k)
Earned income credit: $2,310 (reported on 34.0% of returns)
Here:
$2,310
State:
$2,273
(% of AGI for various income ranges: 9.8% for AGIs below $25k, 1.5% for AGIs $25k-50k)
Percentage of individuals using paid preparers for their 2012 taxes: 79.0%
Here:
79%
State:
60%
(% for various income ranges: 73.4% for AGIs below $25k, 82.3% for AGIs $25k-50k, 85.3% for AGIs $50k-75k, 90.9% for AGIs $75k-100k, 100.0% for AGIs $100k-200k)
Averages for the 2004 tax year for zip code 40447, filed in 2005:
Average Adjusted Gross Income (AGI) in 2004: $25,914 (Individual Income Tax Returns)
Here:
$25,914
State:
$41,540
Salary/wage: $25,772 (reported on 85.6% of returns)
Here:
$25,772
State:
$36,432
(% of AGI for various income ranges: 134.2% for AGIs below $10k, 81.1% for AGIs $10k-25k, 89.0% for AGIs $25k-50k, 87.4% for AGIs $50k-75k, 84.8% for AGIs $75k-100k, 49.4% for AGIs over 100k)
Taxable interest for individuals: $992 (reported on 24.7% of returns)
This zip code:
$992
Kentucky:
$1,571
(% of AGI for various income ranges: 8.8% for AGIs below $10k, 0.9% for AGIs $10k-25k, 0.6% for AGIs $25k-50k, 0.5% for AGIs $50k-75k, 0.5% for AGIs $75k-100k, 1.6% for AGIs over 100k)
Taxable dividends: $402 (reported on 4.5% of returns)
Here:
$402
State:
$3,453
(% of AGI for various income ranges: 0.1% for AGIs below $10k, 0.0% for AGIs $10k-25k, 0.0% for AGIs $25k-50k, 0.1% for AGIs $50k-75k, 0.3% for AGIs $75k-100k)
Net capital gain/loss: +$7,043 (reported on 4.8% of returns)
Here:
+$7,043
State:
+$9,663
(% of AGI for various income ranges: 1.7% for AGIs below $10k, 0.8% for AGIs $10k-25k, 0.6% for AGIs $25k-50k, 0.9% for AGIs $50k-75k, 7.3% for AGIs $75k-100k)
Profit/loss from business: +$4,942 (reported on 18.8% of returns)
Here:
+$4,942
State:
+$9,233
(% of AGI for various income ranges: 7.6% for AGIs below $10k, 5.8% for AGIs $10k-25k, 3.0% for AGIs $25k-50k, 2.7% for AGIs $50k-75k, 4.0% for AGIs $75k-100k)
IRA payment deduction: $2,143 (reported on 0.6% of returns)
40447:
$2,143
Kentucky:
$2,955
Total itemized deductions: $13,695 (24% of AGI, reported on 12.6% of returns)
Here:
$13,695
State:
$17,474
Here:
23.5% of AGI
State:
21.0% of AGI
(% of AGI for various income ranges: 3.6% for AGIs $10k-25k, 5.6% for AGIs $25k-50k, 8.2% for AGIs $50k-75k, 12.2% for AGIs $75k-100k, 12.3% for AGIs over 100k)
Charity contributions deductions: $2,876 (4% of AGI, reported on 8.1% of returns)
Here:
$2,876
State:
$3,494
Here:
4.4% of AGI
State:
4.0% of AGI
(% of AGI for various income ranges: 0.2% for AGIs $10k-25k, 0.5% for AGIs $25k-50k, 1.0% for AGIs $50k-75k, 2.3% for AGIs $75k-100k, 3.4% for AGIs over 100k)
Total tax: $2,720 (reported on 65.2% of returns)
40447:
$2,720
State:
$6,162
(% of AGI for various income ranges: 5.9% for AGIs below $10k, 3.5% for AGIs $10k-25k, 5.4% for AGIs $25k-50k, 8.2% for AGIs $50k-75k, 10.3% for AGIs $75k-100k, 17.1% for AGIs over 100k)
Earned income credit: $1,807 (reported on 29.5% of returns)
Here:
$1,807
State:
$1,723
Percentage of individuals using paid preparers for their 2004 taxes: 81.3%
Here:
81%
State:
66%
(% for various income ranges: 74.2% for AGIs below $10k, 82.2% for AGIs $10k-25k, 85.4% for AGIs $25k-50k, 86.1% for AGIs $50k-75k, 80.3% for AGIs $75k-100k, 84.0% for AGIs over 100k)
Household received Food Stamps/SNAP in the past 12 months: 1,024 Household did not receive Food Stamps/SNAP in the past 12 months: 2,386
Women who had a birth in the past 12 months: 55 (32 now married, 22 unmarried) Women who did not have a birth in the past 12 months: 1,678 (938 now married, 744 unmarried)
Housing units in zip code 40447 with a mortgage: 1,200 (39 second mortgage, 25 both second mortgage and home equity loan) Median monthly owner costs for units with a mortgage: $934 Median monthly owner costs for units without a mortgage: $299
Residents with income below the poverty level in 2022:
This zip code:
29.6%
Whole state:
16.5%
Residents with income below 50% of the poverty level in 2022:
This zip code:
22.6%
Whole state:
9.0%
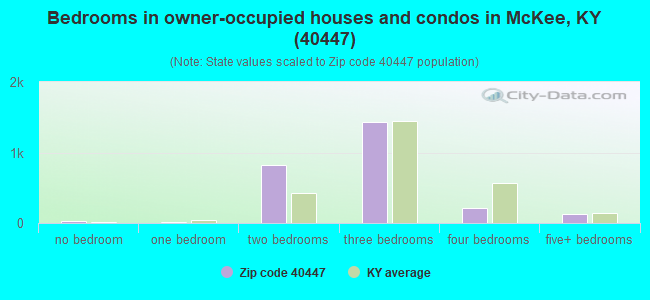
Median number of rooms in houses and condos:
Here:
6.0
State:
6.4
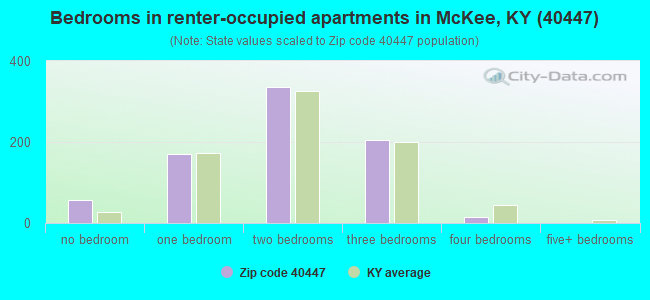
Median number of rooms in apartments:
Here:
4.2
State:
4.4
Notable locations in this zip code not listed on our city pages
Notable locations in zip code 40447: McKee Work Center (A), S Tree Campground (B), Turkey Foot Campground (C), Old Pigeon Roost (D), Rose's Mill (E), Powells Mill (F), Gravel Lick (G), Sand Gap Fire Department Station 2 (H), McKee Fire Department Station 2 (I), Sand Gap Fire Department (J), McKee Fire Department Station 1 (K), Gray Hawk Fire Department (L), Jackson County Ambulance Service (M). Display/hide their locations on the map
Churches in zip code 40447 include: Clover Bottom Church (A), Cave Spring Church (B), Calvary Church (C), Deer Stable Baptist Church (D), Bethel Baptist Church (E), Pine Flat Church (F), Macedonia Church (G), Saw Mill Church (H), Hugh Church (I). Display/hide their locations on the map
Cemeteries: Plowman Cemetery (1), Lear Cemetery (2), Isaacs Cemetery (3), Harrison Cemetery (4), Combs Cemetery (5), Wilson Cemetery (6), Dunn Cemetery (7). Display/hide their locations on the map
Streams, rivers, and creeks: Buzzard Branch (A), Cane Branch (B), Cavanaugh Creek (C), Clover Bottom Creek (D), Devils Den Branch (E), Dry Branch (F), Elisha Branch (G), Elsam Fork (H), Fall Branch (I). Display/hide their locations on the map
In group quarters: 45 (-1 institutionalized population)
Size of family households: 1,071 2-persons, 652 3-persons, 136 4-persons, 149 5-persons, 108 6-persons, 25 7-or-more-persons
Size of nonfamily households: 1,137 1-person, 131 2-persons
1,410 married couples with children.
375 single-parent households (37 men, 338 women).
99.1% of residents of 40447 zip code speak English at home.
0.9% of residents speak Spanish at home (72% very well, 15% well, 13% not well).
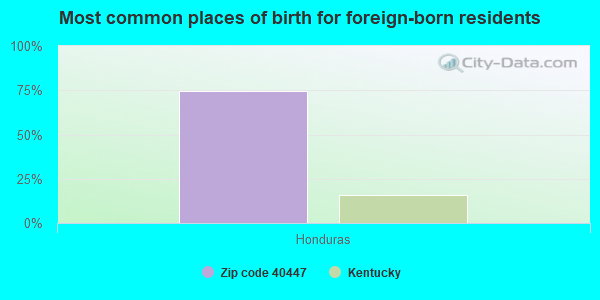
Foreign born population: 41 (0.5%) (24.8% of them are naturalized citizens)
This zip code:
0.5%
Whole state:
4.0%
74%Honduras
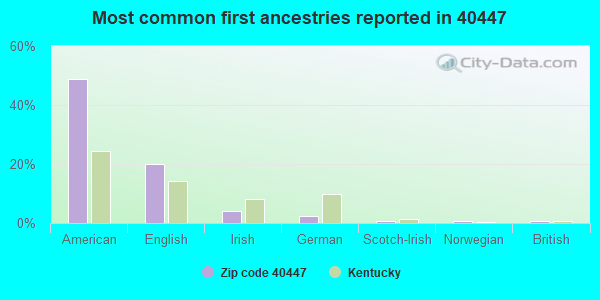
49%American
20%English
4%Irish
2%German
1%Scotch-Irish
1%Norwegian
1%British
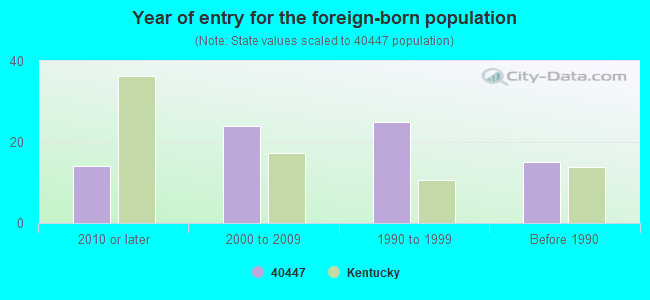
Year of entry for the foreign-born population
142010 or later
242000 to 2009
251990 to 1999
15Before 1990
Facilities with environmental interests located in this zip code:
MCKEE ELEMENTARY SCHOOL (US HWY 89 in MCKEE, KY)
(National Center for Education Statistics) - STATE ID-055271180 Organizations: JACKSON COUNTY (SCHOOL DISTRICT)
CARPENTER CONSTRUCTION CORPORATION (HIGHWAY 89 in MCKEE, KY)
(Resource Conservation and Recovery Act (tracking hazardous waste)) Organizations: CARPENTER CONSTRUCTION CORP. (CONTACT/OWNER)
COLE OIL CO (PO BOX 98 in MCKEE, KY)
National Pollutant Discharge Elimination System NON-MAJOR (Tracking pollutant discharge elimination systems) - permit Business SIC classification: PETROLEUM BULK STATIONS AND TERMINALS
MCKEE STP (INDIAN CREEK RD in MCKEE, KY)
National Pollutant Discharge Elimination System NON-MAJOR (Tracking pollutant discharge elimination systems) - permit Business SIC classification: SEWERAGE SYSTEMS
MCKEE WTP (990 HWY 421 S in MCKEE, KY)
National Pollutant Discharge Elimination System NON-MAJOR (Tracking pollutant discharge elimination systems) - permit Business SIC classification: WATER SUPPLY
Housing units lacking complete plumbing facilities: 9.0% Housing units lacking complete kitchen facilities: 7.6%
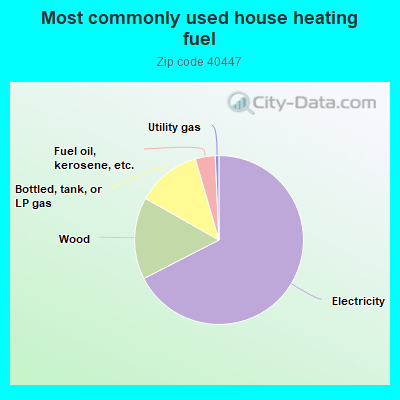
67.4%Electricity
15.7%Wood
12.3%Bottled, tank, or LP gas
3.8%Fuel oil, kerosene, etc.
0.7%Utility gas
Population in 1990: 8,071. Population change in the 1990s: +202 (+2.5%).
Place of birth for U.S.-born residents:
This state: 6,357
Northeast: 119
Midwest: 860
South: 282
West: 173
66% of the 40447 zip code residents lived in the same house 5 years ago. Out of people who lived in different houses, 63% lived in this county. Out of people who lived in different counties, 50% lived in Kentucky.
91% of the 40447 zip code residents lived in the same house 1 year ago. Out of people who lived in different houses, 38% moved from this county. Out of people who lived in different houses, 28% moved from different county within same state. Out of people who lived in different houses, 36% moved from different state.
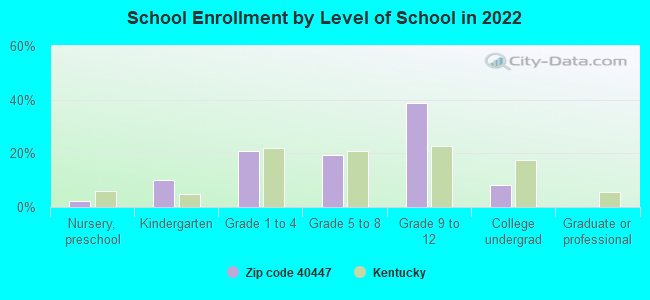
Private vs. public school enrollment:
Students in private schools in grades 1 to 8 (elementary and middle school): 50
Here:
7.4%
Kentucky:
17.2%
Students in private schools in grades 9 to 12 (high school):
Here:
0.0%
Kentucky:
15.2%
Students in private undergraduate colleges: 5
Here:
3.8%
Kentucky:
19.6%
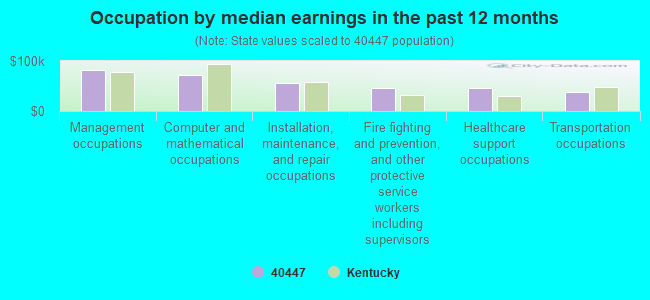
Occupation by median earnings in the past 12 months ($)
81,642Management occupations
72,557Computer and mathematical occupations
56,928Installation, maintenance, and repair occupations
46,387Fire fighting and prevention, and other protective service workers including supervisors
45,635Healthcare support occupations
38,759Transportation occupations
Companies with federal contracts located in this zip code:
JACKSON ENERGY COOPERATIVE COR (HWY 290 in MC KEE, KY) 125 employees, $61036573 revenue
$34,000 with Bureau of Prisoners/Federal Prison System for Electric Services. Signed on 1999-11-15. Completion date: 1999-11-15.
Top industries in this zip code by the number of employees in 2005:
Utilities: Electric Power Distribution (100-249 employees: 1 establishment)
Health Care and Social Assistance: Offices of Physicians (except Mental Health Specialists) (50-99: 1)
Finance and Insurance: Commercial Banking (20-49: 1, 10-19: 1)
Accommodation and Food Services: Limited-Service Restaurants (20-49: 1, 10-19: 1)
34 people in local jails and other municipal confinement facilities
People in group quarters in 2000:
29 people in local jails and other confinement facilities (including police lockups)
9 people in other group homes
2 people in religious group quarters
Fatal accident statistics in 2014:
Fatal accident count: 1
Vehicles involved in fatal accidents: 1
Fatal accidents caused by drunken drivers: 1
Fatalities: 1
Persons involved in fatal accidents: 1
Pedestrians involved in fatal accidents: 0
Fatal accident statistics in 2013:
Fatal accident count: 2
Vehicles involved in fatal accidents: 2
Fatal accidents caused by drunken drivers: 0
Fatalities: 2
Persons involved in fatal accidents: 2
Pedestrians involved in fatal accidents: 0
2002 - 2018 National Fire Incident Reporting System (NFIRS) incidents
According to the data from the years 2002 - 2018 the average number of fire incidents per year is 34. The highest number of fire incidents - 56 took place in 2014, and the least - 19 in 2002. The data has a growing trend.
When looking into fire subcategories, the most reports belonged to: Structure Fires (47.7%), and Outside Fires (37.6%).
Fire incident types reported to NFIRS in Zip Code 40447


 Nearest zip codes: 40481, 40434, 40336, 40402, 40486, 40460.
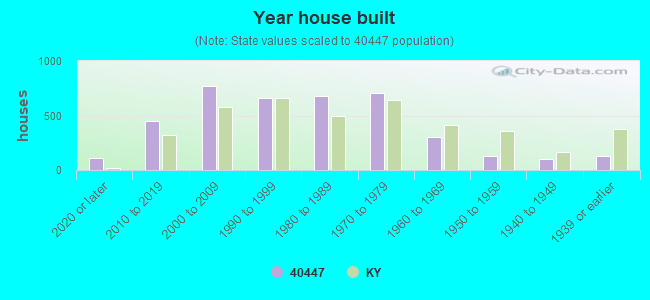


 According to the data from the years 2002 - 2018 the average number of fire incidents per year is 34. The highest number of fire incidents - 56 took place in 2014, and the least - 19 in 2002. The data has a growing trend.
 When looking into fire subcategories, the most reports belonged to: Structure Fires (47.7%), and Outside Fires (37.6%).