Estimated zip code population in 2022: 18,724 Zip code population in 2010: 18,758 Zip code population in 2000: 19,667
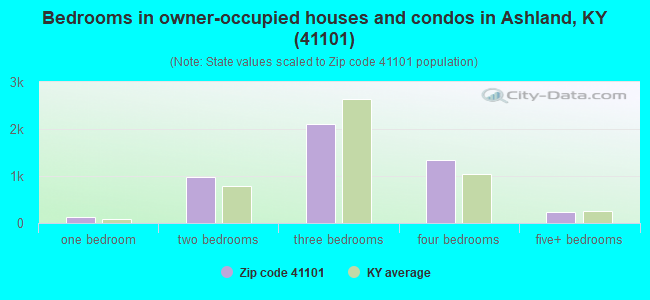
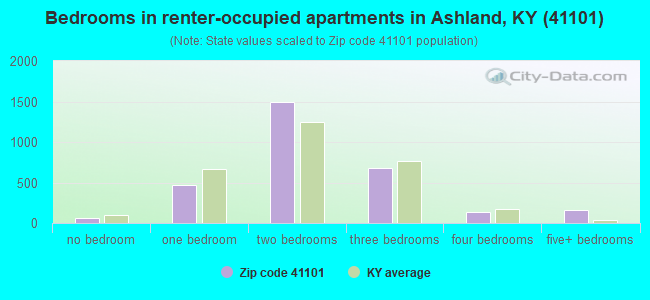
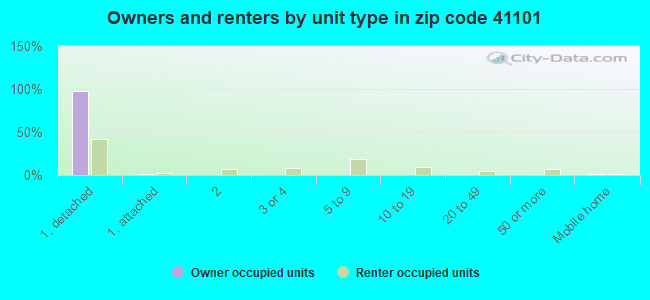
Houses and condos: 9,051 Renter-occupied apartments: 3,006
% of renters here:
39%
State:
31%
March 2022 cost of living index in zip code 41101: 81.8 (low, U.S. average is 100)
Land area: 9.6 sq. mi. Water area: 1.3 sq. mi.
Population density: 1,942 people per square mile
(low).
OSM Map
General Map
Google Map
MSN Map
OSM Map
General Map
Google Map
MSN Map
OSM Map
General Map
Google Map
MSN Map
OSM Map
General Map
Google Map
MSN Map
Please wait while loading the map...
Real estate property taxes paid for housing units in 2022:
This zip code:
1.0% ($1,285)
Kentucky:
0.7% ($1,456)
Median real estate property taxes paid for housing units with mortgages in 2022: $1,333 (1.0%) Median real estate property taxes paid for housing units with no mortgage in 2022: $1,185 (1.1%)
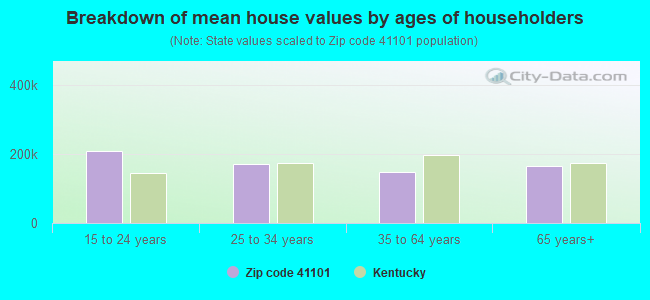
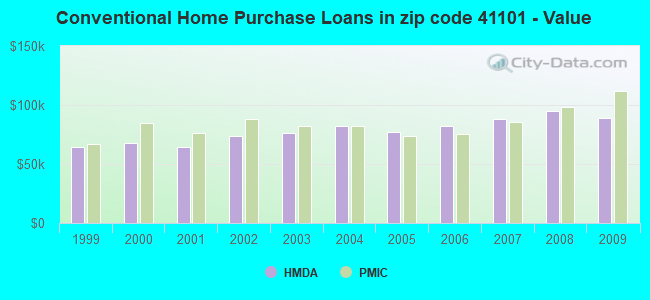
Estimated median house/condo value in 2022: $127,207
41101:
$127,207
Kentucky:
$196,300
According to our research of Kentucky and other state lists, there were 43 registered sex offenders living in 41101 zip code as of April 27, 2024. The ratio of all residents to sex offenders in zip code 41101 is 458 to 1. The ratio of registered sex offenders to all residents in this zip code is near the state average.
Median resident age:
This zip code:
41.3 years
Kentucky median age:
39.4 years
Average household size:
This zip code:
2.4 people
Kentucky:
2.4 people
Averages for the 2020 tax year for zip code 41101, filed in 2021:
Average Adjusted Gross Income (AGI) in 2020: $58,980 (Individual Income Tax Returns)
Here:
$58,980
State:
$61,342
Salary/wage: $48,660 (reported on 81.7% of returns)
Here:
$48,660
State:
$50,827
(% of AGI for various income ranges: 1092.2% for AGIs below $25k, 3292.6% for AGIs $25k-50k, 5876.5% for AGIs $50k-75k, 8673.3% for AGIs $75k-100k, 16413.6% for AGIs $100k-200k, 81246.7% for AGIs over 200k)
Taxable interest for individuals: $2,289 (reported on 23.8% of returns)
This zip code:
$2,289
Kentucky:
$1,441
(% of AGI for various income ranges: 9.7% for AGIs below $25k, 20.9% for AGIs $25k-50k, 36.5% for AGIs $50k-75k, 59.0% for AGIs $75k-100k, 156.7% for AGIs $100k-200k, 2602.2% for AGIs over 200k)
Ordinary dividends: $9,323 (reported on 11.7% of returns)
Here:
$9,323
State:
$7,388
(% of AGI for various income ranges: 9.8% for AGIs below $25k, 16.9% for AGIs $25k-50k, 63.9% for AGIs $50k-75k, 74.1% for AGIs $75k-100k, 385.0% for AGIs $100k-200k, 5822.2% for AGIs over 200k)
Net capital gain/loss in AGI: +$12,267 (reported on 9.8% of returns)
Here:
+$12,267
State:
+$19,475
(% of AGI for various income ranges: 3.8% for AGIs below $25k, 14.4% for AGIs $25k-50k, 34.3% for AGIs $50k-75k, 114.9% for AGIs $75k-100k, 333.6% for AGIs $100k-200k, 7267.8% for AGIs over 200k)
Profit/loss from business: +$16,357 (reported on 11.7% of returns)
Here:
+$16,357
State:
+$11,386
(% of AGI for various income ranges: 80.5% for AGIs below $25k, 74.6% for AGIs $25k-50k, 130.7% for AGIs $50k-75k, 164.9% for AGIs $75k-100k, 379.8% for AGIs $100k-200k, 8845.6% for AGIs over 200k)
Taxable individual retirement arrangement distribution: $18,116 (reported on 7.8% of returns)
41101:
$18,116
Kentucky:
$18,941
(% of AGI for various income ranges: 28.7% for AGIs below $25k, 88.7% for AGIs $25k-50k, 207.4% for AGIs $50k-75k, 312.3% for AGIs $75k-100k, 820.5% for AGIs $100k-200k, 2515.6% for AGIs over 200k)
Self-employed (Keogh) retirement plans: $20,500 (reported on 0.4% of returns)
41101:
$20,500
Kentucky:
$23,933
(% of AGI for various income ranges: 683.3% for AGIs over 200k)
Total itemized deductions: $33,417 (reported on 3.9% of returns)
Here:
$33,417
State:
$32,473
(% of AGI for various income ranges: 75.3% for AGIs $25k-50k, 157.8% for AGIs $50k-75k, 268.5% for AGIs $75k-100k, 567.1% for AGIs $100k-200k, 4380.0% for AGIs over 200k)
Charity contributions: $14,978 (reported on 3.1% of returns)
Here:
$14,978
State:
$13,472
(% of AGI for various income ranges: 9.3% for AGIs $25k-50k, 25.3% for AGIs $50k-75k, 66.2% for AGIs $75k-100k, 194.0% for AGIs $100k-200k, 2270.0% for AGIs over 200k)
Taxes paid: $7,179 (reported on 3.9% of returns)
41101:
$7,179
State:
$7,830
(% of AGI for various income ranges: 9.2% for AGIs $25k-50k, 24.6% for AGIs $50k-75k, 55.9% for AGIs $75k-100k, 161.2% for AGIs $100k-200k, 961.1% for AGIs over 200k)
Earned income credit: $2,359 (reported on 23.5% of returns)
Here:
$2,359
State:
$2,336
(% of AGI for various income ranges: 119.4% for AGIs below $25k, 83.3% for AGIs $25k-50k)
Percentage of individuals using paid preparers for their 2020 taxes: 95.0%
Here:
95%
State:
94%
(% for various income ranges: 95.0% for AGIs below $25k, 95.3% for AGIs $25k-50k, 94.9% for AGIs $50k-75k, 96.4% for AGIs $75k-100k, 93.1% for AGIs $100k-200k, 96.0% for AGIs over 200k)
Averages for the 2012 tax year for zip code 41101, filed in 2013:
Average Adjusted Gross Income (AGI) in 2012: $55,021 (Individual Income Tax Returns)
Here:
$55,021
State:
$50,814
Salary/wage: $44,996 (reported on 82.7% of returns)
Here:
$44,996
State:
$42,723
(% of AGI for various income ranges: 74.3% for AGIs below $25k, 74.2% for AGIs $25k-50k, 72.3% for AGIs $50k-75k, 73.8% for AGIs $75k-100k, 73.6% for AGIs $100k-200k, 54.3% for AGIs over 200k)
Taxable interest for individuals: $1,735 (reported on 28.1% of returns)
This zip code:
$1,735
Kentucky:
$1,381
(% of AGI for various income ranges: 1.1% for AGIs below $25k, 0.7% for AGIs $25k-50k, 0.5% for AGIs $50k-75k, 0.5% for AGIs $75k-100k, 0.7% for AGIs $100k-200k, 1.3% for AGIs over 200k)
Ordinary dividends: $7,603 (reported on 13.8% of returns)
Here:
$7,603
State:
$6,239
(% of AGI for various income ranges: 0.8% for AGIs below $25k, 0.6% for AGIs $25k-50k, 0.8% for AGIs $50k-75k, 1.1% for AGIs $75k-100k, 1.8% for AGIs $100k-200k, 3.8% for AGIs over 200k)
Net capital gain/loss in AGI: +$11,189 (reported on 10.1% of returns)
Here:
+$11,189
State:
+$11,336
(% of AGI for various income ranges: 0.6% for AGIs $25k-50k, 0.1% for AGIs $50k-75k, 0.9% for AGIs $75k-100k, 1.4% for AGIs $100k-200k, 5.1% for AGIs over 200k)
Profit/loss from business: +$13,628 (reported on 11.0% of returns)
Here:
+$13,628
State:
+$10,862
(% of AGI for various income ranges: 5.7% for AGIs below $25k, 1.7% for AGIs $25k-50k, 2.8% for AGIs $50k-75k, 1.0% for AGIs $75k-100k, 2.7% for AGIs $100k-200k, 2.9% for AGIs over 200k)
Taxable individual retirement arrangement distribution: $17,831 (reported on 8.7% of returns)
41101:
$17,831
Kentucky:
$14,296
(% of AGI for various income ranges: 1.7% for AGIs below $25k, 2.3% for AGIs $25k-50k, 2.6% for AGIs $50k-75k, 3.7% for AGIs $75k-100k, 3.7% for AGIs $100k-200k, 2.8% for AGIs over 200k)
Self-employment retirement plans: $17,900 (reported on 0.4% of returns)
41101:
$17,900
Kentucky:
$20,768
Total itemized deductions: $23,738 (17% of AGI, reported on 23.7% of returns)
Here:
$23,738
State:
$21,160
Here:
16.8% of AGI
State:
20.0% of AGI
(% of AGI for various income ranges: 4.9% for AGIs below $25k, 6.8% for AGIs $25k-50k, 8.2% for AGIs $50k-75k, 11.6% for AGIs $75k-100k, 13.6% for AGIs $100k-200k, 12.0% for AGIs over 200k)
Charity contributions: $5,603 (reported on 19.4% of returns)
Here:
$5,603
State:
$4,303
(% of AGI for various income ranges: 0.6% for AGIs below $25k, 1.0% for AGIs $25k-50k, 1.4% for AGIs $50k-75k, 2.0% for AGIs $75k-100k, 2.7% for AGIs $100k-200k, 2.7% for AGIs over 200k)
Taxes paid: $10,478 (reported on 23.5% of returns)
41101:
$10,478
State:
$8,496
(% of AGI for various income ranges: 0.8% for AGIs below $25k, 1.6% for AGIs $25k-50k, 2.6% for AGIs $50k-75k, 4.4% for AGIs $75k-100k, 6.4% for AGIs $100k-200k, 6.8% for AGIs over 200k)
Earned income credit: $2,109 (reported on 25.1% of returns)
Here:
$2,109
State:
$2,273
(% of AGI for various income ranges: 7.8% for AGIs below $25k, 1.1% for AGIs $25k-50k)
Percentage of individuals using paid preparers for their 2012 taxes: 53.6%
Here:
54%
State:
60%
(% for various income ranges: 48.7% for AGIs below $25k, 50.3% for AGIs $25k-50k, 60.0% for AGIs $50k-75k, 59.6% for AGIs $75k-100k, 62.5% for AGIs $100k-200k, 90.9% for AGIs over 200k)
Averages for the 2004 tax year for zip code 41101, filed in 2005:
Average Adjusted Gross Income (AGI) in 2004: $44,989 (Individual Income Tax Returns)
Here:
$44,989
State:
$41,540
Salary/wage: $37,692 (reported on 82.3% of returns)
Here:
$37,692
State:
$36,432
(% of AGI for various income ranges: 87.2% for AGIs below $10k, 72.3% for AGIs $10k-25k, 74.0% for AGIs $25k-50k, 76.7% for AGIs $50k-75k, 76.8% for AGIs $75k-100k, 59.9% for AGIs over 100k)
Taxable interest for individuals: $1,935 (reported on 38.8% of returns)
This zip code:
$1,935
Kentucky:
$1,571
(% of AGI for various income ranges: 3.2% for AGIs below $10k, 2.7% for AGIs $10k-25k, 1.5% for AGIs $25k-50k, 1.4% for AGIs $50k-75k, 1.7% for AGIs $75k-100k, 1.5% for AGIs over 100k)
Taxable dividends: $4,437 (reported on 19.5% of returns)
Here:
$4,437
State:
$3,453
(% of AGI for various income ranges: 2.0% for AGIs below $10k, 1.0% for AGIs $10k-25k, 0.7% for AGIs $25k-50k, 0.9% for AGIs $50k-75k, 1.8% for AGIs $75k-100k, 3.1% for AGIs over 100k)
Net capital gain/loss: +$7,859 (reported on 14.3% of returns)
Here:
+$7,859
State:
+$9,663
(% of AGI for various income ranges: -1.8% for AGIs below $10k, 0.3% for AGIs $10k-25k, 0.1% for AGIs $25k-50k, 1.0% for AGIs $50k-75k, 1.2% for AGIs $75k-100k, 5.2% for AGIs over 100k)
Profit/loss from business: +$8,881 (reported on 11.0% of returns)
Here:
+$8,881
State:
+$9,233
(% of AGI for various income ranges: 7.3% for AGIs below $10k, 2.9% for AGIs $10k-25k, 1.7% for AGIs $25k-50k, 1.4% for AGIs $50k-75k, 0.9% for AGIs $75k-100k, 2.5% for AGIs over 100k)
IRA payment deduction: $2,796 (reported on 2.0% of returns)
41101:
$2,796
Kentucky:
$2,955
(% of AGI for various income ranges: 0.2% for AGIs $10k-25k, 0.2% for AGIs $25k-50k, 0.1% for AGIs $50k-75k, 0.1% for AGIs $75k-100k, 0.1% for AGIs over 100k)
Self-employed pension: $19,273 (reported on 0.3% of returns)
Here:
$19,273
Kentucky:
$14,996
Total itemized deductions: $21,012 (19% of AGI, reported on 24.8% of returns)
Here:
$21,012
State:
$17,474
Here:
18.9% of AGI
State:
21.0% of AGI
(% of AGI for various income ranges: 6.1% for AGIs below $10k, 7.3% for AGIs $10k-25k, 7.9% for AGIs $25k-50k, 10.5% for AGIs $50k-75k, 13.5% for AGIs $75k-100k, 14.4% for AGIs over 100k)
Charity contributions deductions: $5,869 (5% of AGI, reported on 21.8% of returns)
Here:
$5,869
State:
$3,494
Here:
4.9% of AGI
State:
4.0% of AGI
(% of AGI for various income ranges: 0.4% for AGIs below $10k, 0.9% for AGIs $10k-25k, 1.2% for AGIs $25k-50k, 1.8% for AGIs $50k-75k, 2.6% for AGIs $75k-100k, 4.6% for AGIs over 100k)
Total tax: $8,584 (reported on 69.1% of returns)
41101:
$8,584
State:
$6,162
(% of AGI for various income ranges: 1.9% for AGIs below $10k, 3.4% for AGIs $10k-25k, 6.5% for AGIs $25k-50k, 9.3% for AGIs $50k-75k, 10.7% for AGIs $75k-100k, 21.3% for AGIs over 100k)
Earned income credit: $1,670 (reported on 22.0% of returns)
Here:
$1,670
State:
$1,723
Percentage of individuals using paid preparers for their 2004 taxes: 63.0%
Here:
63%
State:
66%
(% for various income ranges: 57.8% for AGIs below $10k, 65.4% for AGIs $10k-25k, 63.0% for AGIs $25k-50k, 61.2% for AGIs $50k-75k, 61.3% for AGIs $75k-100k, 74.9% for AGIs over 100k)
Likely homosexual households (counted as self-reported same-sex unmarried-partner households)
Lesbian couples: 0.1% of all households
Gay men: 0.1% of all households
Household received Food Stamps/SNAP in the past 12 months: 1,477 Household did not receive Food Stamps/SNAP in the past 12 months: 6,350
Women who had a birth in the past 12 months: 198 (79 now married, 122 unmarried) Women who did not have a birth in the past 12 months: 4,024 (1,752 now married, 2,270 unmarried)
Housing units in zip code 41101 with a mortgage: 2,708 (140 second mortgage, 14 home equity loan, 78 both second mortgage and home equity loan) Houses without a mortgage: 126
Median monthly owner costs for units with a mortgage: $1,140 Median monthly owner costs for units without a mortgage: $475
Residents with income below the poverty level in 2022:
This zip code:
20.3%
Whole state:
16.5%
Residents with income below 50% of the poverty level in 2022:
This zip code:
11.1%
Whole state:
9.0%
Median number of rooms in houses and condos:
Here:
6.9
State:
6.4
Median number of rooms in apartments:
Here:
4.8
State:
4.4
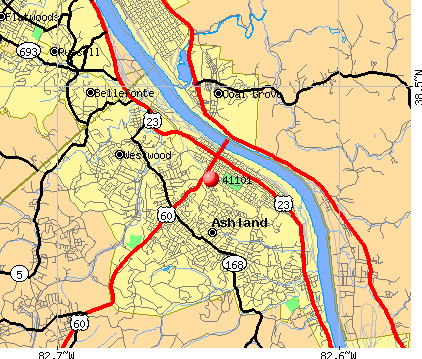
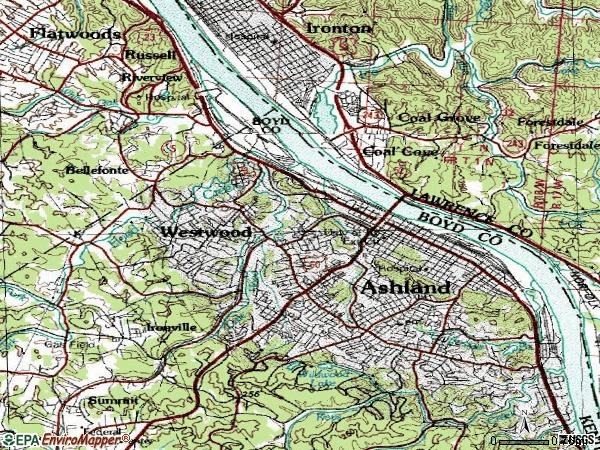
Notable locations in this zip code not listed on our city pages
Notable locations in zip code 41101: Amanda Iron Furnace (A), Bellefonte Iron Furnace (B), Armco Steel (C), Bellefonte Country Club (D), Boyd County Emergency Ambulance Service (E), Johnson Controls Fire and Rescue (F), Ashland Fire Department Station 2 (G), Ashland Fire Department (H). Display/hide their locations on the map
2,121 married couples with children.
1,409 single-parent households (288 men, 1,121 women).
95.3% of residents of 41101 zip code speak English at home.
2.9% of residents speak Spanish at home (58% very well, 33% well, 10% not well).
1.0% of residents speak other Indo-European language at home (88% very well, 12% well).
0.5% of residents speak Asian or Pacific Island language at home (40% very well, 52% well, 8% not well).
0.4% of residents speak other language at home (64% very well, 36% not well).
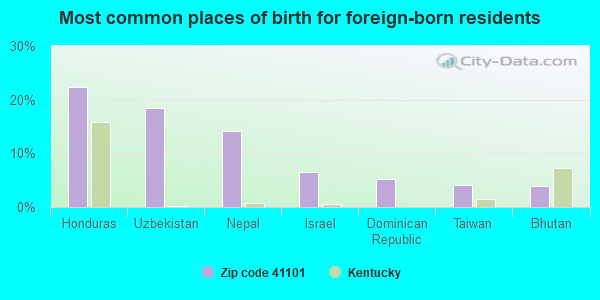
Foreign born population: 503 (2.7%) (63.5% of them are naturalized citizens)
This zip code:
2.7%
Whole state:
4.0%
22%Honduras
18%Uzbekistan
14%Nepal
7%Israel
5%Dominican Republic
4%Taiwan
4%Bhutan
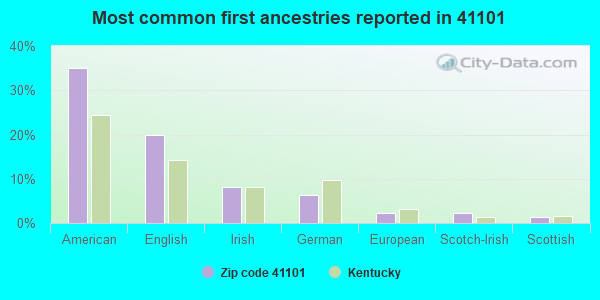
35%American
20%English
8%Irish
6%German
2%European
2%Scotch-Irish
1%Scottish
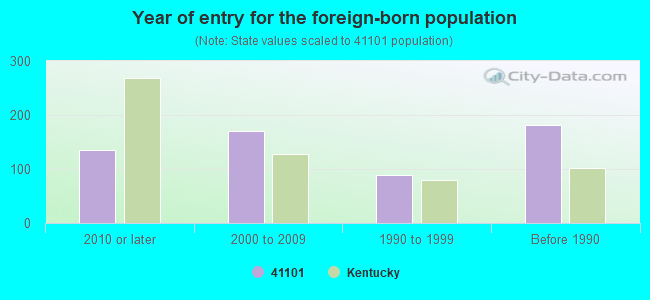
Year of entry for the foreign-born population
1352010 or later
1712000 to 2009
891990 to 1999
182Before 1990
Major facilities with environmental interests located in this zip code:
AK STEEL CORP ASHLAND WORKS COKE PLANT (US HIGHWAY 23 NORTH in ASHLAND, KY)
AIR MAJOR (AIRS/AFS) COMPLIANCE ACTIVITY (Tracking inspections of insecticide, fungicide, and rodenticide, and toxic substances) CRITERIA AND HAZARDOUS AIR POLLUTANT INVENTORY (Inventory of air pollution sources) National Pollutant Discharge Elimination System MAJOR (Tracking pollutant discharge elimination systems) - permit National Pollutant Discharge Elimination System MAJOR (Tracking pollutant discharge elimination systems) - permit HAZARDOUS WASTE BIENNIAL REPORTER (Resource Conservation and Recovery Act (tracking hazardous waste)) - ICIS-, ENFORCEMENT/COMPLIANCE ACTIVITY Large Quantity Generators, more that 1000 kg of hazardous waste/month (Resource Conservation and Recovery Act (tracking hazardous waste)) - notification - ICIS-, ENFORCEMENT/COMPLIANCE ACTIVITY TSD (Resource Conservation and Recovery Act (tracking hazardous waste)) - ICIS-, ENFORCEMENT/COMPLIANCE ACTIVITY Large Quantity Generators, more that 1000 kg of hazardous waste/month (Resource Conservation and Recovery Act (tracking hazardous waste)) - notification - ICIS-, ENFORCEMENT/COMPLIANCE ACTIVITY TRI REPORTER (Tracking of toxic chemicals releasing facilities) Business SIC classification: STEEL WORKS, BLAST FURNACES (INCLUDING COKE OVENS), AND ROLLING MILLS Business NAICS classification: IRON AND STEEL MILLS.; IRON AND STEEL MILLS. Organizations: AK STEEL CORPORATION (CONTACT/OPERATOR)
, AK STEEL CORP WEST WORKS (CONTACT/OWNER)
, AK STEEL CORP COKE PLANT (CONTACT/OWNER)
, AK STEEL CORPORATION (CONTACT/OWNER)
, ARMCO STEEL COMPANY, L.P. (CONTACT/OWNER)
Alternative names: AK STEEL CORPORATION ASHLAND WORKS, AK STEEL CORP COKE PLANT, AK STEEL CORP NORTON LANDFILL, AK STEEL CORP WEST WORKS, ARMCO STEEL CO. L.P., ARMCO STEEL CO. L.P. GREY IRON FNDY., ARMCO STEEL COMPANY LIMITED PARTNERSHIP GREY IRON FOUNDRY, ARMCO STEEL FOUNDRY
ADDINGTON MINING INC (2000 ASHLAND DRIVE in ASHLAND, KY)
National Pollutant Discharge Elimination System NON-MAJOR (Tracking pollutant discharge elimination systems) - permit National Pollutant Discharge Elimination System NON-MAJOR (Tracking pollutant discharge elimination systems) - permit National Pollutant Discharge Elimination System NON-MAJOR (Tracking pollutant discharge elimination systems) - permit National Pollutant Discharge Elimination System NON-MAJOR (Tracking pollutant discharge elimination systems) - permit National Pollutant Discharge Elimination System NON-MAJOR (Tracking pollutant discharge elimination systems) - permit National Pollutant Discharge Elimination System NON-MAJOR (Tracking pollutant discharge elimination systems) - permit National Pollutant Discharge Elimination System NON-MAJOR (Tracking pollutant discharge elimination systems) - permit National Pollutant Discharge Elimination System NON-MAJOR (Tracking pollutant discharge elimination systems) - permit National Pollutant Discharge Elimination System NON-MAJOR (Tracking pollutant discharge elimination systems) - permit National Pollutant Discharge Elimination System NON-MAJOR (Tracking pollutant discharge elimination systems) - permit Business SIC classification: BITUMINOUS COAL AND LIGNITE SURFACE MINING Organizations: HNR MINING INC (CONTACT/OWNER)
, HNR MINING NC (CONTACT/OWNER)
, LCC KENTUCKY LLC (CONTACT/OWNER)
Alternative names: HNR MINING INC, LCC KENTUCKY LLC
CHEVRON, USA (53RD STREET in ASHLAND, KY)
AIR MINOR (AIRS/AFS) (Resource Conservation and Recovery Act (tracking hazardous waste)) Business SIC classification: PETROLEUM BULK STATIONS AND TERMINALS Organizations: CHEVRON USA (CONTACT/OWNER)
, CHEVRON USA, INC. (CONTACT/OWNER)
Alternative names: CHEVRON USA INC ASHLAND PLANT, CHEVRON USA INC. - ASHLAND TERMINAL
CATLETTSBURG REFINING LLC (MARINE REPAIR TERMINAL in ASHLAND, KY)
AIR MAJOR (AIRS/AFS) (Integrated Compliance Information System) - ICIS-HQ-1996-0063, FORMAL ENFORCEMENT ACTION CRITERIA AND HAZARDOUS AIR POLLUTANT INVENTORY (Inventory of air pollution sources) Business SIC and NAICS classification: SHIP BUILDING AND REPAIRING Alternative names: ASHLAND EXPLORATION INC, MARATHON ASHLAND PETROLEUM LLC
LIQUID TRANSPORTERS INC (US 60 WEST MEAD STATION in ASHLAND, KY)
National Pollutant Discharge Elimination System NON-MAJOR (Tracking pollutant discharge elimination systems) - permit (Resource Conservation and Recovery Act (tracking hazardous waste)) Business SIC classification: TRUCKING, EXCEPT LOCAL
ASHLAND DAY TREATMENT CENTER ALT CTR (1539 GREENUP AVE in ASHLAND, KY)
(National Center for Education Statistics) - STATE ID-045502160 Organizations: RACELAND INDEPENDENT (SCHOOL DISTRICT)
PERMITS INC (320 BELLEFONTE DR in ASHLAND, KY)
AIR MINOR (AIRS/AFS) CRITERIA AND HAZARDOUS AIR POLLUTANT INVENTORY (Inventory of air pollution sources) National Pollutant Discharge Elimination System NON-MAJOR (Tracking pollutant discharge elimination systems) - permit Business SIC classification: BITUMINOUS COAL AND LIGNITE SURFACE MINING
OAKVIEW ELEMENTARY SCHOOL (3111 BLACKBURN AVE in ASHLAND, KY)
(National Center for Education Statistics) - STATE ID-010012100 Organizations: ASHLAND INDEPENDENT (SCHOOL DISTRICT)
ASHLAND CENTRAL ALTERNATIVE SCHOOL (1420 CENTRAL AVE in ASHLAND, KY)
(National Center for Education Statistics) - STATE ID-010012011 Organizations: ASHLAND INDEPENDENT (SCHOOL DISTRICT)
(Integrated Compliance Information System) - ICIS-04-2004-5067, FORMAL ENFORCEMENT ACTION
AIR PRODUCTS & CHEMICALS INC. ASHLAND KY FAC. (125 RUSSELL RD. in ASHLAND, KY)
National Pollutant Discharge Elimination System NON-MAJOR (Tracking pollutant discharge elimination systems) - permit Conditionally Exempt Small Quantity Generators, less than 100 kg/month of hazardous waste (Resource Conservation and Recovery Act (tracking hazardous waste)) - notification TRI REPORTER (Tracking of toxic chemicals releasing facilities) Business SIC classification: INDUSTRIAL GASES Organizations: AIR PRODS & CHEM ASHLAND (CONTACT/OWNER)
, AIR PRODUCTS COMPANY (CONTACT/OWNER)
Alternative names: AIR PRODS & CHEM ASHLAND
ARMCO STEEL FOUNDRY (23RD & FRONT ST in ASHLAND, KY)
AIR MINOR (AIRS/AFS) National Pollutant Discharge Elimination System NON-MAJOR (Tracking pollutant discharge elimination systems) - permit Business SIC classification: STEEL WORKS, BLAST FURNACES (INCLUDING COKE OVENS), AND ROLLING MILLS; REFUSE SYSTEMS Organizations: AK STEEL CORP NORTON LANDFILL (CONTACT/OWNER)
Alternative names: AK STEEL CORP NORTON LANDFILL
AVERITT EXPRESS INC (12297 VIRGINIA BLVD in ASHLAND, KY)
National Pollutant Discharge Elimination System NON-MAJOR (Tracking pollutant discharge elimination systems) - permit Business SIC classification: TRUCKING, EXCEPT LOCAL
Housing units lacking complete plumbing facilities: 1.8% Housing units lacking complete kitchen facilities: 2.5%
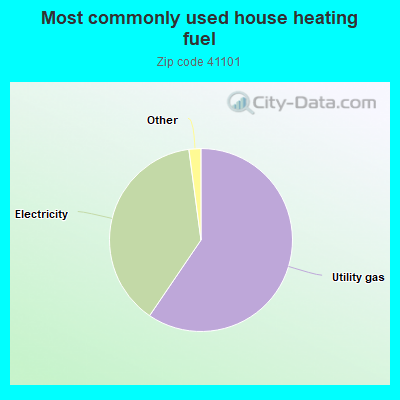
59.5%Utility gas
38.4%Electricity
1.0%Bottled, tank, or LP gas
0.8%No fuel used
Population in 1990: 17,464. Population change in the 1990s: +2,203 (+12.6%).
Place of birth for U.S.-born residents:
This state: 11,432
Northeast: 457
Midwest: 2,546
South: 3,356
West: 371
52% of the 41101 zip code residents lived in the same house 5 years ago. Out of people who lived in different houses, 57% lived in this county. Out of people who lived in different counties, 50% lived in Kentucky.
89% of the 41101 zip code residents lived in the same house 1 year ago. Out of people who lived in different houses, 53% moved from this county. Out of people who lived in different houses, 27% moved from different county within same state. Out of people who lived in different houses, 19% moved from different state.
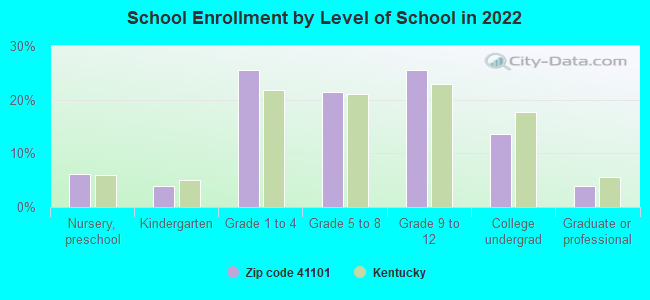
Private vs. public school enrollment:
Students in private schools in grades 1 to 8 (elementary and middle school): 128
Here:
6.4%
Kentucky:
17.2%
Students in private schools in grades 9 to 12 (high school): 57
Here:
5.2%
Kentucky:
15.2%
Students in private undergraduate colleges: 62
Here:
10.4%
Kentucky:
19.6%
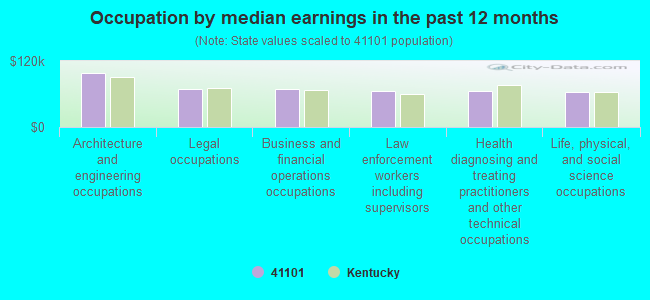
Occupation by median earnings in the past 12 months ($)
97,444Architecture and engineering occupations
69,996Legal occupations
69,605Business and financial operations occupations
65,949Law enforcement workers including supervisors
65,158Health diagnosing and treating practitioners and other technical occupations
63,736Life, physical, and social science occupations
Companies with biggest federal contracts located in this zip code (ASHLAND, KY):
JACK FANNIN (1544 WINCHESTER AVENUE, SU) : $70,700 in 14 contractsfrom 2002 to 2006
Contracts for Real Property Appraisals Services (SIC 6531) by Army, U.S. Army Corps of Engineers - civil program financing only, Public Buildings Service Signed by year:2000: $0; 2001: $0; 2002: $9,700; 2003: $14,100; 2004: $39,400; 2005: $5,000; 2006: $2,500.
Biggest contracts:
$19,700 with Army for Real Property Appraisals Services (SIC 6531). Taking place in WV. Signed on 2004-11-23. Completion date: 2005-02-16.
$19,700 with U.S. Army Corps of Engineers - civil program financing only for Real Property Appraisals Services (SIC 6531). Taking place in WV. Signed on 2004-11-23. Completion date: 2005-02-16.
$10,400, same as above.Signed on 2005-02-07. Completion date: 2005-04-06.
$10,400 with Army for Real Property Appraisals Services (SIC 6531). Taking place in WV. Signed on 2005-02-07. Completion date: 2005-04-06.
ASHLAND CYCLE CENTER INC (2605 GREENUP AVE; small business) : $55,512 in 4 contractsin 2004
$13,878 with Army for Truck and Tractor Attachments. Signed on 2004-08-05. Completion date: 2004-08-20.
$13,878 with Army for Mining, Rock Drilling, Earth Boring and Related Equipment. Signed on 2004-08-05. Completion date: 2004-09-30.
$13,878 with U.S. Army Corps of Engineers - civil program financing only for Mining, Rock Drilling, Earth Boring and Related Equipment. Signed on 2004-08-05. Completion date: 2004-09-30.
$13,878 with U.S. Army Corps of Engineers - civil program financing only for Truck and Tractor Attachments. Signed on 2004-08-05. Completion date: 2004-08-20.
BUREAU OF PRISONS (HC 716; small business)
$28,000 with Bureau of Prisoners/Federal Prison System for Other Medical Services. Signed on 2001-05-15. Completion date: 2001-09-15.
RAM TECHNOLOGIES, INC (2025 13TH STREET; small business) : $16,918 in 7 contractsfrom 2002 to 2006
Contracts for Miscellaneous Communication Equipment, Communications Services, Telephone and Telegraph Equipment by Army, Drug Enforcement Administration Signed by year:2000: $0; 2001: $0; 2002: $82; 2003: $7,785; 2004: $8,909; 2005: $1,324; 2006: -$1,182.
Biggest contracts:
$8,909 with Army for Miscellaneous Communication Equipment. Taking place in MS. Signed on 2004-02-28. Completion date: 2004-01-06.
$7,785 with Army for Miscellaneous Communication Equipment. Signed on 2003-01-15. Completion date: 2003-01-20.
$1,324 with Drug Enforcement Administration for Communications Services. Taking place in MI. Signed on 2005-11-15. Effective on 2005-10-01. Completion date: 2006-09-30.
$82 with Army for Telephone and Telegraph Equipment. Signed on 2002-08-15. Completion date: 2002-09-26.
DR. RALPH TOUMA (320 21ST STREET; small business)
$15,480 with Bureau of Prisoners/Federal Prison System for Other Medical Services. Signed on 2004-10-21. Completion date: 2005-09-30.
SKPR KY2, LLC (1441 WINCHESTER AVE)
$9,818 with Army for Lodging - Hotel/Motel. Signed on 2003-02-10. Completion date: 2003-02-10.
DR. MARK PACK (800 ST. CHRISTOPHER DRIVE; small business)
$7,659 with Bureau of Prisoners/Federal Prison System for Other Medical Services. Signed on 2004-10-21. Completion date: 2005-09-30.
DR. ROGER KLEIN (800 ST. CHRISTOPHER DRIVE; small business)
$4,376 with Bureau of Prisoners/Federal Prison System for Other Medical Services. Signed on 2004-10-21. Completion date: 2005-09-30.
ROSE, SHORT & PITT (1544 WINCHESTER AVE STE 11; small business) : $3,650 in 10 contractsfrom 2005 to 2006
Contracts for Legal Services, Real Property Appraisals Services (SIC 6531) by U.S. Army Corps of Engineers - civil program financing only, Army Signed by year:2000: $0; 2001: $0; 2002: $0; 2003: $0; 2004: $0; 2005: $3,700; 2006: -$50.
Biggest contracts:
$600 with U.S. Army Corps of Engineers - civil program financing only for Legal Services. Signed on 2005-06-08. Completion date: 2005-06-17.
$600, same as above.Signed on 2005-06-08. Completion date: 2005-06-17.
$600 with Army for Real Property Appraisals Services (SIC 6531). Signed on 2005-06-08. Completion date: 2005-06-17.
$600 with Army for Legal Services. Signed on 2005-06-08. Completion date: 2005-06-17.
FR. JOHN NOE (900 WINCHESTER AVENUE; small business) : $2,600 in 2 contractsfrom 2004 to 2005
$1,400 with Bureau of Prisoners/Federal Prison System for Chaplain Services. Signed on 2004-10-01. Completion date: 2005-09-30.
$1,200, same as above.Signed on 2005-10-01. Completion date: 2006-09-30.
Top industries in this zip code by the number of employees in 2005:
Health Care and Social Assistance: General Medical and Surgical Hospitals (over 1000 employees: 1 establishment, 500-999 employees: 1 establishment)
2002 - 2017 National Fire Incident Reporting System (NFIRS) incidents
According to the data from the years 2002 - 2017 the average number of fire incidents per year is 141. The highest number of fire incidents - 251 took place in 2009, and the least - 64 in 2016. The data has an increasing trend.
When looking into fire subcategories, the most reports belonged to: Structure Fires (59.7%), and Outside Fires (22.5%).
Fire incident types reported to NFIRS in Zip Code 41101

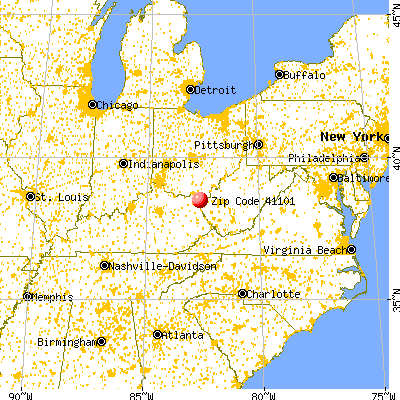


 Nearest zip codes: 41139, 45638, 41102, 45680, 41169, 25507.


 According to the data from the years 2002 - 2017 the average number of fire incidents per year is 141. The highest number of fire incidents - 251 took place in 2009, and the least - 64 in 2016. The data has an increasing trend.
 When looking into fire subcategories, the most reports belonged to: Structure Fires (59.7%), and Outside Fires (22.5%).