Estimated zip code population in 2022: 6,533 Zip code population in 2010: 5,799 Zip code population in 2000: 6,028
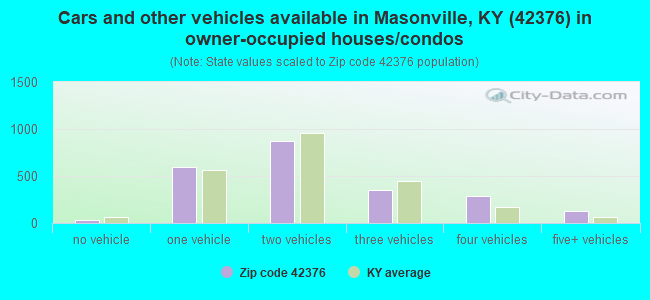
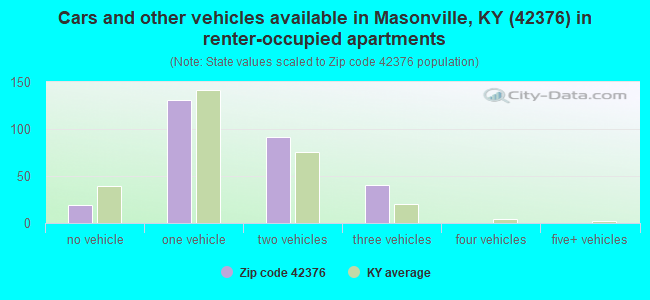
Houses and condos: 2,646 Renter-occupied apartments: 281
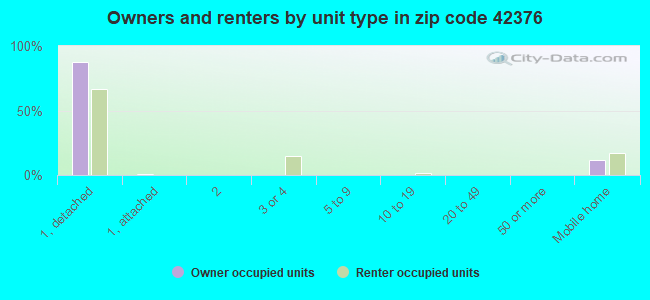
% of renters here:
11%
State:
31%
March 2022 cost of living index in zip code 42376: 82.2 (low, U.S. average is 100)
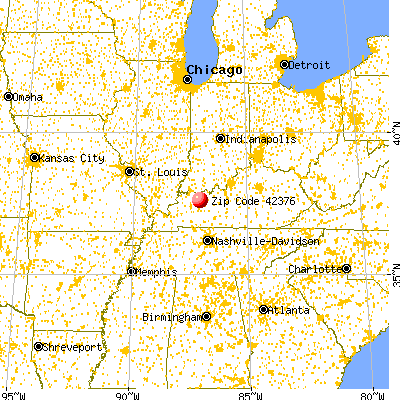
Land area: 100.0 sq. mi. Water area: 1.0 sq. mi.
Population density: 65 people per square mile
(very low).
OSM Map
General Map
Google Map
MSN Map
OSM Map
General Map
Google Map
MSN Map
OSM Map
General Map
Google Map
MSN Map
OSM Map
General Map
Google Map
MSN Map
Please wait while loading the map...
Real estate property taxes paid for housing units in 2022:
This zip code:
0.7% ($1,403)
Kentucky:
0.7% ($1,456)
Median real estate property taxes paid for housing units with mortgages in 2022: $1,589 (0.7%) Median real estate property taxes paid for housing units with no mortgage in 2022: $1,154 (0.8%)
Business Search- 14 Million verified businesses
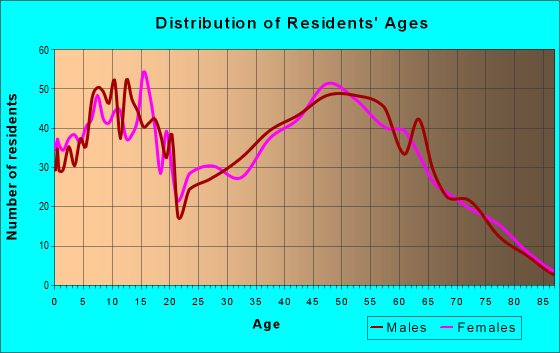
Males: 3,303
(50.6%)
Females: 3,229
(49.4%)
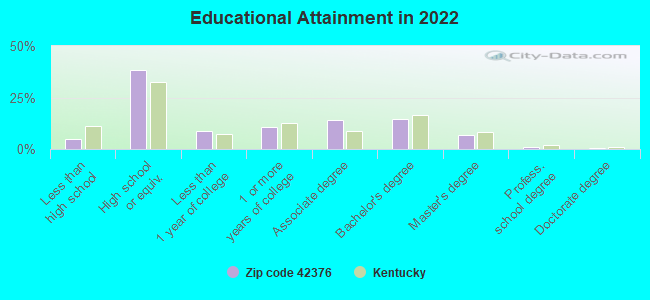
For population 25 years and over in 42376:
High school or higher: 95.2%
Bachelor's degree or higher: 22.9%
Graduate or professional degree: 8.3%
Unemployed: 3.3%
Mean travel time to work (commute): 25.5 minutes
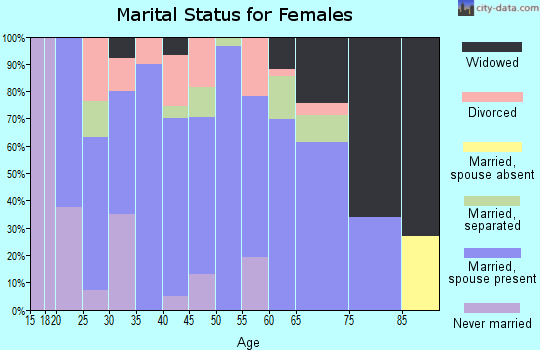
For population 15 years and over in 42376:
Never married: 20.4%
Now married: 60.6%
Separated: 0.7%
Widowed: 7.4%
Divorced: 10.8%
Zip code 42376 compared to state average:
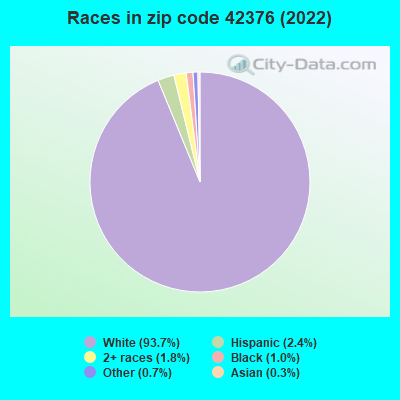
Black race population percentage significantly below state average.
Foreign-born population percentage significantly below state average.
Renting percentage significantly below state average.
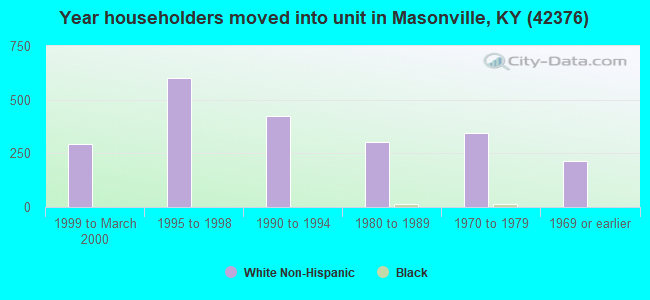
Length of stay since moving in significantly above state average.
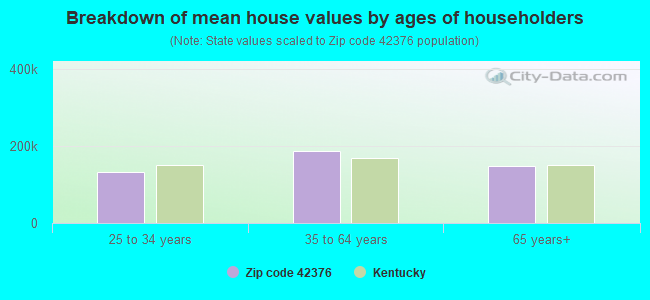
Estimated median house/condo value in 2022: $197,853
42376:
$197,853
Kentucky:
$196,300
According to our research of Kentucky and other state lists, there were 14 registered sex offenders living in 42376 zip code as of April 26, 2024. The ratio of all residents to sex offenders in zip code 42376 is 451 to 1. The ratio of registered sex offenders to all residents in this zip code is near the state average.
Median resident age:
This zip code:
40.6 years
Kentucky median age:
39.4 years
Average household size:
This zip code:
2.6 people
Kentucky:
2.4 people
Averages for the 2020 tax year for zip code 42376, filed in 2021:
Average Adjusted Gross Income (AGI) in 2020: $63,815 (Individual Income Tax Returns)
Here:
$63,815
State:
$61,342
Salary/wage: $55,323 (reported on 85.1% of returns)
Here:
$55,323
State:
$50,827
(% of AGI for various income ranges: 1151.7% for AGIs below $25k, 3509.3% for AGIs $25k-50k, 6473.8% for AGIs $50k-75k, 9528.0% for AGIs $75k-100k, 16680.3% for AGIs $100k-200k, 77900.0% for AGIs over 200k)
Taxable interest for individuals: $1,226 (reported on 23.7% of returns)
This zip code:
$1,226
Kentucky:
$1,441
(% of AGI for various income ranges: 23.4% for AGIs below $25k, 20.2% for AGIs $25k-50k, 36.5% for AGIs $50k-75k, 13.0% for AGIs $75k-100k, 90.0% for AGIs $100k-200k, 940.0% for AGIs over 200k)
Ordinary dividends: $3,377 (reported on 14.3% of returns)
Here:
$3,377
State:
$7,388
(% of AGI for various income ranges: 12.8% for AGIs below $25k, 19.1% for AGIs $25k-50k, 60.8% for AGIs $50k-75k, 34.0% for AGIs $75k-100k, 113.7% for AGIs $100k-200k, 3150.0% for AGIs over 200k)
Net capital gain/loss in AGI: +$11,995 (reported on 12.3% of returns)
Here:
+$11,995
State:
+$19,475
(% of AGI for various income ranges: 9.7% for AGIs below $25k, 40.7% for AGIs $25k-50k, 82.7% for AGIs $50k-75k, 82.0% for AGIs $75k-100k, 504.0% for AGIs $100k-200k, 11035.0% for AGIs over 200k)
Profit/loss from business: +$7,335 (reported on 14.0% of returns)
Here:
+$7,335
State:
+$11,386
(% of AGI for various income ranges: 80.8% for AGIs below $25k, 69.1% for AGIs $25k-50k, 226.5% for AGIs $50k-75k, 234.7% for AGIs $75k-100k, 235.7% for AGIs $100k-200k)
Taxable individual retirement arrangement distribution: $18,719 (reported on 8.8% of returns)
42376:
$18,719
Kentucky:
$18,941
(% of AGI for various income ranges: 55.2% for AGIs below $25k, 114.2% for AGIs $25k-50k, 238.6% for AGIs $50k-75k, 221.3% for AGIs $75k-100k, 840.0% for AGIs $100k-200k)
Total itemized deductions: $32,100 (reported on 4.5% of returns)
Here:
$32,100
State:
$32,473
(% of AGI for various income ranges: 427.6% for AGIs $50k-75k, 397.0% for AGIs $100k-200k, 8605.0% for AGIs over 200k)
Charity contributions: $13,680 (reported on 3.2% of returns)
Here:
$13,680
State:
$13,472
(% of AGI for various income ranges: 90.0% for AGIs $50k-75k, 106.3% for AGIs $100k-200k, 3580.0% for AGIs over 200k)
Taxes paid: $8,238 (reported on 4.2% of returns)
42376:
$8,238
State:
$7,830
(% of AGI for various income ranges: 95.4% for AGIs $50k-75k, 130.7% for AGIs $100k-200k, 1630.0% for AGIs over 200k)
Earned income credit: $2,195 (reported on 14.3% of returns)
Here:
$2,195
State:
$2,336
(% of AGI for various income ranges: 78.9% for AGIs below $25k, 82.4% for AGIs $25k-50k)
Percentage of individuals using paid preparers for their 2020 taxes: 93.8%
Here:
94%
State:
94%
(% for various income ranges: 93.3% for AGIs below $25k, 94.2% for AGIs $25k-50k, 94.2% for AGIs $50k-75k, 97.6% for AGIs $75k-100k, 91.8% for AGIs $100k-200k, 87.5% for AGIs over 200k)
Averages for the 2012 tax year for zip code 42376, filed in 2013:
Average Adjusted Gross Income (AGI) in 2012: $53,630 (Individual Income Tax Returns)
Here:
$53,630
State:
$50,814
Salary/wage: $45,236 (reported on 85.3% of returns)
Here:
$45,236
State:
$42,723
(% of AGI for various income ranges: 73.8% for AGIs below $25k, 78.2% for AGIs $25k-50k, 78.5% for AGIs $50k-75k, 77.2% for AGIs $75k-100k, 74.0% for AGIs $100k-200k, 45.1% for AGIs over 200k)
Taxable interest for individuals: $1,258 (reported on 30.9% of returns)
This zip code:
$1,258
Kentucky:
$1,381
(% of AGI for various income ranges: 1.1% for AGIs below $25k, 0.5% for AGIs $25k-50k, 0.9% for AGIs $50k-75k, 0.4% for AGIs $75k-100k, 0.8% for AGIs $100k-200k, 0.8% for AGIs over 200k)
Ordinary dividends: $1,783 (reported on 16.2% of returns)
Here:
$1,783
State:
$6,239
(% of AGI for various income ranges: 0.7% for AGIs below $25k, 0.4% for AGIs $25k-50k, 0.6% for AGIs $50k-75k, 0.3% for AGIs $75k-100k, 0.7% for AGIs $100k-200k, 0.6% for AGIs over 200k)
Net capital gain/loss in AGI: +$5,220 (reported on 13.5% of returns)
Here:
+$5,220
State:
+$11,336
(% of AGI for various income ranges: 0.6% for AGIs $25k-50k, 0.6% for AGIs $50k-75k, 0.6% for AGIs $75k-100k, 3.1% for AGIs $100k-200k, 2.1% for AGIs over 200k)
Profit/loss from business: +$11,808 (reported on 13.9% of returns)
Here:
+$11,808
State:
+$10,862
(% of AGI for various income ranges: 5.4% for AGIs below $25k, 2.7% for AGIs $25k-50k, 3.0% for AGIs $50k-75k, 1.5% for AGIs $75k-100k, 2.9% for AGIs $100k-200k, 4.5% for AGIs over 200k)
Taxable individual retirement arrangement distribution: $12,912 (reported on 9.7% of returns)
42376:
$12,912
Kentucky:
$14,296
(% of AGI for various income ranges: 3.3% for AGIs below $25k, 2.6% for AGIs $25k-50k, 2.2% for AGIs $50k-75k, 2.9% for AGIs $75k-100k, 2.9% for AGIs $100k-200k)
Total itemized deductions: $20,036 (20% of AGI, reported on 29.0% of returns)
Here:
$20,036
State:
$21,160
Here:
19.7% of AGI
State:
20.0% of AGI
(% of AGI for various income ranges: 6.9% for AGIs below $25k, 8.7% for AGIs $25k-50k, 9.8% for AGIs $50k-75k, 11.4% for AGIs $75k-100k, 14.2% for AGIs $100k-200k, 10.6% for AGIs over 200k)
Charity contributions: $4,133 (reported on 22.4% of returns)
Here:
$4,133
State:
$4,303
(% of AGI for various income ranges: 0.8% for AGIs below $25k, 1.0% for AGIs $25k-50k, 1.5% for AGIs $50k-75k, 1.8% for AGIs $75k-100k, 2.3% for AGIs $100k-200k, 2.3% for AGIs over 200k)
Taxes paid: $7,080 (reported on 29.0% of returns)
42376:
$7,080
State:
$8,496
(% of AGI for various income ranges: 1.0% for AGIs below $25k, 1.8% for AGIs $25k-50k, 2.8% for AGIs $50k-75k, 3.9% for AGIs $75k-100k, 5.9% for AGIs $100k-200k, 5.6% for AGIs over 200k)
Earned income credit: $2,275 (reported on 17.0% of returns)
Here:
$2,275
State:
$2,273
(% of AGI for various income ranges: 6.0% for AGIs below $25k, 1.4% for AGIs $25k-50k)
Percentage of individuals using paid preparers for their 2012 taxes: 62.9%
Here:
63%
State:
60%
(% for various income ranges: 57.4% for AGIs below $25k, 61.0% for AGIs $25k-50k, 68.9% for AGIs $50k-75k, 67.7% for AGIs $75k-100k, 68.0% for AGIs $100k-200k, 80.0% for AGIs over 200k)
Averages for the 2004 tax year for zip code 42376, filed in 2005:
Average Adjusted Gross Income (AGI) in 2004: $42,601 (Individual Income Tax Returns)
Here:
$42,601
State:
$41,540
Salary/wage: $37,882 (reported on 87.1% of returns)
Here:
$37,882
State:
$36,432
(% of AGI for various income ranges: 111.0% for AGIs below $10k, 75.9% for AGIs $10k-25k, 81.3% for AGIs $25k-50k, 84.2% for AGIs $50k-75k, 83.3% for AGIs $75k-100k, 59.4% for AGIs over 100k)
Taxable interest for individuals: $1,375 (reported on 43.0% of returns)
This zip code:
$1,375
Kentucky:
$1,571
(% of AGI for various income ranges: 4.8% for AGIs below $10k, 1.9% for AGIs $10k-25k, 1.5% for AGIs $25k-50k, 0.9% for AGIs $50k-75k, 0.8% for AGIs $75k-100k, 1.8% for AGIs over 100k)
Taxable dividends: $1,442 (reported on 18.4% of returns)
Here:
$1,442
State:
$3,453
(% of AGI for various income ranges: 1.7% for AGIs below $10k, 0.6% for AGIs $10k-25k, 0.5% for AGIs $25k-50k, 0.3% for AGIs $50k-75k, 0.2% for AGIs $75k-100k, 1.3% for AGIs over 100k)
Net capital gain/loss: +$6,216 (reported on 14.8% of returns)
Here:
+$6,216
State:
+$9,663
(% of AGI for various income ranges: 0.2% for AGIs below $10k, 0.7% for AGIs $10k-25k, 0.7% for AGIs $25k-50k, 0.9% for AGIs $50k-75k, 1.3% for AGIs $75k-100k, 6.5% for AGIs over 100k)
Profit/loss from business: +$6,676 (reported on 16.6% of returns)
Here:
+$6,676
State:
+$9,233
(% of AGI for various income ranges: 3.8% for AGIs below $10k, 3.7% for AGIs $10k-25k, 3.2% for AGIs $25k-50k, 1.5% for AGIs $50k-75k, 3.6% for AGIs $75k-100k, 2.0% for AGIs over 100k)
IRA payment deduction: $3,148 (reported on 2.6% of returns)
42376:
$3,148
Kentucky:
$2,955
Total itemized deductions: $15,443 (20% of AGI, reported on 31.9% of returns)
Here:
$15,443
State:
$17,474
Here:
20.4% of AGI
State:
21.0% of AGI
(% of AGI for various income ranges: 8.6% for AGIs below $10k, 9.3% for AGIs $10k-25k, 9.6% for AGIs $25k-50k, 12.7% for AGIs $50k-75k, 14.0% for AGIs $75k-100k, 11.7% for AGIs over 100k)
Charity contributions deductions: $2,979 (4% of AGI, reported on 26.0% of returns)
Here:
$2,979
State:
$3,494
Here:
3.7% of AGI
State:
4.0% of AGI
(% of AGI for various income ranges: 1.0% for AGIs below $10k, 1.0% for AGIs $10k-25k, 1.2% for AGIs $25k-50k, 1.9% for AGIs $50k-75k, 2.6% for AGIs $75k-100k, 2.2% for AGIs over 100k)
Total tax: $5,209 (reported on 75.9% of returns)
42376:
$5,209
State:
$6,162
(% of AGI for various income ranges: 2.7% for AGIs below $10k, 4.1% for AGIs $10k-25k, 6.1% for AGIs $25k-50k, 8.1% for AGIs $50k-75k, 10.6% for AGIs $75k-100k, 15.6% for AGIs over 100k)
Earned income credit: $1,678 (reported on 15.0% of returns)
Here:
$1,678
State:
$1,723
Percentage of individuals using paid preparers for their 2004 taxes: 62.9%
Here:
63%
State:
66%
(% for various income ranges: 52.0% for AGIs below $10k, 58.5% for AGIs $10k-25k, 67.2% for AGIs $25k-50k, 67.9% for AGIs $50k-75k, 66.7% for AGIs $75k-100k, 76.3% for AGIs over 100k)
Household received Food Stamps/SNAP in the past 12 months: 164 Household did not receive Food Stamps/SNAP in the past 12 months: 2,366
Women who had a birth in the past 12 months: 76 (61 now married, 15 unmarried) Women who did not have a birth in the past 12 months: 1,293 (707 now married, 589 unmarried)
Housing units in zip code 42376 with a mortgage: 1,309 (105 second mortgage, 8 home equity loan, 98 both second mortgage and home equity loan) Houses without a mortgage: 38
Median monthly owner costs for units with a mortgage: $1,301 Median monthly owner costs for units without a mortgage: $449
Residents with income below the poverty level in 2022:
This zip code:
12.6%
Whole state:
16.5%
Residents with income below 50% of the poverty level in 2022:
This zip code:
5.7%
Whole state:
9.0%
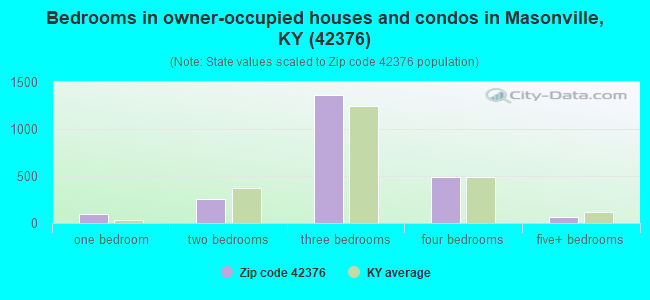
Median number of rooms in houses and condos:
Here:
6.0
State:
6.4
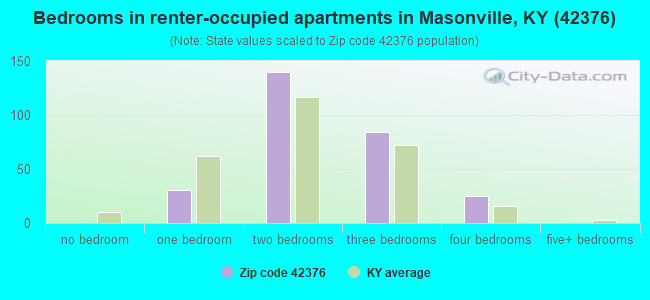
Median number of rooms in apartments:
Here:
5.5
State:
4.4
Notable locations in this zip code not listed on our city pages
Notable locations in zip code 42376: Daviess County Fire Department Masonville 2 (A), Daviess County Fire Department Masonville 1 (B), Daviess County Fire Department Utica (C). Display/hide their locations on the map
Churches in zip code 42376 include: Glenville Church (A), Greenbrier Church (B), Mount Carmel Church (C), Mount Pleasant Cumberland Presbyterian Church (D), Nickel Ridge Church (E), Red Hill Baptist Church (F), Sugar Grove Baptist Church (G), Bethlehem Church (H). Display/hide their locations on the map
Size of family households: 822 2-persons, 464 3-persons, 261 4-persons, 192 5-persons, 65 6-persons, 48 7-or-more-persons
Size of nonfamily households: 507 1-person, 109 2-persons, 50 3-persons
1,126 married couples with children.
403 single-parent households (139 men, 264 women).
98.9% of residents of 42376 zip code speak English at home.
0.1% of residents speak Spanish at home (44% well, 56% not well).
0.8% of residents speak other Indo-European language at home (100% well).
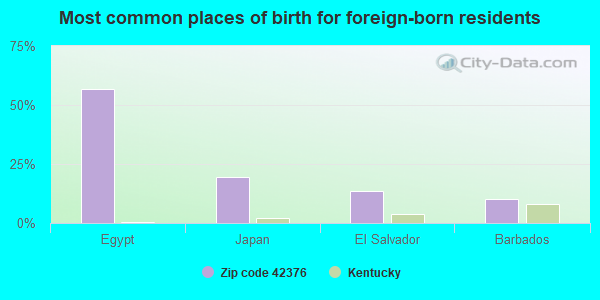
Foreign born population: 88 (1.4%) (89.4% of them are naturalized citizens)
This zip code:
1.4%
Whole state:
4.0%
57%Egypt
19%Japan
14%El Salvador
10%Barbados
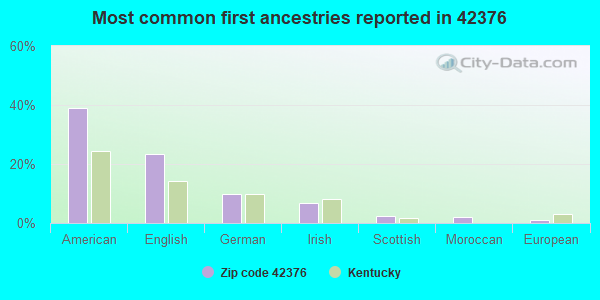
39%American
23%English
10%German
7%Irish
2%Scottish
2%Moroccan
1%European
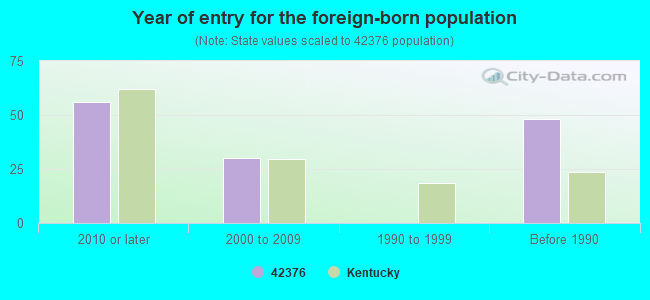
Year of entry for the foreign-born population
562010 or later
302000 to 2009
01990 to 1999
48Before 1990
Public elementary/middle school in in zip code 42376 not listed on the city page:
Facilities with environmental interests located in this zip code:
BARMET OF KENTUCKY INCORPORATED (HIGHWAY 431 SOUTH in UTICA, KY)
AIR MAJOR (AIRS/AFS) SUPERFUND (Superfund database) National Pollutant Discharge Elimination System NON-MAJOR (Tracking pollutant discharge elimination systems) - permit AIR MAJOR ("Best Available" air pollution technologies tracking) (Resource Conservation and Recovery Act (tracking hazardous waste)) TRI REPORTER (Tracking of toxic chemicals releasing facilities) Business SIC classification: SECONDARY SMELTING AND REFINING OF NONFERROUS METALS; GENERAL WAREHOUSING AND STORAGE Organizations: COMMONWEALTH ALUM CONCAST INC (CONTACT/OWNER)
, BARMET ALUMINUM CORP. (CONTACT/OWNER)
Alternative names: BARMET ALUMINUM CORP., BARMET ALUMINUM CORP., LIVIA DIV., BARMET OF KENTUCKY, INC., COMMONWEALTH ALUM CONCAST INC
BEACON CENTRAL ALTERNATIVE HIGH SCHOOL (6500 US HWY 231 in UTICA, KY)
(National Center for Education Statistics) - STATE ID-030145180 Organizations: DAVIESS COUNTY (SCHOOL DISTRICT)
LEBOLD LEASE (TOWER OIL COMPANY) (SR 1514 AND GIBSON MILL ROAD in UTICA, KY)
BEACON CENTRAL HIGH SCHOOL (6500 US 231 in UTICA, KY)
National Pollutant Discharge Elimination System NON-MAJOR (Tracking pollutant discharge elimination systems) - permit Business SIC classification: ELEMENTARY AND SECONDARY SCHOOLS
BROWNS VALLEY MHP (ST ANTHONY RD in UTICA, KY)
National Pollutant Discharge Elimination System NON-MAJOR (Tracking pollutant discharge elimination systems) - permit Business SIC classification: OPERATORS OF RESIDENTIAL MOBILE HOME SITES
OWENSBORO LANDFILL (1740 BURTON RD in UTICA, KY)
National Pollutant Discharge Elimination System NON-MAJOR (Tracking pollutant discharge elimination systems) - permit Business SIC classification: REFUSE SYSTEMS
PANTHER MOTORS & AUTO SALVAGE (4198 KY 554 in UTICA, KY)
National Pollutant Discharge Elimination System NON-MAJOR (Tracking pollutant discharge elimination systems) - permit Business SIC classification: MOTOR VEHICLE PARTS, USED
LASHBROOK LUMBER CO INC (6403 US 231 in UTICA, KY)
National Pollutant Discharge Elimination System NON-MAJOR (Tracking pollutant discharge elimination systems) - permit Business SIC classification: SAWMILLS AND PLANING MILLS, GENERAL
MARVIN'S MARKET #3 DBA UTICA FOOD MART (10615 US 431 in UTICA, KY)
COAL RECOVERY SYSTEM, INC. (ADJ. KY 151, 2 MILES WEST in UTICA, KY)
AIR MINOR (AIRS/AFS)
BROWNING-FERRIS INDUSTRIES OF KY INC. (2103 GRIMES AVENUE in OWENSBORO, KY)
Conditionally Exempt Small Quantity Generators, less than 100 kg/month of hazardous waste (Resource Conservation and Recovery Act (tracking hazardous waste)) - notification Organizations: BROWNING FERRIS INDUSTRIES OF KY INC. (CONTACT/OWNER)
CHARLIE STEELE, INC. (NO STREET ADDRESS in UTICA, KY)
AIR SYNTHETIC MINOR (AIRS/AFS) Business SIC classification: BITUMINOUS COAL UNDERGROUND MINING
Housing units lacking complete plumbing facilities: 0.3% Housing units lacking complete kitchen facilities: 0.3%
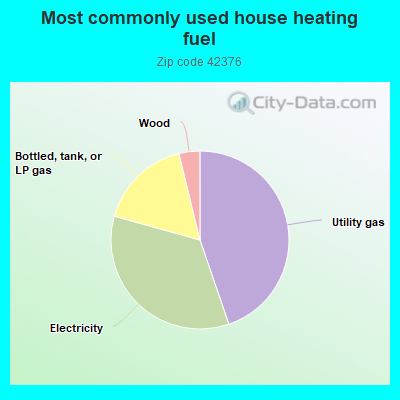
44.8%Utility gas
34.6%Electricity
16.9%Bottled, tank, or LP gas
3.8%Wood
Population in 1990: 4,800. Population change in the 1990s: +1,228 (+25.6%).
Place of birth for U.S.-born residents:
This state: 5,124
Northeast: 86
Midwest: 798
South: 195
West: 162
65% of the 42376 zip code residents lived in the same house 5 years ago. Out of people who lived in different houses, 56% lived in this county. Out of people who lived in different counties, 50% lived in Kentucky.
93% of the 42376 zip code residents lived in the same house 1 year ago. Out of people who lived in different houses, 21% moved from this county. Out of people who lived in different houses, 9% moved from different county within same state. Out of people who lived in different houses, 75% moved from different state. Out of people who lived in different houses, 3% moved from abroad.
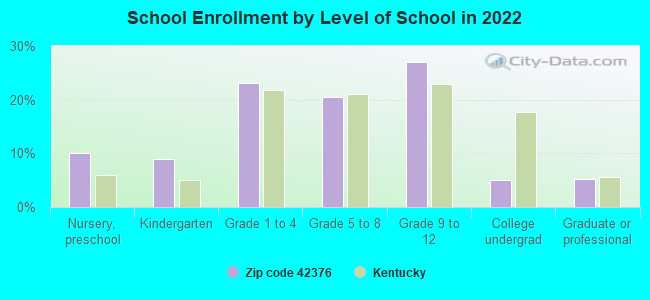
Private vs. public school enrollment:
Students in private schools in grades 1 to 8 (elementary and middle school): 73
Here:
10.5%
Kentucky:
17.2%
Students in private schools in grades 9 to 12 (high school): 45
Here:
10.4%
Kentucky:
15.2%
Students in private undergraduate colleges: 11
Here:
13.5%
Kentucky:
19.6%
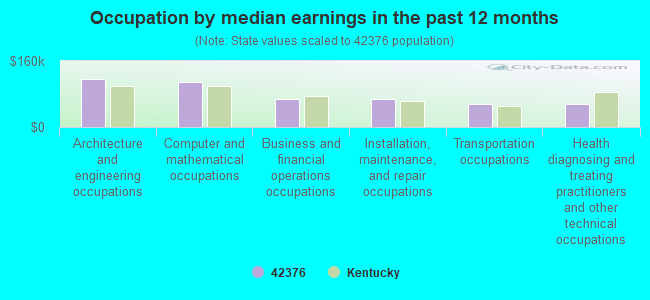
Occupation by median earnings in the past 12 months ($)
117,495Architecture and engineering occupations
108,236Computer and mathematical occupations
67,031Business and financial operations occupations
66,900Installation, maintenance, and repair occupations
56,318Transportation occupations
56,245Health diagnosing and treating practitioners and other technical occupations
Top industries in this zip code by the number of employees in 2005:
Other Services (except Public Administration): Religious Organizations (5-9 employees: 2 establishments, 1-4 employees: 6 establishments)
Construction: Masonry Contractors (10-19: 1)
Construction: Drywall and Insulation Contractors (5-9: 1, 1-4: 2)
Administrative and Support and Waste Management and Remediation Services: Landscaping Services (1-4: 5)
Construction: Site Preparation Contractors (1-4: 4)
People in group quarters in 2010:
6 people in workers' group living quarters and job corps centers
Fatal accident statistics in 2013:
Fatal accident count: 1
Vehicles involved in fatal accidents: 2
Fatal accidents caused by drunken drivers: 0
Fatalities: 1
Persons involved in fatal accidents: 2
Pedestrians involved in fatal accidents: 0
Fatal accident statistics in 2012:
Fatal accident count: 1
Vehicles involved in fatal accidents: 2
Fatal accidents caused by drunken drivers: 1
Fatalities: 1
Persons involved in fatal accidents: 2
Pedestrians involved in fatal accidents: 0
Home Mortgage Disclosure Act Aggregated Statistics For Year 2009 (Based on 2 partial tracts)
A) FHA, FSA/RHS & VA Home Purchase Loans
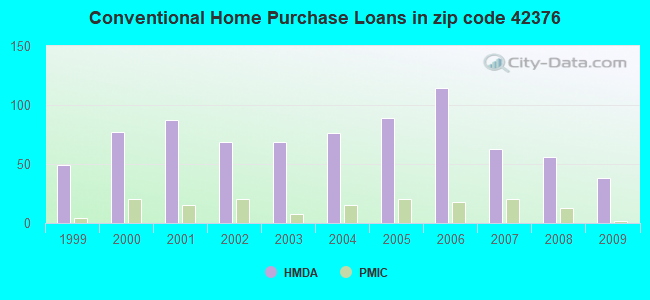
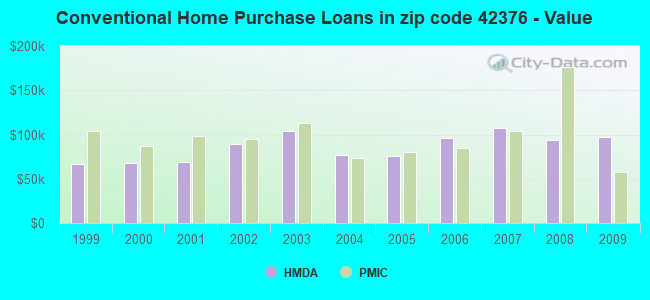
B) Conventional Home Purchase Loans
C) Refinancings
D) Home Improvement Loans
F) Non-occupant Loans on < 5 Family Dwellings (A B C & D)
G) Loans On Manufactured Home Dwelling (A B C & D)
Number
Average Value
Number
Average Value
Number
Average Value
Number
Average Value
Number
Average Value
Number
Average Value
LOANS ORIGINATED
15
$108,548
38
$96,625
147
$121,122
13
$29,918
5
$43,836
12
$42,298
APPLICATIONS APPROVED, NOT ACCEPTED
2
$131,840
5
$59,988
12
$96,820
0
$0
0
$0
5
$66,580
APPLICATIONS DENIED
0
$0
12
$71,138
58
$110,274
5
$4,284
3
$56,033
10
$57,186
APPLICATIONS WITHDRAWN
3
$143,377
3
$81,300
18
$125,065
3
$28,017
0
$0
3
$50,540
FILES CLOSED FOR INCOMPLETENESS
0
$0
2
$315,590
10
$130,851
0
$0
0
$0
0
$0
Aggregated Statistics For Year 2008 (Based on 2 partial tracts)
A) FHA, FSA/RHS & VA Home Purchase Loans
B) Conventional Home Purchase Loans
C) Refinancings
D) Home Improvement Loans
E) Loans on Dwellings For 5+ Families
F) Non-occupant Loans on < 5 Family Dwellings (A B C & D)
G) Loans On Manufactured Home Dwelling (A B C & D)
Number
Average Value
Number
Average Value
Number
Average Value
Number
Average Value
Number
Average Value
Number
Average Value
Number
Average Value
LOANS ORIGINATED
20
$119,727
56
$93,289
86
$92,556
21
$45,202
2
$148,320
21
$66,783
15
$58,009
APPLICATIONS APPROVED, NOT ACCEPTED
2
$34,610
7
$97,231
13
$71,498
3
$27,467
0
$0
0
$0
5
$61,964
APPLICATIONS DENIED
3
$77,457
18
$75,259
76
$76,936
13
$47,158
0
$0
7
$35,314
20
$39,882
APPLICATIONS WITHDRAWN
5
$106,132
3
$99,430
28
$118,479
0
$0
0
$0
0
$0
2
$61,800
FILES CLOSED FOR INCOMPLETENESS
2
$141,730
3
$129,093
2
$117,010
0
$0
0
$0
0
$0
0
$0
Aggregated Statistics For Year 2007 (Based on 2 partial tracts)
A) FHA, FSA/RHS & VA Home Purchase Loans
B) Conventional Home Purchase Loans
C) Refinancings
D) Home Improvement Loans
F) Non-occupant Loans on < 5 Family Dwellings (A B C & D)
G) Loans On Manufactured Home Dwelling (A B C & D)
Number
Average Value
Number
Average Value
Number
Average Value
Number
Average Value
Number
Average Value
Number
Average Value
LOANS ORIGINATED
10
$84,542
63
$107,408
84
$105,119
38
$37,687
13
$77,456
10
$67,403
APPLICATIONS APPROVED, NOT ACCEPTED
0
$0
5
$148,650
25
$87,674
5
$49,770
3
$97,780
3
$86,793
APPLICATIONS DENIED
3
$136,233
13
$89,372
74
$124,691
28
$36,904
3
$83,500
18
$94,028
APPLICATIONS WITHDRAWN
3
$115,360
7
$64,037
30
$160,790
0
$0
2
$32,960
0
$0
FILES CLOSED FOR INCOMPLETENESS
0
$0
2
$197,760
5
$175,348
0
$0
0
$0
0
$0
Aggregated Statistics For Year 2006 (Based on 2 partial tracts)
A) FHA, FSA/RHS & VA Home Purchase Loans
B) Conventional Home Purchase Loans
C) Refinancings
D) Home Improvement Loans
F) Non-occupant Loans on < 5 Family Dwellings (A B C & D)
G) Loans On Manufactured Home Dwelling (A B C & D)
Number
Average Value
Number
Average Value
Number
Average Value
Number
Average Value
Number
Average Value
Number
Average Value
LOANS ORIGINATED
3
$115,360
114
$96,119
119
$85,017
23
$25,723
38
$62,581
31
$48,217
APPLICATIONS APPROVED, NOT ACCEPTED
0
$0
13
$55,778
18
$52,919
5
$25,380
2
$58,505
2
$58,505
APPLICATIONS DENIED
0
$0
28
$89,816
86
$93,323
18
$25,361
7
$45,437
16
$69,010
APPLICATIONS WITHDRAWN
3
$108,767
12
$85,284
26
$111,937
0
$0
0
$0
3
$85,147
FILES CLOSED FOR INCOMPLETENESS
2
$63,450
2
$44,495
7
$119,127
0
$0
0
$0
0
$0
Aggregated Statistics For Year 2005 (Based on 2 partial tracts)
A) FHA, FSA/RHS & VA Home Purchase Loans
B) Conventional Home Purchase Loans
C) Refinancings
D) Home Improvement Loans
F) Non-occupant Loans on < 5 Family Dwellings (A B C & D)
G) Loans On Manufactured Home Dwelling (A B C & D)
Number
Average Value
Number
Average Value
Number
Average Value
Number
Average Value
Number
Average Value
Number
Average Value
LOANS ORIGINATED
10
$75,973
89
$75,789
125
$93,699
21
$36,020
12
$58,916
16
$57,989
APPLICATIONS APPROVED, NOT ACCEPTED
0
$0
16
$74,263
20
$58,257
0
$0
2
$62,625
8
$49,852
APPLICATIONS DENIED
3
$81,850
41
$64,473
102
$94,372
15
$29,884
5
$59,328
25
$56,164
APPLICATIONS WITHDRAWN
3
$121,403
10
$190,179
43
$122,719
5
$89,980
0
$0
5
$104,484
FILES CLOSED FOR INCOMPLETENESS
0
$0
3
$123,050
12
$137,608
2
$41,200
0
$0
0
$0
Aggregated Statistics For Year 2004 (Based on 2 partial tracts)
A) FHA, FSA/RHS & VA Home Purchase Loans
B) Conventional Home Purchase Loans
C) Refinancings
D) Home Improvement Loans
F) Non-occupant Loans on < 5 Family Dwellings (A B C & D)
G) Loans On Manufactured Home Dwelling (A B C & D)
Number
Average Value
Number
Average Value
Number
Average Value
Number
Average Value
Number
Average Value
Number
Average Value
LOANS ORIGINATED
12
$74,984
76
$77,001
153
$79,104
30
$22,413
15
$76,577
25
$52,011
APPLICATIONS APPROVED, NOT ACCEPTED
2
$76,630
10
$67,074
25
$67,436
2
$55,210
0
$0
16
$66,950
APPLICATIONS DENIED
0
$0
21
$44,967
97
$75,859
10
$33,949
5
$44,826
36
$58,870
APPLICATIONS WITHDRAWN
2
$74,160
10
$108,109
64
$91,953
3
$27,467
0
$0
2
$65,095
FILES CLOSED FOR INCOMPLETENESS
0
$0
2
$159,855
5
$113,382
0
$0
0
$0
0
$0
Aggregated Statistics For Year 2003 (Based on 2 partial tracts)
A) FHA, FSA/RHS & VA Home Purchase Loans
B) Conventional Home Purchase Loans
C) Refinancings
D) Home Improvement Loans
F) Non-occupant Loans on < 5 Family Dwellings (A B C & D)
Number
Average Value
Number
Average Value
Number
Average Value
Number
Average Value
Number
Average Value
LOANS ORIGINATED
8
$100,116
69
$103,537
331
$86,229
38
$22,812
18
$58,870
APPLICATIONS APPROVED, NOT ACCEPTED
2
$62,625
18
$75,350
61
$71,783
5
$19,776
0
$0
APPLICATIONS DENIED
3
$96,133
46
$65,454
140
$80,952
31
$20,839
5
$36,916
APPLICATIONS WITHDRAWN
0
$0
13
$59,708
69
$74,518
3
$65,920
2
$29,665
FILES CLOSED FOR INCOMPLETENESS
0
$0
3
$107,670
7
$64,507
3
$30,213
0
$0
Aggregated Statistics For Year 2002 (Based on 2 partial tracts)
A) FHA, FSA/RHS & VA Home Purchase Loans
B) Conventional Home Purchase Loans
C) Refinancings
D) Home Improvement Loans
F) Non-occupant Loans on < 5 Family Dwellings (A B C & D)
Number
Average Value
Number
Average Value
Number
Average Value
Number
Average Value
Number
Average Value
LOANS ORIGINATED
15
$97,232
69
$89,541
231
$85,639
26
$24,783
10
$36,750
APPLICATIONS APPROVED, NOT ACCEPTED
2
$79,105
15
$44,935
44
$85,022
7
$35,786
0
$0
APPLICATIONS DENIED
2
$26,370
30
$58,229
82
$64,533
12
$18,402
5
$70,864
APPLICATIONS WITHDRAWN
2
$74,985
5
$42,518
36
$66,836
2
$5,770
0
$0
FILES CLOSED FOR INCOMPLETENESS
0
$0
5
$88,004
13
$65,159
2
$32,960
0
$0
Aggregated Statistics For Year 2001 (Based on 2 partial tracts)
A) FHA, FSA/RHS & VA Home Purchase Loans
B) Conventional Home Purchase Loans
C) Refinancings
D) Home Improvement Loans
F) Non-occupant Loans on < 5 Family Dwellings (A B C & D)
Number
Average Value
Number
Average Value
Number
Average Value
Number
Average Value
Number
Average Value
LOANS ORIGINATED
10
$84,542
87
$69,159
265
$76,784
16
$44,084
7
$57,916
APPLICATIONS APPROVED, NOT ACCEPTED
0
$0
13
$75,808
44
$75,021
5
$15,162
0
$0
APPLICATIONS DENIED
2
$64,270
61
$81,833
110
$68,587
30
$14,557
0
$0
APPLICATIONS WITHDRAWN
0
$0
10
$59,163
59
$88,629
0
$0
0
$0
FILES CLOSED FOR INCOMPLETENESS
0
$0
0
$0
5
$94,924
0
$0
0
$0
Aggregated Statistics For Year 2000 (Based on 2 partial tracts)
A) FHA, FSA/RHS & VA Home Purchase Loans
B) Conventional Home Purchase Loans
C) Refinancings
D) Home Improvement Loans
F) Non-occupant Loans on < 5 Family Dwellings (A B C & D)
Number
Average Value
Number
Average Value
Number
Average Value
Number
Average Value
Number
Average Value
LOANS ORIGINATED
2
$43,670
77
$67,632
120
$59,410
28
$13,772
15
$37,465
APPLICATIONS APPROVED, NOT ACCEPTED
0
$0
31
$57,893
40
$60,193
12
$24,033
0
$0
APPLICATIONS DENIED
2
$60,150
101
$46,030
82
$49,480
35
$24,014
12
$28,153
APPLICATIONS WITHDRAWN
3
$94,487
12
$62,075
36
$65,828
0
$0
0
$0
FILES CLOSED FOR INCOMPLETENESS
0
$0
2
$78,280
8
$66,332
0
$0
0
$0
Aggregated Statistics For Year 1999 (Based on 1 partial tract)
A) FHA, FSA/RHS & VA Home Purchase Loans
B) Conventional Home Purchase Loans
C) Refinancings
D) Home Improvement Loans
F) Non-occupant Loans on < 5 Family Dwellings (A B C & D)
Detailed PMIC statistics for the following Tracts:0017.03
2002 - 2018 National Fire Incident Reporting System (NFIRS) incidents
According to the data from the years 2002 - 2018 the average number of fire incidents per year is 34. The highest number of reported fires - 51 took place in 2018, and the least - 15 in 2016. The data has a rising trend.
When looking into fire subcategories, the most incidents belonged to: Outside Fires (42.6%), and Structure Fires (39.6%).
Fire incident types reported to NFIRS in Zip Code 42376


 Nearest zip codes: 42352, 42303, 42366, 42350, 42328, 42301.
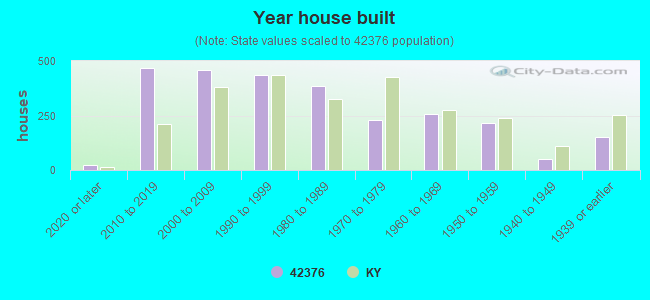


 (Students: 613, Location: 7525 U.S. HIGHWAY 431, Grades: PK-5)
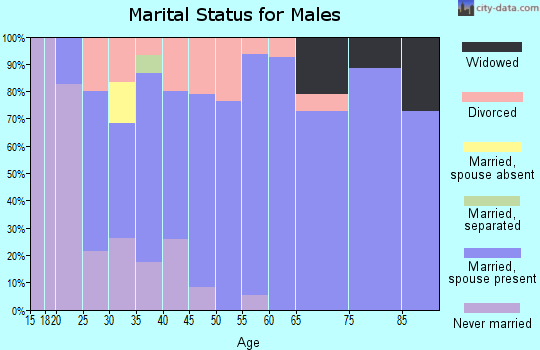
 According to the data from the years 2002 - 2018 the average number of fire incidents per year is 34. The highest number of reported fires - 51 took place in 2018, and the least - 15 in 2016. The data has a rising trend.
 When looking into fire subcategories, the most incidents belonged to: Outside Fires (42.6%), and Structure Fires (39.6%).