Estimated zip code population in 2022: 3,624 Zip code population in 2010: 4,161 Zip code population in 2000: 3,257
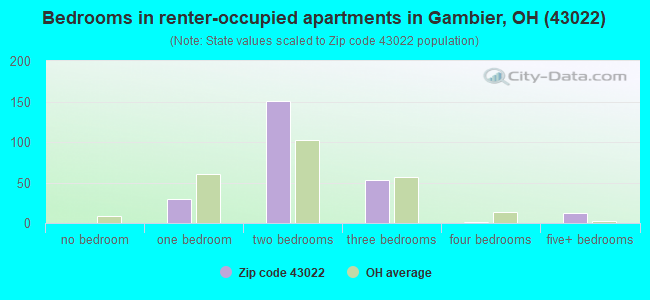
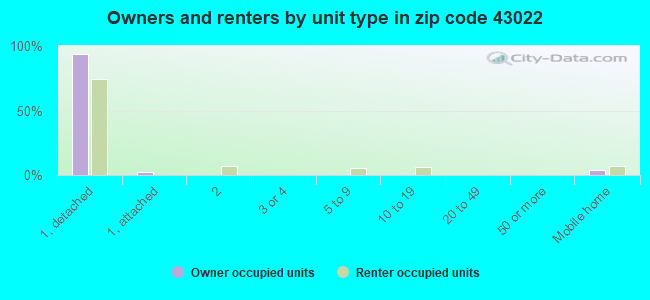
Houses and condos: 904 Renter-occupied apartments: 246
% of renters here:
29%
State:
33%
March 2022 cost of living index in zip code 43022: 80.4 (low, U.S. average is 100)
Land area: 41.3 sq. mi. Water area: 0.3 sq. mi.
Population density: 88 people per square mile
(very low).
OSM Map
General Map
Google Map
MSN Map
OSM Map
General Map
Google Map
MSN Map
OSM Map
General Map
Google Map
MSN Map
OSM Map
General Map
Google Map
MSN Map
Please wait while loading the map...
Real estate property taxes paid for housing units in 2022:
This zip code:
1.2% ($3,519)
Ohio:
1.3% ($2,639)
Median real estate property taxes paid for housing units with mortgages in 2022: $3,344 (1.2%) Median real estate property taxes paid for housing units with no mortgage in 2022: $3,739 (1.2%)
Business Search- 14 Million verified businesses
Males: 1,698
(46.9%)
Females: 1,925
(53.1%)
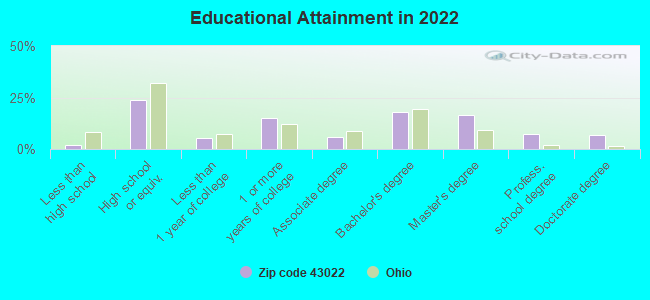
For population 25 years and over in 43022:
High school or higher: 99.2%
Bachelor's degree or higher: 48.9%
Graduate or professional degree: 30.8%
Unemployed: 1.4%
Mean travel time to work (commute): 18.9 minutes
For population 15 years and over in 43022:
Never married: 60.9%
Now married: 34.5%
Separated: 0.4%
Widowed: 1.4%
Divorced: 2.8%
Zip code 43022 compared to state average:
Unemployed percentage below state average.
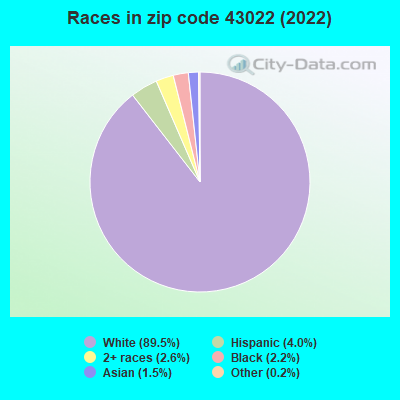
Black race population percentage significantly below state average.
Median age significantly below state average.
Length of stay since moving in significantly above state average.
Number of college students significantly above state average.
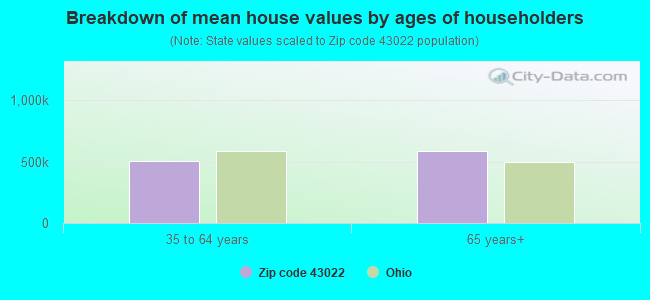
Estimated median house/condo value in 2022: $302,977
43022:
$302,977
Ohio:
$204,100
According to our research of Ohio and other state lists, there were 4 registered sex offenders living in 43022 zip code as of April 27, 2024. The ratio of all residents to sex offenders in zip code 43022 is 1,123 to 1. The ratio of registered sex offenders to all residents in this zip code is lower than the state average.
Median resident age:
This zip code:
22.0 years
Ohio median age:
39.9 years
Average household size:
This zip code:
2.4 people
Ohio:
2.4 people
Averages for the 2020 tax year for zip code 43022, filed in 2021:
Average Adjusted Gross Income (AGI) in 2020: $72,771 (Individual Income Tax Returns)
Here:
$72,771
State:
$67,288
Salary/wage: $60,734 (reported on 75.0% of returns)
Here:
$60,734
State:
$55,628
(% of AGI for various income ranges: 1275.6% for AGIs below $25k, 3901.8% for AGIs $25k-50k, 6690.8% for AGIs $50k-75k, 10442.5% for AGIs $75k-100k, 15782.7% for AGIs $100k-200k)
Taxable interest for individuals: $1,141 (reported on 37.9% of returns)
This zip code:
$1,141
Ohio:
$1,518
(% of AGI for various income ranges: 21.1% for AGIs below $25k, 57.1% for AGIs $25k-50k, 52.5% for AGIs $50k-75k, 91.2% for AGIs $75k-100k, 147.3% for AGIs $100k-200k)
Ordinary dividends: $11,676 (reported on 28.4% of returns)
Here:
$11,676
State:
$7,167
(% of AGI for various income ranges: 29.4% for AGIs below $25k, 78.2% for AGIs $25k-50k, 206.7% for AGIs $50k-75k, 340.0% for AGIs $75k-100k, 490.0% for AGIs $100k-200k)
Net capital gain/loss in AGI: +$13,203 (reported on 25.0% of returns)
Here:
+$13,203
State:
+$18,919
(% of AGI for various income ranges: 22.2% for AGIs below $25k, 48.8% for AGIs $25k-50k, 185.8% for AGIs $50k-75k, 351.2% for AGIs $75k-100k, 1098.2% for AGIs $100k-200k)
Profit/loss from business: +$14,525 (reported on 24.1% of returns)
Here:
+$14,525
State:
+$13,744
(% of AGI for various income ranges: 237.8% for AGIs below $25k, 512.4% for AGIs $25k-50k, 374.2% for AGIs $50k-75k, 1027.5% for AGIs $75k-100k, 1360.9% for AGIs $100k-200k)
Taxable individual retirement arrangement distribution: $15,950 (reported on 12.1% of returns)
43022:
$15,950
Ohio:
$18,876
(% of AGI for various income ranges: 97.8% for AGIs below $25k, 162.4% for AGIs $25k-50k, 304.2% for AGIs $50k-75k, 632.5% for AGIs $75k-100k, 827.3% for AGIs $100k-200k)
Total itemized deductions: $38,025 (reported on 6.9% of returns)
Here:
$38,025
State:
$33,869
(% of AGI for various income ranges: 644.2% for AGIs $50k-75k, 2062.7% for AGIs $100k-200k)
Charity contributions: $22,357 (reported on 6.0% of returns)
Here:
$22,357
State:
$14,577
(% of AGI for various income ranges: 62.4% for AGIs $25k-50k, 1326.4% for AGIs $100k-200k)
Taxes paid: $6,988 (reported on 6.9% of returns)
43022:
$6,988
State:
$7,681
(% of AGI for various income ranges: 136.7% for AGIs $50k-75k, 359.1% for AGIs $100k-200k)
Earned income credit: $2,050 (reported on 8.6% of returns)
Here:
$2,050
State:
$2,304
(% of AGI for various income ranges: 53.9% for AGIs below $25k, 63.5% for AGIs $25k-50k)
Percentage of individuals using paid preparers for their 2020 taxes: 91.4%
Here:
91%
State:
94%
(% for various income ranges: 90.0% for AGIs below $25k, 92.3% for AGIs $25k-50k, 89.5% for AGIs $50k-75k, 93.3% for AGIs $75k-100k, 95.0% for AGIs $100k-200k, 83.3% for AGIs over 200k)
Averages for the 2012 tax year for zip code 43022, filed in 2013:
Average Adjusted Gross Income (AGI) in 2012: $62,217 (Individual Income Tax Returns)
Here:
$62,217
State:
$54,926
Salary/wage: $46,951 (reported on 77.8% of returns)
Here:
$46,951
State:
$45,869
(% of AGI for various income ranges: 66.6% for AGIs below $25k, 71.8% for AGIs $25k-50k, 72.7% for AGIs $50k-75k, 63.4% for AGIs $75k-100k, 64.5% for AGIs $100k-200k, 33.2% for AGIs over 200k)
Taxable interest for individuals: $1,565 (reported on 36.8% of returns)
This zip code:
$1,565
Ohio:
$1,297
(% of AGI for various income ranges: 1.1% for AGIs below $25k, 1.3% for AGIs $25k-50k, 0.8% for AGIs $50k-75k, 1.1% for AGIs $75k-100k, 0.6% for AGIs $100k-200k, 0.9% for AGIs over 200k)
Ordinary dividends: $11,567 (reported on 28.2% of returns)
Here:
$11,567
State:
$5,821
(% of AGI for various income ranges: 1.8% for AGIs below $25k, 1.5% for AGIs $25k-50k, 1.8% for AGIs $50k-75k, 2.1% for AGIs $75k-100k, 4.0% for AGIs $100k-200k, 13.1% for AGIs over 200k)
Net capital gain/loss in AGI: +$22,481 (reported on 23.1% of returns)
Here:
+$22,481
State:
+$11,232
(% of AGI for various income ranges: 0.3% for AGIs $25k-50k, 0.7% for AGIs $50k-75k, 0.9% for AGIs $75k-100k, 3.4% for AGIs $100k-200k, 28.1% for AGIs over 200k)
Profit/loss from business: +$13,010 (reported on 25.6% of returns)
Here:
+$13,010
State:
+$12,773
(% of AGI for various income ranges: 17.8% for AGIs below $25k, 6.9% for AGIs $25k-50k, 3.3% for AGIs $50k-75k, 5.1% for AGIs $75k-100k, 8.5% for AGIs $100k-200k)
Taxable individual retirement arrangement distribution: $12,679 (reported on 12.0% of returns)
43022:
$12,679
Ohio:
$14,511
(% of AGI for various income ranges: 4.0% for AGIs below $25k, 2.4% for AGIs $25k-50k, 2.6% for AGIs $50k-75k, 2.8% for AGIs $75k-100k, 4.3% for AGIs $100k-200k)
Total itemized deductions: $23,619 (20% of AGI, reported on 31.6% of returns)
Here:
$23,619
State:
$21,278
Here:
19.5% of AGI
State:
18.8% of AGI
(% of AGI for various income ranges: 12.7% for AGIs below $25k, 8.3% for AGIs $25k-50k, 11.5% for AGIs $50k-75k, 12.6% for AGIs $75k-100k, 12.1% for AGIs $100k-200k, 13.7% for AGIs over 200k)
Charity contributions: $4,542 (reported on 26.5% of returns)
Here:
$4,542
State:
$3,943
(% of AGI for various income ranges: 1.4% for AGIs $25k-50k, 1.4% for AGIs $50k-75k, 2.4% for AGIs $75k-100k, 2.9% for AGIs $100k-200k, 1.8% for AGIs over 200k)
Taxes paid: $9,227 (reported on 31.6% of returns)
43022:
$9,227
State:
$9,568
(% of AGI for various income ranges: 1.9% for AGIs below $25k, 2.0% for AGIs $25k-50k, 3.2% for AGIs $50k-75k, 4.3% for AGIs $75k-100k, 5.3% for AGIs $100k-200k, 7.3% for AGIs over 200k)
Earned income credit: $1,869 (reported on 11.1% of returns)
Here:
$1,869
State:
$2,285
(% of AGI for various income ranges: 4.1% for AGIs below $25k, 0.7% for AGIs $25k-50k)
Percentage of individuals using paid preparers for their 2012 taxes: 59.0%
Here:
59%
State:
51%
(% for various income ranges: 50.0% for AGIs below $25k, 55.2% for AGIs $25k-50k, 66.7% for AGIs $50k-75k, 66.7% for AGIs $75k-100k, 71.4% for AGIs $100k-200k, 75.0% for AGIs over 200k)
Averages for the 2004 tax year for zip code 43022, filed in 2005:
Average Adjusted Gross Income (AGI) in 2004: $50,226 (Individual Income Tax Returns)
Here:
$50,226
State:
$44,480
Salary/wage: $37,549 (reported on 80.6% of returns)
Here:
$37,549
State:
$39,198
(% of AGI for various income ranges: 93.3% for AGIs below $10k, 61.3% for AGIs $10k-25k, 79.9% for AGIs $25k-50k, 72.2% for AGIs $50k-75k, 74.5% for AGIs $75k-100k, 37.1% for AGIs over 100k)
Taxable interest for individuals: $1,814 (reported on 54.4% of returns)
This zip code:
$1,814
Ohio:
$1,532
(% of AGI for various income ranges: 5.9% for AGIs below $10k, 2.6% for AGIs $10k-25k, 0.9% for AGIs $25k-50k, 2.7% for AGIs $50k-75k, 2.0% for AGIs $75k-100k, 1.9% for AGIs over 100k)
Taxable dividends: $4,901 (reported on 31.5% of returns)
Here:
$4,901
State:
$3,496
(% of AGI for various income ranges: 4.5% for AGIs below $10k, 1.9% for AGIs $10k-25k, 1.1% for AGIs $25k-50k, 1.5% for AGIs $50k-75k, 2.5% for AGIs $75k-100k, 5.3% for AGIs over 100k)
Net capital gain/loss: +$11,182 (reported on 23.7% of returns)
Here:
+$11,182
State:
+$8,582
(% of AGI for various income ranges: -2.8% for AGIs below $10k, 2.1% for AGIs $10k-25k, 1.5% for AGIs $25k-50k, 1.6% for AGIs $50k-75k, 5.2% for AGIs $75k-100k, 10.1% for AGIs over 100k)
Profit/loss from business: +$10,017 (reported on 25.0% of returns)
Here:
+$10,017
State:
+$10,813
(% of AGI for various income ranges: 17.7% for AGIs below $10k, 15.4% for AGIs $10k-25k, 7.2% for AGIs $25k-50k, 3.9% for AGIs $50k-75k, 0.5% for AGIs $75k-100k, 3.7% for AGIs over 100k)
IRA payment deduction: $3,889 (reported on 2.3% of returns)
43022:
$3,889
Ohio:
$2,794
Self-employed pension: $6,615 (reported on 1.1% of returns)
Here:
$6,615
Ohio:
$13,981
Total itemized deductions: $17,358 (20% of AGI, reported on 36.7% of returns)
Here:
$17,358
State:
$17,503
Here:
19.5% of AGI
State:
20.8% of AGI
(% of AGI for various income ranges: 11.5% for AGIs below $10k, 12.9% for AGIs $10k-25k, 10.1% for AGIs $25k-50k, 14.0% for AGIs $50k-75k, 16.0% for AGIs $75k-100k, 12.1% for AGIs over 100k)
Charity contributions deductions: $5,169 (5% of AGI, reported on 28.6% of returns)
Here:
$5,169
State:
$3,087
Here:
5.1% of AGI
State:
3.4% of AGI
(% of AGI for various income ranges: 1.4% for AGIs $10k-25k, 1.3% for AGIs $25k-50k, 2.3% for AGIs $50k-75k, 2.7% for AGIs $75k-100k, 4.6% for AGIs over 100k)
Total tax: $6,227 (reported on 76.2% of returns)
43022:
$6,227
State:
$6,781
(% of AGI for various income ranges: 3.7% for AGIs below $10k, 5.7% for AGIs $10k-25k, 7.3% for AGIs $25k-50k, 8.8% for AGIs $50k-75k, 10.1% for AGIs $75k-100k, 11.6% for AGIs over 100k)
Earned income credit: $1,574 (reported on 9.3% of returns)
Here:
$1,574
State:
$1,696
Percentage of individuals using paid preparers for their 2004 taxes: 56.9%
Here:
57%
State:
55%
(% for various income ranges: 40.2% for AGIs below $10k, 52.3% for AGIs $10k-25k, 59.5% for AGIs $25k-50k, 68.6% for AGIs $50k-75k, 54.7% for AGIs $75k-100k, 82.6% for AGIs over 100k)
Likely homosexual households (counted as self-reported same-sex unmarried-partner households)
Lesbian couples: 0.0% of all households
Gay men: 0.5% of all households
Household received Food Stamps/SNAP in the past 12 months: 50 Household did not receive Food Stamps/SNAP in the past 12 months: 787
Women who had a birth in the past 12 months: 34 (35 now married, 0 unmarried) Women who did not have a birth in the past 12 months: 1,226 (213 now married, 1,013 unmarried)
Housing units in zip code 43022 with a mortgage: 273 (77 second mortgage, 5 home equity loan, 73 both second mortgage and home equity loan) Median monthly owner costs for units with a mortgage: $1,952 Median monthly owner costs for units without a mortgage: $587
Residents with income below the poverty level in 2022:
This zip code:
11.9%
Whole state:
13.4%
Residents with income below 50% of the poverty level in 2022:
This zip code:
9.9%
Whole state:
7.0%
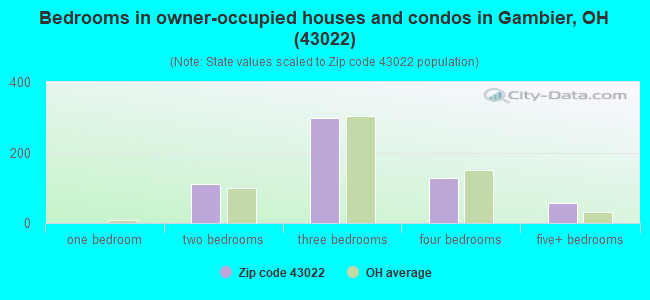
Median number of rooms in houses and condos:
Here:
7.0
State:
6.7
Median number of rooms in apartments:
Here:
5.0
State:
4.4
Notable locations in this zip code not listed on our city pages
Notable locations in zip code 43022: Lepley Farms (A), Wild Side Farms (B), Hamilton Farm (C), Clutter Farms (D), Serendipity Farm and Stable (E), Shennadoah Farm (F), College Township Fire Department Station 1 (G), Gambier Town Hall (H), Wing Center (I), Wertheimer Fieldhouse (J), Weaver Cottage (K), Watson Hall (L), Walton House (M), Tomsich Hall (N), Timberlake House (O), Sunset Cottage (P), Storer Hall (Q), Stephens Hall (R), Snowden Multicultural Center (S), Shaffer Speech Building (T). Display/hide their locations on the map
Churches in zip code 43022 include: Grove Church (A), Stone Quarry Chapel (B), Episcopal Church of the Holy Spirit (C), Epworth Methodist Church (D). Display/hide their locations on the map
Cemeteries: Bethel Cemetery (1), Kemmerer Cemetery (2), Grove Cemetery (3), Kenyon Cemetery (4), Stone Quarry Chapel Cemetery (5), Mount Zion Cemetery (6), Oak Grove Cemetery (7). Display/hide their locations on the map
Streams, rivers, and creeks: Tomaky Branch (A), Big Run (B), Elliott Run (C), Indianfield Run (D), Wolf Run (E), Ransoms Run (F). Display/hide their locations on the map
In group quarters: 1,529 (-1 institutionalized population)
Size of family households: 319 2-persons, 177 3-persons, 42 4-persons, 41 7-or-more-persons
Size of nonfamily households: 216 1-person, 32 2-persons, 10 3-persons
424 married couples with children.
6 single-parent households (6 men).
92.4% of residents of 43022 zip code speak English at home.
2.4% of residents speak Spanish at home (100% very well).
4.5% of residents speak other Indo-European language at home (67% very well, 33% well).
0.2% of residents speak Asian or Pacific Island language at home (100% very well).
0.1% of residents speak other language at home (100% very well).
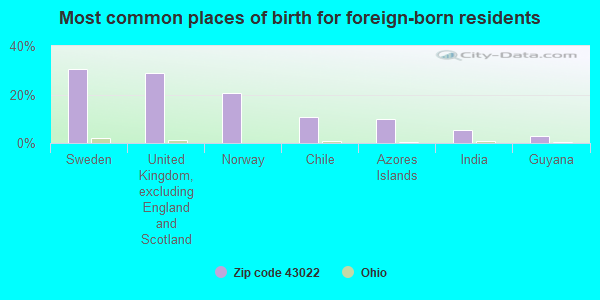
Foreign born population: 130 (3.6%) (11.9% of them are naturalized citizens)
This zip code:
3.6%
Whole state:
5.0%
31%Sweden
29%United Kingdom, excluding England and Scotland
21%Norway
11%Chile
10%Azores Islands
5%India
3%Guyana
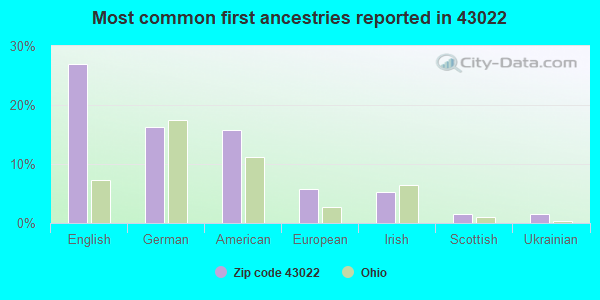
27%English
16%German
16%American
6%European
5%Irish
2%Scottish
2%Ukrainian
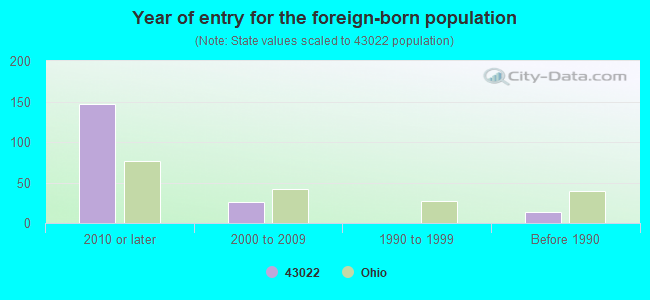
Year of entry for the foreign-born population
1472010 or later
262000 to 2009
01990 to 1999
13Before 1990
Housing units lacking complete plumbing facilities: 7.7% Housing units lacking complete kitchen facilities: 6.7%
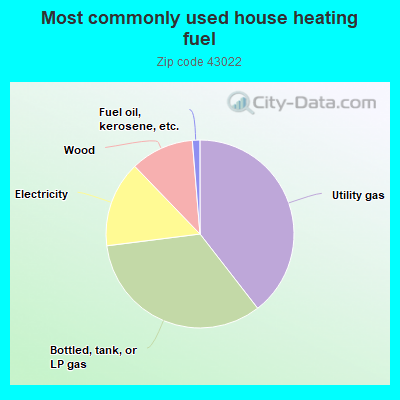
39.5%Utility gas
33.5%Bottled, tank, or LP gas
14.8%Electricity
10.9%Wood
1.3%Fuel oil, kerosene, etc.
Population in 1990: 3,903.
Place of birth for U.S.-born residents:
This state: 1,977
Northeast: 358
Midwest: 515
South: 335
West: 268
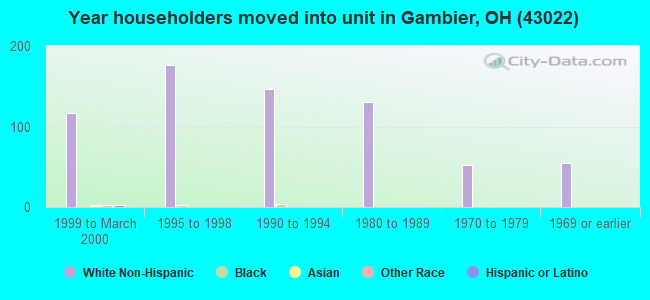
40% of the 43022 zip code residents lived in the same house 5 years ago. Out of people who lived in different houses, 19% lived in this county. Out of people who lived in different counties, 50% lived in Ohio.
78% of the 43022 zip code residents lived in the same house 1 year ago. Out of people who lived in different houses, 72% moved from this county. Out of people who lived in different houses, 10% moved from different county within same state. Out of people who lived in different houses, 9% moved from different state.
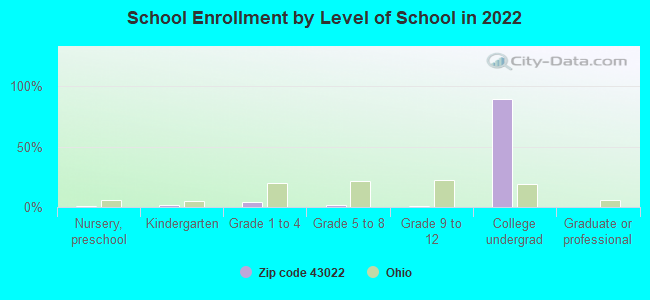
Private vs. public school enrollment:
Students in private schools in grades 1 to 8 (elementary and middle school): 18
Here:
16.1%
Ohio:
16.0%
Students in private schools in grades 9 to 12 (high school):
Here:
0.0%
Ohio:
13.1%
Students in private undergraduate colleges: 1,474
Here:
95.1%
Ohio:
22.3%
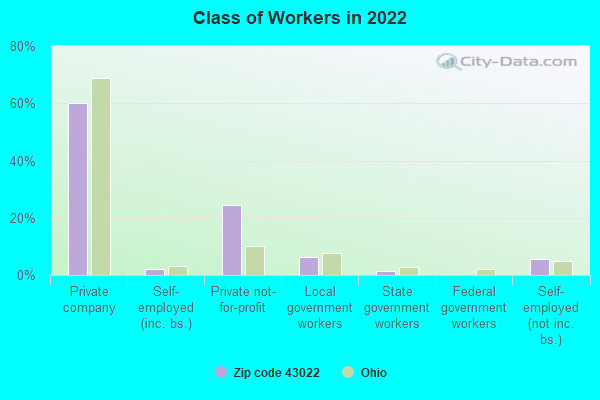
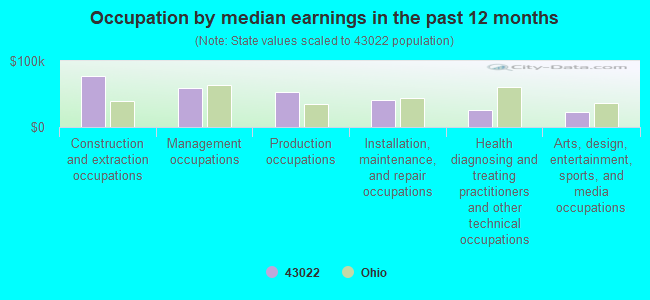
Occupation by median earnings in the past 12 months ($)
76,591Construction and extraction occupations
59,213Management occupations
52,733Production occupations
41,129Installation, maintenance, and repair occupations
25,924Health diagnosing and treating practitioners and other technical occupations
22,929Arts, design, entertainment, sports, and media occupations
Top industries in this zip code by the number of employees in 2005:
Educational Services: Colleges, Universities, and Professional Schools (over 1000 employees: 1 establishment)
Accommodation and Food Services: Food Service Contractors (100-249: 1)
Accommodation and Food Services: Hotels (except Casino Hotels) and Motels (20-49: 1)
Health Care and Social Assistance: Residential Mental Retardation Facilities (20-49: 1)
Mining: Construction Sand and Gravel Mining (20-49: 1)
Finance and Insurance: Commercial Banking (10-19: 1)
Accommodation and Food Services: Full-Service Restaurants (10-19: 1)
Accommodation and Food Services: Snack and Nonalcoholic Beverage Bars (10-19: 1)
Other Services (except Public Administration): Commercial and Industrial Machinery and Equipment (except Automotive and Electronic) Repair and Maintenance (5-9: 1)
Administrative and Support and Waste Management and Remediation Services: Security Guards and Patrol Services (5-9: 1)
People in group quarters in 2010:
1,570 people in college/university student housing
People in group quarters in 2000:
1,308 people in college dormitories (includes college quarters off campus)
7 people in homes for the mentally retarded
2 people in other group homes
Fatal accident statistics in 2014:
Fatal accident count: 1
Vehicles involved in fatal accidents: 1
Fatal accidents caused by drunken drivers: 1
Fatalities: 1
Persons involved in fatal accidents: 1
Pedestrians involved in fatal accidents: 0
Fatal accident statistics in 2011:
Fatal accident count: 1
Vehicles involved in fatal accidents: 2
Fatal accidents caused by drunken drivers: 0
Fatalities: 1
Persons involved in fatal accidents: 2
Pedestrians involved in fatal accidents: 0
2002 - 2018 National Fire Incident Reporting System (NFIRS) incidents
According to the data from the years 2002 - 2018 the average number of fires per year is 17. The highest number of reported fires - 39 took place in 2007, and the least - 3 in 2005. The data has a declining trend.
When looking into fire subcategories, the most reports belonged to: Structure Fires (44.9%), and Outside Fires (40.4%).
Fire incident types reported to NFIRS in Zip Code 43022

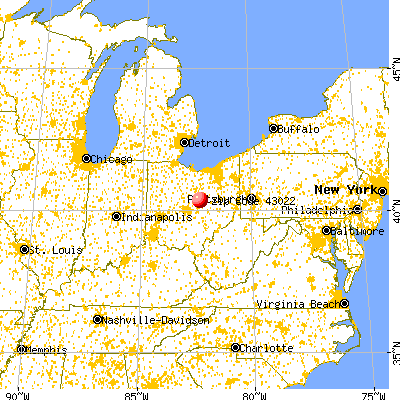


 Nearest zip codes: 43037, 43028, 43005, 43080, 43014, 43050.
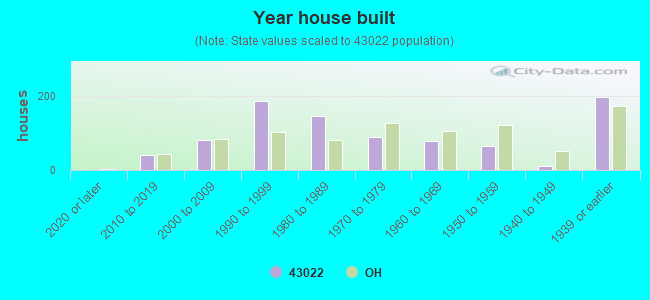


 According to the data from the years 2002 - 2018 the average number of fires per year is 17. The highest number of reported fires - 39 took place in 2007, and the least - 3 in 2005. The data has a declining trend.
 When looking into fire subcategories, the most reports belonged to: Structure Fires (44.9%), and Outside Fires (40.4%).