Estimated zip code population in 2022: 33,142 Zip code population in 2010: 29,946 Zip code population in 2000: 17,786
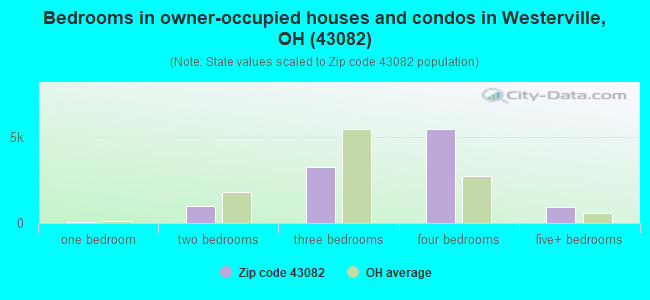
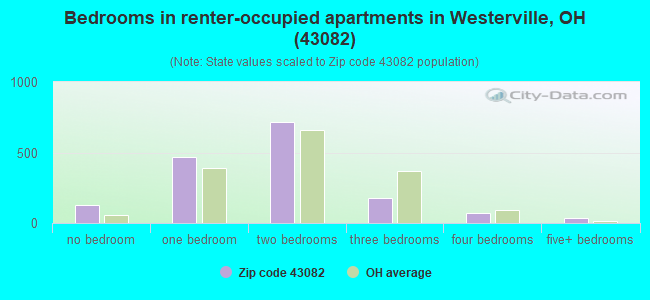
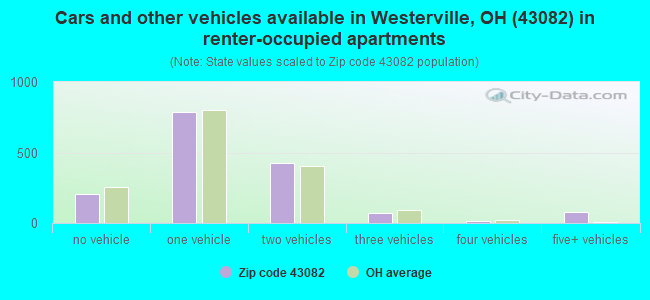
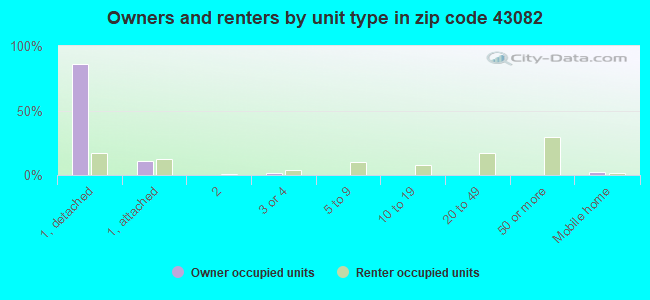
Houses and condos: 12,795 Renter-occupied apartments: 1,580
% of renters here:
13%
State:
33%
March 2022 cost of living index in zip code 43082: 96.9 (near average, U.S. average is 100)
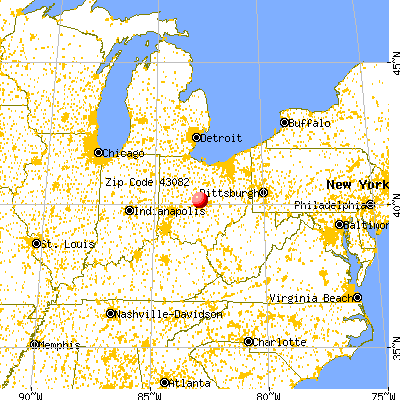
Land area: 22.1 sq. mi. Water area: 1.3 sq. mi.
Population density: 1,498 people per square mile
(low).
OSM Map
General Map
Google Map
MSN Map
OSM Map
General Map
Google Map
MSN Map
OSM Map
General Map
Google Map
MSN Map
OSM Map
General Map
Google Map
MSN Map
Please wait while loading the map...
Real estate property taxes paid for housing units in 2022:
This zip code:
1.8% ($7,959)
Ohio:
1.3% ($2,639)
Median real estate property taxes paid for housing units with mortgages in 2022: $8,210 (1.8%) Median real estate property taxes paid for housing units with no mortgage in 2022: $7,252 (1.8%)
Estimated median house/condo value in 2022: $450,289
43082:
$450,289
Ohio:
$204,100
According to our research of Ohio and other state lists, there were 8 registered sex offenders living in 43082 zip code as of April 27, 2024. The ratio of all residents to sex offenders in zip code 43082 is 4,035 to 1. The ratio of registered sex offenders to all residents in this zip code is much lower than the state average.
Median resident age:
This zip code:
42.8 years
Ohio median age:
39.9 years
Average household size:
This zip code:
2.7 people
Ohio:
2.4 people
Averages for the 2020 tax year for zip code 43082, filed in 2021:
Average Adjusted Gross Income (AGI) in 2020: $137,768 (Individual Income Tax Returns)
Here:
$137,768
State:
$67,288
Salary/wage: $111,902 (reported on 79.1% of returns)
Here:
$111,902
State:
$55,628
(% of AGI for various income ranges: 1055.0% for AGIs below $25k, 3380.6% for AGIs $25k-50k, 5723.2% for AGIs $50k-75k, 9024.9% for AGIs $75k-100k, 19556.9% for AGIs $100k-200k, 89794.8% for AGIs over 200k)
Taxable interest for individuals: $2,316 (reported on 47.0% of returns)
This zip code:
$2,316
Ohio:
$1,518
(% of AGI for various income ranges: 21.2% for AGIs below $25k, 48.7% for AGIs $25k-50k, 61.7% for AGIs $50k-75k, 94.7% for AGIs $75k-100k, 148.1% for AGIs $100k-200k, 1371.7% for AGIs over 200k)
Ordinary dividends: $7,664 (reported on 41.4% of returns)
Here:
$7,664
State:
$7,167
(% of AGI for various income ranges: 51.3% for AGIs below $25k, 116.2% for AGIs $25k-50k, 232.7% for AGIs $50k-75k, 328.7% for AGIs $75k-100k, 518.5% for AGIs $100k-200k, 3669.5% for AGIs over 200k)
Net capital gain/loss in AGI: +$38,595 (reported on 36.5% of returns)
Here:
+$38,595
State:
+$18,919
(% of AGI for various income ranges: 45.9% for AGIs below $25k, 100.7% for AGIs $25k-50k, 174.9% for AGIs $50k-75k, 234.2% for AGIs $75k-100k, 678.6% for AGIs $100k-200k, 25041.0% for AGIs over 200k)
Profit/loss from business: +$26,231 (reported on 17.4% of returns)
Here:
+$26,231
State:
+$13,744
(% of AGI for various income ranges: 92.9% for AGIs below $25k, 227.1% for AGIs $25k-50k, 232.1% for AGIs $50k-75k, 451.5% for AGIs $75k-100k, 913.5% for AGIs $100k-200k, 4809.0% for AGIs over 200k)
Taxable individual retirement arrangement distribution: $26,665 (reported on 15.1% of returns)
43082:
$26,665
Ohio:
$18,876
(% of AGI for various income ranges: 89.5% for AGIs below $25k, 332.1% for AGIs $25k-50k, 495.2% for AGIs $50k-75k, 763.3% for AGIs $75k-100k, 1120.9% for AGIs $100k-200k, 2188.9% for AGIs over 200k)
Self-employed (Keogh) retirement plans: $26,813 (reported on 1.8% of returns)
43082:
$26,813
Ohio:
$24,898
(% of AGI for various income ranges: 28.9% for AGIs $50k-75k, 66.0% for AGIs $100k-200k, 747.2% for AGIs over 200k)
Total itemized deductions: $33,943 (reported on 16.9% of returns)
Here:
$33,943
State:
$33,869
(% of AGI for various income ranges: 94.9% for AGIs below $25k, 302.8% for AGIs $25k-50k, 540.1% for AGIs $50k-75k, 785.6% for AGIs $75k-100k, 1055.9% for AGIs $100k-200k, 5688.9% for AGIs over 200k)
Charity contributions: $13,861 (reported on 14.5% of returns)
Here:
$13,861
State:
$14,577
(% of AGI for various income ranges: 5.8% for AGIs below $25k, 41.5% for AGIs $25k-50k, 83.2% for AGIs $50k-75k, 157.1% for AGIs $75k-100k, 290.0% for AGIs $100k-200k, 2735.6% for AGIs over 200k)
Taxes paid: $8,737 (reported on 16.8% of returns)
43082:
$8,737
State:
$7,681
(% of AGI for various income ranges: 16.1% for AGIs below $25k, 67.7% for AGIs $25k-50k, 152.5% for AGIs $50k-75k, 253.5% for AGIs $75k-100k, 340.3% for AGIs $100k-200k, 1207.7% for AGIs over 200k)
Earned income credit: $1,869 (reported on 3.8% of returns)
Here:
$1,869
State:
$2,304
(% of AGI for various income ranges: 29.9% for AGIs below $25k, 34.3% for AGIs $25k-50k)
Percentage of individuals using paid preparers for their 2020 taxes: 93.2%
Here:
93%
State:
94%
(% for various income ranges: 90.9% for AGIs below $25k, 93.0% for AGIs $25k-50k, 92.4% for AGIs $50k-75k, 94.3% for AGIs $75k-100k, 94.0% for AGIs $100k-200k, 94.7% for AGIs over 200k)
Averages for the 2012 tax year for zip code 43082, filed in 2013:
Average Adjusted Gross Income (AGI) in 2012: $110,871 (Individual Income Tax Returns)
Here:
$110,871
State:
$54,926
Salary/wage: $94,068 (reported on 84.2% of returns)
Here:
$94,068
State:
$45,869
(% of AGI for various income ranges: 73.1% for AGIs below $25k, 65.7% for AGIs $25k-50k, 67.0% for AGIs $50k-75k, 74.7% for AGIs $75k-100k, 80.4% for AGIs $100k-200k, 65.1% for AGIs over 200k)
Taxable interest for individuals: $1,831 (reported on 51.1% of returns)
This zip code:
$1,831
Ohio:
$1,297
(% of AGI for various income ranges: 1.9% for AGIs below $25k, 1.1% for AGIs $25k-50k, 0.7% for AGIs $50k-75k, 0.6% for AGIs $75k-100k, 0.4% for AGIs $100k-200k, 1.2% for AGIs over 200k)
Ordinary dividends: $7,249 (reported on 39.8% of returns)
Here:
$7,249
State:
$5,821
(% of AGI for various income ranges: 3.3% for AGIs below $25k, 2.1% for AGIs $25k-50k, 2.2% for AGIs $50k-75k, 1.5% for AGIs $75k-100k, 1.4% for AGIs $100k-200k, 3.9% for AGIs over 200k)
Net capital gain/loss in AGI: +$12,890 (reported on 32.9% of returns)
Here:
+$12,890
State:
+$11,232
(% of AGI for various income ranges: 0.3% for AGIs $25k-50k, 0.5% for AGIs $50k-75k, 0.8% for AGIs $75k-100k, 1.1% for AGIs $100k-200k, 7.6% for AGIs over 200k)
Profit/loss from business: +$21,296 (reported on 17.6% of returns)
Here:
+$21,296
State:
+$12,773
(% of AGI for various income ranges: 6.5% for AGIs below $25k, 4.7% for AGIs $25k-50k, 2.5% for AGIs $50k-75k, 3.4% for AGIs $75k-100k, 3.4% for AGIs $100k-200k, 3.3% for AGIs over 200k)
Taxable individual retirement arrangement distribution: $21,420 (reported on 14.3% of returns)
43082:
$21,420
Ohio:
$14,511
(% of AGI for various income ranges: 5.4% for AGIs below $25k, 5.1% for AGIs $25k-50k, 4.6% for AGIs $50k-75k, 3.7% for AGIs $75k-100k, 3.0% for AGIs $100k-200k, 1.8% for AGIs over 200k)
Self-employment retirement plans: $20,303 (reported on 2.0% of returns)
43082:
$20,303
Ohio:
$20,257
(% of AGI for various income ranges: 0.3% for AGIs $25k-50k, 0.2% for AGIs $75k-100k, 0.3% for AGIs $100k-200k, 0.5% for AGIs over 200k)
Total itemized deductions: $28,626 (18% of AGI, reported on 63.3% of returns)
Here:
$28,626
State:
$21,278
Here:
18.0% of AGI
State:
18.8% of AGI
(% of AGI for various income ranges: 15.8% for AGIs below $25k, 17.8% for AGIs $25k-50k, 19.2% for AGIs $50k-75k, 19.1% for AGIs $75k-100k, 18.3% for AGIs $100k-200k, 13.7% for AGIs over 200k)
Charity contributions: $4,294 (reported on 56.1% of returns)
Here:
$4,294
State:
$3,943
(% of AGI for various income ranges: 1.2% for AGIs below $25k, 2.0% for AGIs $25k-50k, 2.3% for AGIs $50k-75k, 2.1% for AGIs $75k-100k, 2.2% for AGIs $100k-200k, 2.2% for AGIs over 200k)
Taxes paid: $15,030 (reported on 63.1% of returns)
43082:
$15,030
State:
$9,568
(% of AGI for various income ranges: 4.7% for AGIs below $25k, 6.2% for AGIs $25k-50k, 8.1% for AGIs $50k-75k, 8.9% for AGIs $75k-100k, 9.4% for AGIs $100k-200k, 8.3% for AGIs over 200k)
Earned income credit: $1,802 (reported on 4.4% of returns)
Here:
$1,802
State:
$2,285
(% of AGI for various income ranges: 2.4% for AGIs below $25k, 0.5% for AGIs $25k-50k)
Percentage of individuals using paid preparers for their 2012 taxes: 49.7%
Here:
50%
State:
51%
(% for various income ranges: 38.4% for AGIs below $25k, 50.8% for AGIs $25k-50k, 55.2% for AGIs $50k-75k, 50.0% for AGIs $75k-100k, 49.1% for AGIs $100k-200k, 68.0% for AGIs over 200k)
Averages for the 2004 tax year for zip code 43082, filed in 2005:
Average Adjusted Gross Income (AGI) in 2004: $94,627 (Individual Income Tax Returns)
Here:
$94,627
State:
$44,480
Salary/wage: $82,687 (reported on 87.0% of returns)
Here:
$82,687
State:
$39,198
(% of AGI for various income ranges: 143.7% for AGIs below $10k, 70.6% for AGIs $10k-25k, 73.6% for AGIs $25k-50k, 77.1% for AGIs $50k-75k, 85.8% for AGIs $75k-100k, 73.8% for AGIs over 100k)
Taxable interest for individuals: $1,610 (reported on 64.8% of returns)
This zip code:
$1,610
Ohio:
$1,532
(% of AGI for various income ranges: 7.0% for AGIs below $10k, 3.8% for AGIs $10k-25k, 1.9% for AGIs $25k-50k, 1.4% for AGIs $50k-75k, 0.7% for AGIs $75k-100k, 1.0% for AGIs over 100k)
Taxable dividends: $3,508 (reported on 44.9% of returns)
Here:
$3,508
State:
$3,496
(% of AGI for various income ranges: 8.1% for AGIs below $10k, 2.3% for AGIs $10k-25k, 1.6% for AGIs $25k-50k, 1.3% for AGIs $50k-75k, 0.9% for AGIs $75k-100k, 1.8% for AGIs over 100k)
Net capital gain/loss: +$15,370 (reported on 38.2% of returns)
Here:
+$15,370
State:
+$8,582
(% of AGI for various income ranges: 2.8% for AGIs below $10k, 0.5% for AGIs $10k-25k, 0.9% for AGIs $25k-50k, 0.7% for AGIs $50k-75k, 1.2% for AGIs $75k-100k, 8.5% for AGIs over 100k)
Profit/loss from business: +$19,811 (reported on 18.1% of returns)
Here:
+$19,811
State:
+$10,813
(% of AGI for various income ranges: -2.4% for AGIs below $10k, 4.3% for AGIs $10k-25k, 5.4% for AGIs $25k-50k, 4.8% for AGIs $50k-75k, 3.0% for AGIs $75k-100k, 3.7% for AGIs over 100k)
IRA payment deduction: $3,346 (reported on 2.8% of returns)
43082:
$3,346
Ohio:
$2,794
(% of AGI for various income ranges: 0.3% for AGIs $10k-25k, 0.3% for AGIs $25k-50k, 0.2% for AGIs $50k-75k, 0.1% for AGIs $75k-100k, 0.1% for AGIs over 100k)
Self-employed pension: $17,067 (reported on 2.4% of returns)
Here:
$17,067
Ohio:
$13,981
(% of AGI for various income ranges: 0.3% for AGIs $25k-50k, 0.3% for AGIs $50k-75k, 0.1% for AGIs $75k-100k, 0.5% for AGIs over 100k)
Total itemized deductions: $25,674 (20% of AGI, reported on 67.5% of returns)
Here:
$25,674
State:
$17,503
Here:
19.6% of AGI
State:
20.8% of AGI
(% of AGI for various income ranges: 22.3% for AGIs below $10k, 19.3% for AGIs $10k-25k, 22.5% for AGIs $25k-50k, 23.9% for AGIs $50k-75k, 22.6% for AGIs $75k-100k, 16.3% for AGIs over 100k)
Charity contributions deductions: $3,669 (3% of AGI, reported on 61.8% of returns)
Here:
$3,669
State:
$3,087
Here:
2.7% of AGI
State:
3.4% of AGI
(% of AGI for various income ranges: 1.4% for AGIs below $10k, 2.0% for AGIs $10k-25k, 2.3% for AGIs $25k-50k, 2.7% for AGIs $50k-75k, 2.4% for AGIs $75k-100k, 2.4% for AGIs over 100k)
Total tax: $17,687 (reported on 85.1% of returns)
43082:
$17,687
State:
$6,781
(% of AGI for various income ranges: 4.9% for AGIs below $10k, 4.9% for AGIs $10k-25k, 7.7% for AGIs $25k-50k, 9.4% for AGIs $50k-75k, 9.8% for AGIs $75k-100k, 19.0% for AGIs over 100k)
Earned income credit: $1,486 (reported on 3.2% of returns)
Here:
$1,486
State:
$1,696
Percentage of individuals using paid preparers for their 2004 taxes: 50.9%
Here:
51%
State:
55%
(% for various income ranges: 40.0% for AGIs below $10k, 47.2% for AGIs $10k-25k, 55.4% for AGIs $25k-50k, 56.0% for AGIs $50k-75k, 50.5% for AGIs $75k-100k, 53.7% for AGIs over 100k)
Likely homosexual households (counted as self-reported same-sex unmarried-partner households)
Lesbian couples: 0.0% of all households
Gay men: 0.2% of all households
Household received Food Stamps/SNAP in the past 12 months: 176 Household did not receive Food Stamps/SNAP in the past 12 months: 11,960
Women who had a birth in the past 12 months: 224 (212 now married, 16 unmarried) Women who did not have a birth in the past 12 months: 7,312 (4,012 now married, 3,296 unmarried)
Housing units in zip code 43082 with a mortgage: 7,741 (1,134 second mortgage, 3 home equity loan, 961 both second mortgage and home equity loan) Houses without a mortgage: 189
Median monthly owner costs for units with a mortgage: $2,387 Median monthly owner costs for units without a mortgage: $1,069
Residents with income below the poverty level in 2022:
This zip code:
3.0%
Whole state:
13.4%
Residents with income below 50% of the poverty level in 2022:
This zip code:
1.9%
Whole state:
7.0%
Median number of rooms in houses and condos:
Here:
8.1
State:
6.7
Median number of rooms in apartments:
Here:
4.0
State:
4.4
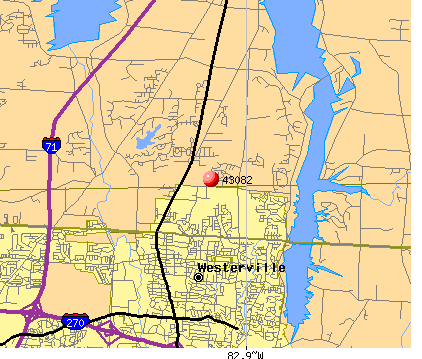
Notable locations in this zip code not listed on our city pages
Notable locations in zip code 43082: The Lakes Country Club (A), Purdie Industrial Park (B), Heron Lakes Golf Club (C), Westerville Division of Fire Station 113 (D). Display/hide their locations on the map
In group quarters: 84 (-1 institutionalized population)
Size of family households: 4,083 2-persons, 1,777 3-persons, 1,937 4-persons, 1,159 5-persons, 323 6-persons, 91 7-or-more-persons
Size of nonfamily households: 2,361 1-person, 342 2-persons, 13 3-persons
7,180 married couples with children.
1,087 single-parent households (316 men, 771 women).
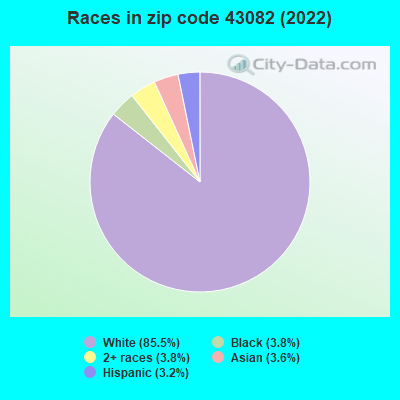
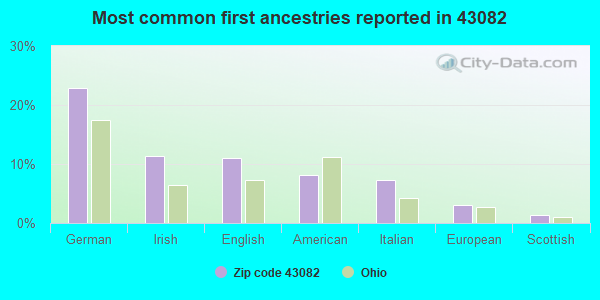
92.5% of residents of 43082 zip code speak English at home.
1.9% of residents speak Spanish at home (87% very well, 13% well).
2.6% of residents speak other Indo-European language at home (86% very well, 11% well, 2% not well, 1% not at all).
2.4% of residents speak Asian or Pacific Island language at home (66% very well, 14% well, 20% not well).
0.6% of residents speak other language at home (94% very well, 6% well).
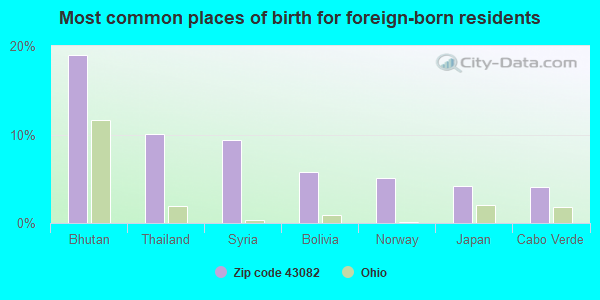
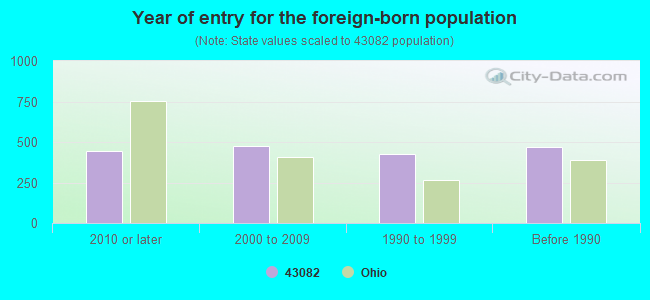
Foreign born population: 1,515 (4.6%) (76.7% of them are naturalized citizens)
Facilities with environmental interests located in this zip code:
ABRASIVE TECHNOLOGY INC (8400 GREEN MEADOWS DR. in WESTERVILLE, OH)
STATE MASTER (Ohio general info) - RCRA-OHD981784648, HAZARDOUS WASTE PROGRAM, AIR MAJOR, EPCRA, TRIS-43081BRSVT8400G, TRI REPORTER HAZARDOUS WASTE BIENNIAL REPORTER (Resource Conservation and Recovery Act (tracking hazardous waste)) Large Quantity Generators, more that 1000 kg of hazardous waste/month (Resource Conservation and Recovery Act (tracking hazardous waste)) TRI REPORTER (Tracking of toxic chemicals releasing facilities) Business SIC classification: ELECTROPLATING, PLATING, POLISHING, ANODIZING, AND COLORING Organizations: ABRASIVE TECHNOLOGY PARTNERSHIP (CONTACT/OWNER)
ANOMATIC CORP (175 E BROADWAY in WESTERVILLE, OH)
AIR MINOR (AIRS/AFS) STATE MASTER (Ohio general info) - RCRA-OHD069067932, HAZARDOUS WASTE PROGRAM, AIR MAJOR Conditionally Exempt Small Quantity Generators, less than 100 kg/month of hazardous waste (Resource Conservation and Recovery Act (tracking hazardous waste)) TRI REPORTER (Tracking of toxic chemicals releasing facilities) Business SIC and NAICS classification: ELECTROPLATING, PLATING, POLISHING, ANODIZING, AND COLORING Organizations: RUSCH PROPERTIES (CONTACT/OPERATOR)
, ANOMATIC CORPORATION (CONTACT/OWNER)
Housing units lacking complete plumbing facilities: 0.3% Housing units lacking complete kitchen facilities: 1.6%
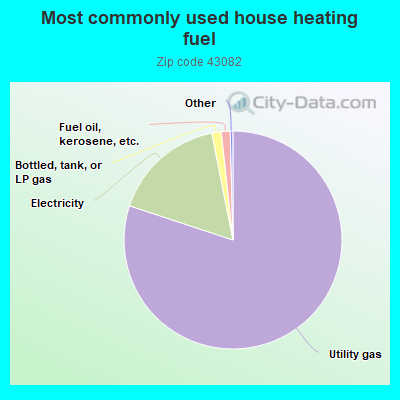
80.0%Utility gas
16.8%Electricity
1.4%Bottled, tank, or LP gas
1.3%Fuel oil, kerosene, etc.
Place of birth for U.S.-born residents:
This state: 22,505
Northeast: 2,051
Midwest: 2,536
South: 3,112
West: 1,060
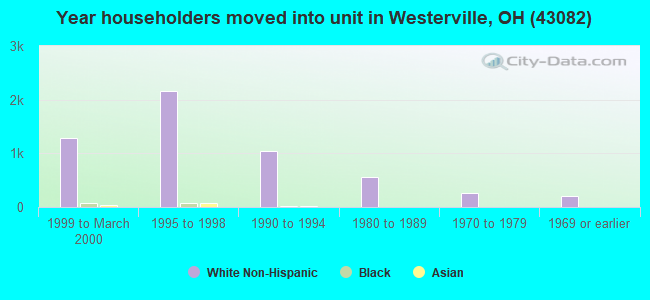
40% of the 43082 zip code residents lived in the same house 5 years ago. Out of people who lived in different houses, 10% lived in this county. Out of people who lived in different counties, 50% lived in Ohio.
92% of the 43082 zip code residents lived in the same house 1 year ago. Out of people who lived in different houses, 20% moved from this county. Out of people who lived in different houses, 70% moved from different county within same state. Out of people who lived in different houses, 15% moved from different state. Out of people who lived in different houses, 3% moved from abroad.
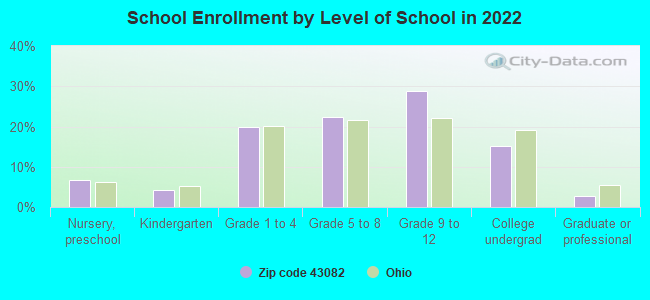
Private vs. public school enrollment:
Students in private schools in grades 1 to 8 (elementary and middle school): 475
Here:
12.3%
Ohio:
16.0%
Students in private schools in grades 9 to 12 (high school): 405
Here:
15.4%
Ohio:
13.1%
Students in private undergraduate colleges: 285
Here:
20.5%
Ohio:
22.3%
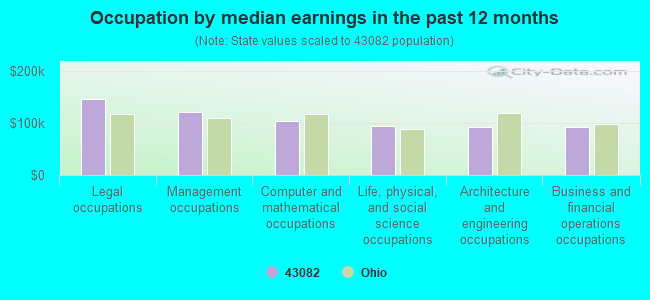
Occupation by median earnings in the past 12 months ($)
145,894Legal occupations
120,572Management occupations
104,426Computer and mathematical occupations
93,953Life, physical, and social science occupations
93,029Architecture and engineering occupations
91,669Business and financial operations occupations
Companies with federal contracts located in this zip code (WESTERVILLE, OH):
METSS CORP (300 WESTDALE AVE; small business) : $16,873,033 in 72 contractsfrom 1999 to 2006
Contracts for Other Research and Development -- Operational Systems Development (R&D), Other Research and Development -- Basic Research (R&D), Other Defense -- Management and Support (R&D), Defense Electronics and Communication Equipment -- Applied Research and Exploratory Development (R&D), and moreby Air Force, Navy, Army Signed by year:2000: $2,282,443; 2001: $1,461,317; 2002: $2,575,878; 2003: $739,300; 2004: $1,457,394; 2005: $7,470,360; 2006: $816,442.
Biggest contracts:
$3,473,578 with Air Force for Other Research and Development -- Operational Systems Development (R&D). Signed on 2005-12-14. Completion date: 2007-09-30.
$747,430 with Air Force for Other Research and Development -- Basic Research (R&D). Signed on 2005-09-27. Completion date: 2007-09-30.
$746,626 with Air Force for Other Defense -- Management and Support (R&D). Signed on 2002-09-10. Completion date: 2005-01-30.
$725,000 with Air Force for Other Research and Development -- Operational Systems Development (R&D). Signed on 2005-11-10. Completion date: 2007-09-30.
BIOCRYSTAL, LTD (575 MCCORKLE BOULEVARD; small business) : $866,459 in 4 contractsfrom 2001 to 2004
$369,939 with Army for Other Defense -- Management and Support (R&D). Signed on 2003-04-22. Completion date: 2005-04-20.
$360,000, same as above.Signed on 2004-03-11. Completion date: 2005-04-20.
$69,720, same as above.Signed on 2001-01-12. Completion date: 2001-07-11.
$66,800 with NASA for Life Sciences -- Applied Research and Exploratory Development (R&D). Signed on 2003-03-24. Completion date: 2004-05-03.
SCIOTO VALVE & FITTING CO (200 HOFF ROAD; small business) : $92,107 in 13 contractsfrom 2004 to 2006
Contracts for Valves, Nonpowered, Engine Air and Oil Filters, Cleaners, Aircraft Prime Moving, , Hose, Pipe, Tube, Lubrication, and Railing Fittings by Defense Logistics Agency, NASA Signed by year:2000: $0; 2001: $0; 2002: $0; 2003: $0; 2004: $61,391; 2005: $20,965; 2006: $9,751.
Biggest contracts:
$19,571 with Defense Logistics Agency for Valves, Nonpowered. Signed on 2004-10-29. Completion date: 2004-11-08.
$15,818, same as above.Signed on 2004-11-16. Completion date: 2004-12-16.
$13,008, same as above.Signed on 2004-10-25. Completion date: 2005-01-06.
$8,433 with Defense Logistics Agency for Engine Air and Oil Filters, Cleaners, Aircraft Prime Moving. Signed on 2005-09-14. Completion date: 2005-10-12.
THE EDWARD ORTON JR CERAMIC FO (6991 S OLD 3C HWY; small business)
$20,800 with Army for Laboratory Equipment and Supplies. Signed on 2005-09-23. Completion date: 2005-11-23.
CHAMBERS, HAROLD F JR (383 WYNDHAM PARK S; small business)
$14,686 with Air Force for Physical Sciences -- Management and Support (R&D). Signed on 2005-08-15. Completion date: 2006-05-14.
AUDIO VISUAL COMM SYSTEMS, INC (7000 HARLEM RD; small business)
$6,983 with Defense Finance and Accounting Service for Amplifiers. Signed on 2004-01-28. Completion date: 2004-02-26.
DAI, INC (5386 CLUB DR; small business)
$3,600 with Defense Logistics Agency for Training Aids. Signed on 2005-11-03. Completion date: 2005-12-21.
ADVERTISE AMERICA INC (5695 ST ANDREWS DRIVE; small business)
$3,577 with Army for Miscellaneous Items. Signed on 2004-03-25. Completion date: 2004-04-24.
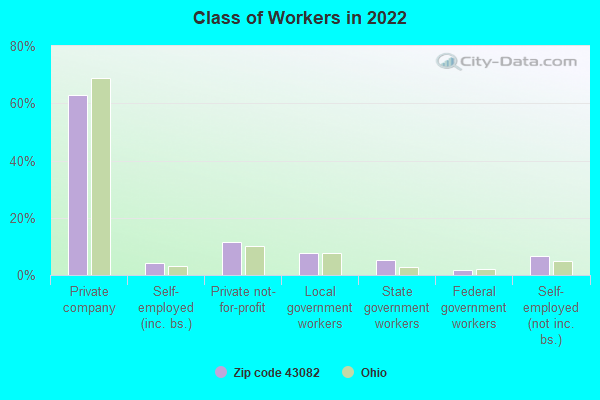
Top industries in this zip code by the number of employees in 2005:
Management of Companies and Enterprises: Corporate, Subsidiary, and Regional Managing Offices (250-499 employees: 1 establishment, 100-249 employees: 2 establishments, 50-99 employees: 1 establishment)
Finance and Insurance: Direct Health and Medical Insurance Carriers (500-999: 1, 10-19: 1, 1-4: 1)
Other Services (except Public Administration): Other Electronic and Precision Equipment Repair and Maintenance (250-499: 1, 100-249: 1)
2002 - 2018 National Fire Incident Reporting System (NFIRS) incidents
Based on the data from the years 2002 - 2018 the average number of fire incidents per year is 41. The highest number of reported fire incidents - 58 took place in 2016, and the least - 26 in 2007. The data has an increasing trend.
When looking into fire subcategories, the most incidents belonged to: Structure Fires (51.9%), and Outside Fires (32.9%).
Fire incident types reported to NFIRS in Zip Code 43082


 Nearest zip codes: 43081, 43021, 43231, 43240, 43054, 43229.


 Based on the data from the years 2002 - 2018 the average number of fire incidents per year is 41. The highest number of reported fire incidents - 58 took place in 2016, and the least - 26 in 2007. The data has an increasing trend.
 When looking into fire subcategories, the most incidents belonged to: Structure Fires (51.9%), and Outside Fires (32.9%).