Estimated zip code population in 2022: 28,506
Zip code population in 2010: 20,566
Zip code population in 2000: 8,347
Houses and condos: 11,664
Renter-occupied apartments: 3,647
% of renters here:
32%State:
33%
March 2022 cost of living index in zip code 43054: 97.9
(near average, U.S. average is 100)
Land area: 20.0
sq. mi.
Water area: 0.3
sq. mi.
Population density: 1,424 people per square mile (low).
OSM Map
General Map
Google Map
MSN Map
OSM Map
General Map
Google Map
MSN Map
OSM Map
General Map
Google Map
MSN Map
OSM Map
General Map
Google Map
MSN Map
Please wait while loading the map...
Real estate property taxes paid for housing units in 2022:
This zip code:
1.9% ($9,377)Ohio:
1.3% ($2,639)
Median real estate property taxes paid for housing units with mortgages in 2022: $9,444 (1.9%)
Median real estate property taxes paid for housing units with no mortgage in 2022: $9,164 (2.0%)
Profiles of local businesses
Business Search - 14 Million verified businesses
Males: 14,127 Females: 14,378
For population 25 years and over in 43054:
High school or higher: 99.4%Bachelor's degree or higher: 68.3%Graduate or professional degree: 27.1%Unemployed: 1.8%Mean travel time to work (commute): 25.1 minutes
For population 15 years and over in 43054:
Never married: 28.4%Now married: 61.5%Separated: 0.9%Widowed: 2.4%Divorced: 6.8%
Zip code 43054 compared to state average:
Median household income above state average. Median house value significantly above state average. Unemployed percentage below state average. Foreign-born population percentage significantly above state average. House age significantly below state average. Percentage of population with a bachelor's degree or higher above state average. 20,602 72.3% White 2,319 8.1% Black 2,049 7.2% Two or more races 1,929 6.8% Asian 1,545 5.4% Hispanic or Latino 59 0.2% Some other race
Data:
Median household income ($)
Median household income (% change since 2000)
Household income diversity
Ratio of average income to average house value (%)
Ratio of average income to average rent
Median household income ($) - White
Median household income ($) - Black or African American
Median household income ($) - Asian
Median household income ($) - Hispanic or Latino
Median household income ($) - American Indian and Alaska Native
Median household income ($) - Multirace
Median household income ($) - Other Race
Median household income for houses/condos with a mortgage ($)
Median household income for apartments without a mortgage ($)
Races - White alone (%)
Races - White alone (% change since 2000)
Races - Black alone (%)
Races - Black alone (% change since 2000)
Races - American Indian alone (%)
Races - American Indian alone (% change since 2000)
Races - Asian alone (%)
Races - Asian alone (% change since 2000)
Races - Hispanic (%)
Races - Hispanic (% change since 2000)
Races - Native Hawaiian and Other Pacific Islander alone (%)
Races - Native Hawaiian and Other Pacific Islander alone (% change since 2000)
Races - Two or more races (%)
Races - Two or more races (% change since 2000)
Races - Other race alone (%)
Races - Other race alone (% change since 2000)
Racial diversity
Unemployment (%)
Unemployment (% change since 2000)
Unemployment (%) - White
Unemployment (%) - Black or African American
Unemployment (%) - Asian
Unemployment (%) - Hispanic or Latino
Unemployment (%) - American Indian and Alaska Native
Unemployment (%) - Multirace
Unemployment (%) - Other Race
Population density (people per square mile)
Population - Males (%)
Population - Females (%)
Population - Males (%) - White
Population - Males (%) - Black or African American
Population - Males (%) - Asian
Population - Males (%) - Hispanic or Latino
Population - Males (%) - American Indian and Alaska Native
Population - Males (%) - Multirace
Population - Males (%) - Other Race
Population - Females (%) - White
Population - Females (%) - Black or African American
Population - Females (%) - Asian
Population - Females (%) - Hispanic or Latino
Population - Females (%) - American Indian and Alaska Native
Population - Females (%) - Multirace
Population - Females (%) - Other Race
Coronavirus confirmed cases (Apr 27, 2024)
Deaths caused by coronavirus (Apr 27, 2024)
Coronavirus confirmed cases (per 100k population) (Apr 27, 2024)
Deaths caused by coronavirus (per 100k population) (Apr 27, 2024)
Daily increase in number of cases (Apr 27, 2024)
Weekly increase in number of cases (Apr 27, 2024)
Cases doubled (in days) (Apr 27, 2024)
Hospitalized patients (Apr 18, 2022)
Negative test results (Apr 18, 2022)
Total test results (Apr 18, 2022)
COVID Vaccine doses distributed (per 100k population) (Sep 19, 2023)
COVID Vaccine doses administered (per 100k population) (Sep 19, 2023)
COVID Vaccine doses distributed (Sep 19, 2023)
COVID Vaccine doses administered (Sep 19, 2023)
Likely homosexual households (%)
Likely homosexual households (% change since 2000)
Likely homosexual households - Lesbian couples (%)
Likely homosexual households - Lesbian couples (% change since 2000)
Likely homosexual households - Gay men (%)
Likely homosexual households - Gay men (% change since 2000)
Cost of living index
Median gross rent ($)
Median contract rent ($)
Median monthly housing costs ($)
Median house or condo value ($)
Median house or condo value ($ change since 2000)
Mean house or condo value by units in structure - 1, detached ($)
Mean house or condo value by units in structure - 1, attached ($)
Mean house or condo value by units in structure - 2 ($)
Mean house or condo value by units in structure by units in structure - 3 or 4 ($)
Mean house or condo value by units in structure - 5 or more ($)
Mean house or condo value by units in structure - Boat, RV, van, etc. ($)
Mean house or condo value by units in structure - Mobile home ($)
Median house or condo value ($) - White
Median house or condo value ($) - Black or African American
Median house or condo value ($) - Asian
Median house or condo value ($) - Hispanic or Latino
Median house or condo value ($) - American Indian and Alaska Native
Median house or condo value ($) - Multirace
Median house or condo value ($) - Other Race
Median resident age
Resident age diversity
Median resident age - Males
Median resident age - Females
Median resident age - White
Median resident age - Black or African American
Median resident age - Asian
Median resident age - Hispanic or Latino
Median resident age - American Indian and Alaska Native
Median resident age - Multirace
Median resident age - Other Race
Median resident age - Males - White
Median resident age - Males - Black or African American
Median resident age - Males - Asian
Median resident age - Males - Hispanic or Latino
Median resident age - Males - American Indian and Alaska Native
Median resident age - Males - Multirace
Median resident age - Males - Other Race
Median resident age - Females - White
Median resident age - Females - Black or African American
Median resident age - Females - Asian
Median resident age - Females - Hispanic or Latino
Median resident age - Females - American Indian and Alaska Native
Median resident age - Females - Multirace
Median resident age - Females - Other Race
Commute - mean travel time to work (minutes)
Travel time to work - Less than 5 minutes (%)
Travel time to work - Less than 5 minutes (% change since 2000)
Travel time to work - 5 to 9 minutes (%)
Travel time to work - 5 to 9 minutes (% change since 2000)
Travel time to work - 10 to 19 minutes (%)
Travel time to work - 10 to 19 minutes (% change since 2000)
Travel time to work - 20 to 29 minutes (%)
Travel time to work - 20 to 29 minutes (% change since 2000)
Travel time to work - 30 to 39 minutes (%)
Travel time to work - 30 to 39 minutes (% change since 2000)
Travel time to work - 40 to 59 minutes (%)
Travel time to work - 40 to 59 minutes (% change since 2000)
Travel time to work - 60 to 89 minutes (%)
Travel time to work - 60 to 89 minutes (% change since 2000)
Travel time to work - 90 or more minutes (%)
Travel time to work - 90 or more minutes (% change since 2000)
Marital status - Never married (%)
Marital status - Now married (%)
Marital status - Separated (%)
Marital status - Widowed (%)
Marital status - Divorced (%)
Median family income ($)
Median family income (% change since 2000)
Median non-family income ($)
Median non-family income (% change since 2000)
Median per capita income ($)
Median per capita income (% change since 2000)
Median family income ($) - White
Median family income ($) - Black or African American
Median family income ($) - Asian
Median family income ($) - Hispanic or Latino
Median family income ($) - American Indian and Alaska Native
Median family income ($) - Multirace
Median family income ($) - Other Race
Median year house/condo built
Median year apartment built
Year house built - Built 2005 or later (%)
Year house built - Built 2000 to 2004 (%)
Year house built - Built 1990 to 1999 (%)
Year house built - Built 1980 to 1989 (%)
Year house built - Built 1970 to 1979 (%)
Year house built - Built 1960 to 1969 (%)
Year house built - Built 1950 to 1959 (%)
Year house built - Built 1940 to 1949 (%)
Year house built - Built 1939 or earlier (%)
Average household size
Household density (households per square mile)
Average household size - White
Average household size - Black or African American
Average household size - Asian
Average household size - Hispanic or Latino
Average household size - American Indian and Alaska Native
Average household size - Multirace
Average household size - Other Race
Occupied housing units (%)
Vacant housing units (%)
Owner occupied housing units (%)
Renter occupied housing units (%)
Vacancy status - For rent (%)
Vacancy status - For sale only (%)
Vacancy status - Rented or sold, not occupied (%)
Vacancy status - For seasonal, recreational, or occasional use (%)
Vacancy status - For migrant workers (%)
Vacancy status - Other vacant (%)
Residents with income below the poverty level (%)
Residents with income below 50% of the poverty level (%)
Children below poverty level (%)
Poor families by family type - Married-couple family (%)
Poor families by family type - Male, no wife present (%)
Poor families by family type - Female, no husband present (%)
Poverty status for native-born residents (%)
Poverty status for foreign-born residents (%)
Poverty among high school graduates not in families (%)
Poverty among people who did not graduate high school not in families (%)
Residents with income below the poverty level (%) - White
Residents with income below the poverty level (%) - Black or African American
Residents with income below the poverty level (%) - Asian
Residents with income below the poverty level (%) - Hispanic or Latino
Residents with income below the poverty level (%) - American Indian and Alaska Native
Residents with income below the poverty level (%) - Multirace
Residents with income below the poverty level (%) - Other Race
Air pollution - Air Quality Index (AQI)
Air pollution - CO
Air pollution - NO2
Air pollution - SO2
Air pollution - Ozone
Air pollution - PM10
Air pollution - PM25
Air pollution - Pb
Crime - Murders per 100,000 population
Crime - Rapes per 100,000 population
Crime - Robberies per 100,000 population
Crime - Assaults per 100,000 population
Crime - Burglaries per 100,000 population
Crime - Thefts per 100,000 population
Crime - Auto thefts per 100,000 population
Crime - Arson per 100,000 population
Crime - City-data.com crime index
Crime - Violent crime index
Crime - Property crime index
Crime - Murders per 100,000 population (5 year average)
Crime - Rapes per 100,000 population (5 year average)
Crime - Robberies per 100,000 population (5 year average)
Crime - Assaults per 100,000 population (5 year average)
Crime - Burglaries per 100,000 population (5 year average)
Crime - Thefts per 100,000 population (5 year average)
Crime - Auto thefts per 100,000 population (5 year average)
Crime - Arson per 100,000 population (5 year average)
Crime - City-data.com crime index (5 year average)
Crime - Violent crime index (5 year average)
Crime - Property crime index (5 year average)
1996 Presidential Elections Results (%) - Democratic Party (Clinton)
1996 Presidential Elections Results (%) - Republican Party (Dole)
1996 Presidential Elections Results (%) - Other
2000 Presidential Elections Results (%) - Democratic Party (Gore)
2000 Presidential Elections Results (%) - Republican Party (Bush)
2000 Presidential Elections Results (%) - Other
2004 Presidential Elections Results (%) - Democratic Party (Kerry)
2004 Presidential Elections Results (%) - Republican Party (Bush)
2004 Presidential Elections Results (%) - Other
2008 Presidential Elections Results (%) - Democratic Party (Obama)
2008 Presidential Elections Results (%) - Republican Party (McCain)
2008 Presidential Elections Results (%) - Other
2012 Presidential Elections Results (%) - Democratic Party (Obama)
2012 Presidential Elections Results (%) - Republican Party (Romney)
2012 Presidential Elections Results (%) - Other
2016 Presidential Elections Results (%) - Democratic Party (Clinton)
2016 Presidential Elections Results (%) - Republican Party (Trump)
2016 Presidential Elections Results (%) - Other
2020 Presidential Elections Results (%) - Democratic Party (Biden)
2020 Presidential Elections Results (%) - Republican Party (Trump)
2020 Presidential Elections Results (%) - Other
Ancestries Reported - Arab (%)
Ancestries Reported - Czech (%)
Ancestries Reported - Danish (%)
Ancestries Reported - Dutch (%)
Ancestries Reported - English (%)
Ancestries Reported - French (%)
Ancestries Reported - French Canadian (%)
Ancestries Reported - German (%)
Ancestries Reported - Greek (%)
Ancestries Reported - Hungarian (%)
Ancestries Reported - Irish (%)
Ancestries Reported - Italian (%)
Ancestries Reported - Lithuanian (%)
Ancestries Reported - Norwegian (%)
Ancestries Reported - Polish (%)
Ancestries Reported - Portuguese (%)
Ancestries Reported - Russian (%)
Ancestries Reported - Scotch-Irish (%)
Ancestries Reported - Scottish (%)
Ancestries Reported - Slovak (%)
Ancestries Reported - Subsaharan African (%)
Ancestries Reported - Swedish (%)
Ancestries Reported - Swiss (%)
Ancestries Reported - Ukrainian (%)
Ancestries Reported - United States (%)
Ancestries Reported - Welsh (%)
Ancestries Reported - West Indian (%)
Ancestries Reported - Other (%)
Educational Attainment - No schooling completed (%)
Educational Attainment - Less than high school (%)
Educational Attainment - High school or equivalent (%)
Educational Attainment - Less than 1 year of college (%)
Educational Attainment - 1 or more years of college (%)
Educational Attainment - Associate degree (%)
Educational Attainment - Bachelor's degree (%)
Educational Attainment - Master's degree (%)
Educational Attainment - Professional school degree (%)
Educational Attainment - Doctorate degree (%)
School Enrollment - Nursery, preschool (%)
School Enrollment - Kindergarten (%)
School Enrollment - Grade 1 to 4 (%)
School Enrollment - Grade 5 to 8 (%)
School Enrollment - Grade 9 to 12 (%)
School Enrollment - College undergrad (%)
School Enrollment - Graduate or professional (%)
School Enrollment - Not enrolled in school (%)
School enrollment - Public schools (%)
School enrollment - Private schools (%)
School enrollment - Not enrolled (%)
Median number of rooms in houses and condos
Median number of rooms in apartments
Housing units lacking complete plumbing facilities (%)
Housing units lacking complete kitchen facilities (%)
Density of houses
Urban houses (%)
Rural houses (%)
Households with people 60 years and over (%)
Households with people 65 years and over (%)
Households with people 75 years and over (%)
Households with one or more nonrelatives (%)
Households with no nonrelatives (%)
Population in households (%)
Family households (%)
Nonfamily households (%)
Population in families (%)
Family households with own children (%)
Median number of bedrooms in owner occupied houses
Mean number of bedrooms in owner occupied houses
Median number of bedrooms in renter occupied houses
Mean number of bedrooms in renter occupied houses
Median number of vehichles in owner occupied houses
Mean number of vehichles in owner occupied houses
Median number of vehichles in renter occupied houses
Mean number of vehichles in renter occupied houses
Mortgage status - with mortgage (%)
Mortgage status - with second mortgage (%)
Mortgage status - with home equity loan (%)
Mortgage status - with both second mortgage and home equity loan (%)
Mortgage status - without a mortgage (%)
Average family size
Average family size - White
Average family size - Black or African American
Average family size - Asian
Average family size - Hispanic or Latino
Average family size - American Indian and Alaska Native
Average family size - Multirace
Average family size - Other Race
Geographical mobility - Same house 1 year ago (%)
Geographical mobility - Moved within same county (%)
Geographical mobility - Moved from different county within same state (%)
Geographical mobility - Moved from different state (%)
Geographical mobility - Moved from abroad (%)
Place of birth - Born in state of residence (%)
Place of birth - Born in other state (%)
Place of birth - Native, outside of US (%)
Place of birth - Foreign born (%)
Housing units in structures - 1, detached (%)
Housing units in structures - 1, attached (%)
Housing units in structures - 2 (%)
Housing units in structures - 3 or 4 (%)
Housing units in structures - 5 to 9 (%)
Housing units in structures - 10 to 19 (%)
Housing units in structures - 20 to 49 (%)
Housing units in structures - 50 or more (%)
Housing units in structures - Mobile home (%)
Housing units in structures - Boat, RV, van, etc. (%)
House/condo owner moved in on average (years ago)
Renter moved in on average (years ago)
Year householder moved into unit - Moved in 1999 to March 2000 (%)
Year householder moved into unit - Moved in 1995 to 1998 (%)
Year householder moved into unit - Moved in 1990 to 1994 (%)
Year householder moved into unit - Moved in 1980 to 1989 (%)
Year householder moved into unit - Moved in 1970 to 1979 (%)
Year householder moved into unit - Moved in 1969 or earlier (%)
Means of transportation to work - Drove car alone (%)
Means of transportation to work - Carpooled (%)
Means of transportation to work - Public transportation (%)
Means of transportation to work - Bus or trolley bus (%)
Means of transportation to work - Streetcar or trolley car (%)
Means of transportation to work - Subway or elevated (%)
Means of transportation to work - Railroad (%)
Means of transportation to work - Ferryboat (%)
Means of transportation to work - Taxicab (%)
Means of transportation to work - Motorcycle (%)
Means of transportation to work - Bicycle (%)
Means of transportation to work - Walked (%)
Means of transportation to work - Other means (%)
Working at home (%)
Industry diversity
Most Common Industries - Agriculture, forestry, fishing and hunting, and mining (%)
Most Common Industries - Agriculture, forestry, fishing and hunting (%)
Most Common Industries - Mining, quarrying, and oil and gas extraction (%)
Most Common Industries - Construction (%)
Most Common Industries - Manufacturing (%)
Most Common Industries - Wholesale trade (%)
Most Common Industries - Retail trade (%)
Most Common Industries - Transportation and warehousing, and utilities (%)
Most Common Industries - Transportation and warehousing (%)
Most Common Industries - Utilities (%)
Most Common Industries - Information (%)
Most Common Industries - Finance and insurance, and real estate and rental and leasing (%)
Most Common Industries - Finance and insurance (%)
Most Common Industries - Real estate and rental and leasing (%)
Most Common Industries - Professional, scientific, and management, and administrative and waste management services (%)
Most Common Industries - Professional, scientific, and technical services (%)
Most Common Industries - Management of companies and enterprises (%)
Most Common Industries - Administrative and support and waste management services (%)
Most Common Industries - Educational services, and health care and social assistance (%)
Most Common Industries - Educational services (%)
Most Common Industries - Health care and social assistance (%)
Most Common Industries - Arts, entertainment, and recreation, and accommodation and food services (%)
Most Common Industries - Arts, entertainment, and recreation (%)
Most Common Industries - Accommodation and food services (%)
Most Common Industries - Other services, except public administration (%)
Most Common Industries - Public administration (%)
Occupation diversity
Most Common Occupations - Management, business, science, and arts occupations (%)
Most Common Occupations - Management, business, and financial occupations (%)
Most Common Occupations - Management occupations (%)
Most Common Occupations - Business and financial operations occupations (%)
Most Common Occupations - Computer, engineering, and science occupations (%)
Most Common Occupations - Computer and mathematical occupations (%)
Most Common Occupations - Architecture and engineering occupations (%)
Most Common Occupations - Life, physical, and social science occupations (%)
Most Common Occupations - Education, legal, community service, arts, and media occupations (%)
Most Common Occupations - Community and social service occupations (%)
Most Common Occupations - Legal occupations (%)
Most Common Occupations - Education, training, and library occupations (%)
Most Common Occupations - Arts, design, entertainment, sports, and media occupations (%)
Most Common Occupations - Healthcare practitioners and technical occupations (%)
Most Common Occupations - Health diagnosing and treating practitioners and other technical occupations (%)
Most Common Occupations - Health technologists and technicians (%)
Most Common Occupations - Service occupations (%)
Most Common Occupations - Healthcare support occupations (%)
Most Common Occupations - Protective service occupations (%)
Most Common Occupations - Fire fighting and prevention, and other protective service workers including supervisors (%)
Most Common Occupations - Law enforcement workers including supervisors (%)
Most Common Occupations - Food preparation and serving related occupations (%)
Most Common Occupations - Building and grounds cleaning and maintenance occupations (%)
Most Common Occupations - Personal care and service occupations (%)
Most Common Occupations - Sales and office occupations (%)
Most Common Occupations - Sales and related occupations (%)
Most Common Occupations - Office and administrative support occupations (%)
Most Common Occupations - Natural resources, construction, and maintenance occupations (%)
Most Common Occupations - Farming, fishing, and forestry occupations (%)
Most Common Occupations - Construction and extraction occupations (%)
Most Common Occupations - Installation, maintenance, and repair occupations (%)
Most Common Occupations - Production, transportation, and material moving occupations (%)
Most Common Occupations - Production occupations (%)
Most Common Occupations - Transportation occupations (%)
Most Common Occupations - Material moving occupations (%)
People in Group quarters - Institutionalized population (%)
People in Group quarters - Correctional institutions (%)
People in Group quarters - Federal prisons and detention centers (%)
People in Group quarters - Halfway houses (%)
People in Group quarters - Local jails and other confinement facilities (including police lockups) (%)
People in Group quarters - Military disciplinary barracks (%)
People in Group quarters - State prisons (%)
People in Group quarters - Other types of correctional institutions (%)
People in Group quarters - Nursing homes (%)
People in Group quarters - Hospitals/wards, hospices, and schools for the handicapped (%)
People in Group quarters - Hospitals/wards and hospices for chronically ill (%)
People in Group quarters - Hospices or homes for chronically ill (%)
People in Group quarters - Military hospitals or wards for chronically ill (%)
People in Group quarters - Other hospitals or wards for chronically ill (%)
People in Group quarters - Hospitals or wards for drug/alcohol abuse (%)
People in Group quarters - Mental (Psychiatric) hospitals or wards (%)
People in Group quarters - Schools, hospitals, or wards for the mentally retarded (%)
People in Group quarters - Schools, hospitals, or wards for the physically handicapped (%)
People in Group quarters - Institutions for the deaf (%)
People in Group quarters - Institutions for the blind (%)
People in Group quarters - Orthopedic wards and institutions for the physically handicapped (%)
People in Group quarters - Wards in general hospitals for patients who have no usual home elsewhere (%)
People in Group quarters - Wards in military hospitals for patients who have no usual home elsewhere (%)
People in Group quarters - Juvenile institutions (%)
People in Group quarters - Long-term care (%)
People in Group quarters - Homes for abused, dependent, and neglected children (%)
People in Group quarters - Residential treatment centers for emotionally disturbed children (%)
People in Group quarters - Training schools for juvenile delinquents (%)
People in Group quarters - Short-term care, detention or diagnostic centers for delinquent children (%)
People in Group quarters - Type of juvenile institution unknown (%)
People in Group quarters - Noninstitutionalized population (%)
People in Group quarters - College dormitories (includes college quarters off campus) (%)
People in Group quarters - Military quarters (%)
People in Group quarters - On base (%)
People in Group quarters - Barracks, unaccompanied personnel housing (UPH), (Enlisted/Officer), ;and similar group living quarters for military personnel (%)
People in Group quarters - Transient quarters for temporary residents (%)
People in Group quarters - Military ships (%)
People in Group quarters - Group homes (%)
People in Group quarters - Homes or halfway houses for drug/alcohol abuse (%)
People in Group quarters - Homes for the mentally ill (%)
People in Group quarters - Homes for the mentally retarded (%)
People in Group quarters - Homes for the physically handicapped (%)
People in Group quarters - Other group homes (%)
People in Group quarters - Religious group quarters (%)
People in Group quarters - Dormitories (%)
People in Group quarters - Agriculture workers' dormitories on farms (%)
People in Group quarters - Job Corps and vocational training facilities (%)
People in Group quarters - Other workers' dormitories (%)
People in Group quarters - Crews of maritime vessels (%)
People in Group quarters - Other nonhousehold living situations (%)
People in Group quarters - Other noninstitutional group quarters (%)
Residents speaking English at home (%)
Residents speaking English at home - Born in the United States (%)
Residents speaking English at home - Native, born elsewhere (%)
Residents speaking English at home - Foreign born (%)
Residents speaking Spanish at home (%)
Residents speaking Spanish at home - Born in the United States (%)
Residents speaking Spanish at home - Native, born elsewhere (%)
Residents speaking Spanish at home - Foreign born (%)
Residents speaking other language at home (%)
Residents speaking other language at home - Born in the United States (%)
Residents speaking other language at home - Native, born elsewhere (%)
Residents speaking other language at home - Foreign born (%)
Class of Workers - Employee of private company (%)
Class of Workers - Self-employed in own incorporated business (%)
Class of Workers - Private not-for-profit wage and salary workers (%)
Class of Workers - Local government workers (%)
Class of Workers - State government workers (%)
Class of Workers - Federal government workers (%)
Class of Workers - Self-employed workers in own not incorporated business and Unpaid family workers (%)
House heating fuel used in houses and condos - Utility gas (%)
House heating fuel used in houses and condos - Bottled, tank, or LP gas (%)
House heating fuel used in houses and condos - Electricity (%)
House heating fuel used in houses and condos - Fuel oil, kerosene, etc. (%)
House heating fuel used in houses and condos - Coal or coke (%)
House heating fuel used in houses and condos - Wood (%)
House heating fuel used in houses and condos - Solar energy (%)
House heating fuel used in houses and condos - Other fuel (%)
House heating fuel used in houses and condos - No fuel used (%)
House heating fuel used in apartments - Utility gas (%)
House heating fuel used in apartments - Bottled, tank, or LP gas (%)
House heating fuel used in apartments - Electricity (%)
House heating fuel used in apartments - Fuel oil, kerosene, etc. (%)
House heating fuel used in apartments - Coal or coke (%)
House heating fuel used in apartments - Wood (%)
House heating fuel used in apartments - Solar energy (%)
House heating fuel used in apartments - Other fuel (%)
House heating fuel used in apartments - No fuel used (%)
Armed forces status - In Armed Forces (%)
Armed forces status - Civilian (%)
Armed forces status - Civilian - Veteran (%)
Armed forces status - Civilian - Nonveteran (%)
Fatal accidents locations in years 2005-2021
Fatal accidents locations in 2005
Fatal accidents locations in 2006
Fatal accidents locations in 2007
Fatal accidents locations in 2008
Fatal accidents locations in 2009
Fatal accidents locations in 2010
Fatal accidents locations in 2011
Fatal accidents locations in 2012
Fatal accidents locations in 2013
Fatal accidents locations in 2014
Fatal accidents locations in 2015
Fatal accidents locations in 2016
Fatal accidents locations in 2017
Fatal accidents locations in 2018
Fatal accidents locations in 2019
Fatal accidents locations in 2020
Fatal accidents locations in 2021
Alcohol use - People drinking some alcohol every month (%)
Alcohol use - People not drinking at all (%)
Alcohol use - Average days/month drinking alcohol
Alcohol use - Average drinks/week
Alcohol use - Average days/year people drink much
Audiometry - Average condition of hearing (%)
Audiometry - People that can hear a whisper from across a quiet room (%)
Audiometry - People that can hear normal voice from across a quiet room (%)
Audiometry - Ears ringing, roaring, buzzing (%)
Audiometry - Had a job exposure to loud noise (%)
Audiometry - Had off-work exposure to loud noise (%)
Blood Pressure & Cholesterol - Has high blood pressure (%)
Blood Pressure & Cholesterol - Checking blood pressure at home (%)
Blood Pressure & Cholesterol - Frequently checking blood cholesterol (%)
Blood Pressure & Cholesterol - Has high cholesterol level (%)
Consumer Behavior - Money monthly spent on food at supermarket/grocery store
Consumer Behavior - Money monthly spent on food at other stores
Consumer Behavior - Money monthly spent on eating out
Consumer Behavior - Money monthly spent on carryout/delivered foods
Consumer Behavior - Income spent on food at supermarket/grocery store (%)
Consumer Behavior - Income spent on food at other stores (%)
Consumer Behavior - Income spent on eating out (%)
Consumer Behavior - Income spent on carryout/delivered foods (%)
Current Health Status - General health condition (%)
Current Health Status - Blood donors (%)
Current Health Status - Has blood ever tested for HIV virus (%)
Current Health Status - Left-handed people (%)
Dermatology - People using sunscreen (%)
Diabetes - Diabetics (%)
Diabetes - Had a blood test for high blood sugar (%)
Diabetes - People taking insulin (%)
Diet Behavior & Nutrition - Diet health (%)
Diet Behavior & Nutrition - Milk product consumption (# of products/month)
Diet Behavior & Nutrition - Meals not home prepared (#/week)
Diet Behavior & Nutrition - Meals from fast food or pizza place (#/week)
Diet Behavior & Nutrition - Ready-to-eat foods (#/month)
Diet Behavior & Nutrition - Frozen meals/pizza (#/month)
Drug Use - People that ever used marijuana or hashish (%)
Drug Use - Ever used hard drugs (%)
Drug Use - Ever used any form of cocaine (%)
Drug Use - Ever used heroin (%)
Drug Use - Ever used methamphetamine (%)
Health Insurance - People covered by health insurance (%)
Kidney Conditions-Urology - Avg. # of times urinating at night
Medical Conditions - People with asthma (%)
Medical Conditions - People with anemia (%)
Medical Conditions - People with psoriasis (%)
Medical Conditions - People with overweight (%)
Medical Conditions - Elderly people having difficulties in thinking or remembering (%)
Medical Conditions - People who ever received blood transfusion (%)
Medical Conditions - People having trouble seeing even with glass/contacts (%)
Medical Conditions - People with arthritis (%)
Medical Conditions - People with gout (%)
Medical Conditions - People with congestive heart failure (%)
Medical Conditions - People with coronary heart disease (%)
Medical Conditions - People with angina pectoris (%)
Medical Conditions - People who ever had heart attack (%)
Medical Conditions - People who ever had stroke (%)
Medical Conditions - People with emphysema (%)
Medical Conditions - People with thyroid problem (%)
Medical Conditions - People with chronic bronchitis (%)
Medical Conditions - People with any liver condition (%)
Medical Conditions - People who ever had cancer or malignancy (%)
Mental Health - People who have little interest in doing things (%)
Mental Health - People feeling down, depressed, or hopeless (%)
Mental Health - People who have trouble sleeping or sleeping too much (%)
Mental Health - People feeling tired or having little energy (%)
Mental Health - People with poor appetite or overeating (%)
Mental Health - People feeling bad about themself (%)
Mental Health - People who have trouble concentrating on things (%)
Mental Health - People moving or speaking slowly or too fast (%)
Mental Health - People having thoughts they would be better off dead (%)
Oral Health - Average years since last visit a dentist
Oral Health - People embarrassed because of mouth (%)
Oral Health - People with gum disease (%)
Oral Health - General health of teeth and gums (%)
Oral Health - Average days a week using dental floss/device
Oral Health - Average days a week using mouthwash for dental problem
Oral Health - Average number of teeth
Pesticide Use - Households using pesticides to control insects (%)
Pesticide Use - Households using pesticides to kill weeds (%)
Physical Activity - People doing vigorous-intensity work activities (%)
Physical Activity - People doing moderate-intensity work activities (%)
Physical Activity - People walking or bicycling (%)
Physical Activity - People doing vigorous-intensity recreational activities (%)
Physical Activity - People doing moderate-intensity recreational activities (%)
Physical Activity - Average hours a day doing sedentary activities
Physical Activity - Average hours a day watching TV or videos
Physical Activity - Average hours a day using computer
Physical Functioning - People having limitations keeping them from working (%)
Physical Functioning - People limited in amount of work they can do (%)
Physical Functioning - People that need special equipment to walk (%)
Physical Functioning - People experiencing confusion/memory problems (%)
Physical Functioning - People requiring special healthcare equipment (%)
Prescription Medications - Average number of prescription medicines taking
Preventive Aspirin Use - Adults 40+ taking low-dose aspirin (%)
Reproductive Health - Vaginal deliveries (%)
Reproductive Health - Cesarean deliveries (%)
Reproductive Health - Deliveries resulted in a live birth (%)
Reproductive Health - Pregnancies resulted in a delivery (%)
Reproductive Health - Women breastfeeding newborns (%)
Reproductive Health - Women that had a hysterectomy (%)
Reproductive Health - Women that had both ovaries removed (%)
Reproductive Health - Women that have ever taken birth control pills (%)
Reproductive Health - Women taking birth control pills (%)
Reproductive Health - Women that have ever used Depo-Provera or injectables (%)
Reproductive Health - Women that have ever used female hormones (%)
Sexual Behavior - People 18+ that ever had sex (vaginal, anal, or oral) (%)
Sexual Behavior - Males 18+ that ever had vaginal sex with a woman (%)
Sexual Behavior - Males 18+ that ever performed oral sex on a woman (%)
Sexual Behavior - Males 18+ that ever had anal sex with a woman (%)
Sexual Behavior - Males 18+ that ever had any sex with a man (%)
Sexual Behavior - Females 18+ that ever had vaginal sex with a man (%)
Sexual Behavior - Females 18+ that ever performed oral sex on a man (%)
Sexual Behavior - Females 18+ that ever had anal sex with a man (%)
Sexual Behavior - Females 18+ that ever had any kind of sex with a woman (%)
Sexual Behavior - Average age people first had sex
Sexual Behavior - Average number of female sex partners in lifetime (males 18+)
Sexual Behavior - Average number of female vaginal sex partners in lifetime (males 18+)
Sexual Behavior - Average age people first performed oral sex on a woman (18+)
Sexual Behavior - Average number of woman performed oral sex on in lifetime (18+)
Sexual Behavior - Average number of male sex partners in lifetime (males 18+)
Sexual Behavior - Average number of male anal sex partners in lifetime (males 18+)
Sexual Behavior - Average age people first performed oral sex on a man (18+)
Sexual Behavior - Average number of male oral sex partners in lifetime (18+)
Sexual Behavior - People using protection when performing oral sex (%)
Sexual Behavior - Average number of times people have vaginal or anal sex a year
Sexual Behavior - People having sex without condom (%)
Sexual Behavior - Average number of male sex partners in lifetime (females 18+)
Sexual Behavior - Average number of male vaginal sex partners in lifetime (females 18+)
Sexual Behavior - Average number of female sex partners in lifetime (females 18+)
Sexual Behavior - Circumcised males 18+ (%)
Sleep Disorders - Average hours sleeping at night
Sleep Disorders - People that has trouble sleeping (%)
Smoking-Cigarette Use - People smoking cigarettes (%)
Taste & Smell - People 40+ having problems with smell (%)
Taste & Smell - People 40+ having problems with taste (%)
Taste & Smell - People 40+ that ever had wisdom teeth removed (%)
Taste & Smell - People 40+ that ever had tonsils teeth removed (%)
Taste & Smell - People 40+ that ever had a loss of consciousness because of a head injury (%)
Taste & Smell - People 40+ that ever had a broken nose or other serious injury to face or skull (%)
Taste & Smell - People 40+ that ever had two or more sinus infections (%)
Weight - Average height (inches)
Weight - Average weight (pounds)
Weight - Average BMI
Weight - People that are obese (%)
Weight - People that ever were obese (%)
Weight - People trying to lose weight (%)
Urban population: 22,167
Rural population: 6,338
Estimated median house/condo value in 2022: $494,940
43054:
$494,940Ohio:
$204,100
According to our research of Ohio and other state lists, there were 6 registered sex offenders living in 43054 zip code as of April 27, 2024 . The ratio of all residents to sex offenders in zip code 43054 is 4,090 to 1.The ratio of registered sex offenders to all residents in this zip code is much lower than the state average.
Median resident age: This zip code:
36.6 yearsOhio median age:
39.9 years
Average household size: This zip code:
2.5 peopleOhio:
2.4 people
Averages for the 2020 tax year for zip code 43054, filed in 2021:
Average Adjusted Gross Income (AGI) in 2020: $189,584 (Individual Income Tax Returns) Here:
$189,584State:
$67,288
Salary/wage: $138,380 (reported on 84.8% of returns )Here:
$138,380State:
$55,628
(% of AGI for various income ranges: 1183.7% for AGIs below $25k , 3861.4% for AGIs $25k-50k , 6673.1% for AGIs $50k-75k , 10751.1% for AGIs $75k-100k , 21017.1% for AGIs $100k-200k , 130939.2% for AGIs over 200k ) Taxable interest for individuals: $5,239 (reported on 40.4% of returns )This zip code:
$5,239Ohio:
$1,518
(% of AGI for various income ranges: 15.2% for AGIs below $25k , 22.0% for AGIs $25k-50k , 36.7% for AGIs $50k-75k , 50.5% for AGIs $75k-100k , 166.7% for AGIs $100k-200k , 3171.7% for AGIs over 200k ) Ordinary dividends: $19,913 (reported on 36.8% of returns )(% of AGI for various income ranges: 58.1% for AGIs below $25k , 80.3% for AGIs $25k-50k , 131.6% for AGIs $50k-75k , 220.1% for AGIs $75k-100k , 474.1% for AGIs $100k-200k , 11095.0% for AGIs over 200k ) Net capital gain/loss in AGI: +$66,126 (reported on 34.8% of returns )Here:
+$66,126State:
+$18,919
(% of AGI for various income ranges: 40.9% for AGIs below $25k , 76.4% for AGIs $25k-50k , 121.6% for AGIs $50k-75k , 270.9% for AGIs $75k-100k , 647.8% for AGIs $100k-200k , 37969.2% for AGIs over 200k ) Profit/loss from business: +$29,229 (reported on 18.4% of returns )Here:
+$29,229State:
+$13,744
(% of AGI for various income ranges: 115.0% for AGIs below $25k , 211.5% for AGIs $25k-50k , 253.6% for AGIs $50k-75k , 287.3% for AGIs $75k-100k , 890.3% for AGIs $100k-200k , 6226.0% for AGIs over 200k ) Taxable individual retirement arrangement distribution: $28,989 (reported on 9.6% of returns )43054:
$28,989Ohio:
$18,876
(% of AGI for various income ranges: 60.8% for AGIs below $25k , 156.5% for AGIs $25k-50k , 235.5% for AGIs $50k-75k , 473.0% for AGIs $75k-100k , 718.6% for AGIs $100k-200k , 2121.7% for AGIs over 200k ) Self-employed (Keogh) retirement plans: $32,933 (reported on 2.0% of returns )43054:
$32,933Ohio:
$24,898
(% of AGI for various income ranges: 76.7% for AGIs $100k-200k , 995.5% for AGIs over 200k ) Total itemized deductions: $39,268 (reported on 19.6% of returns )Here:
$39,268State:
$33,869
(% of AGI for various income ranges: 78.3% for AGIs below $25k , 171.6% for AGIs $25k-50k , 332.2% for AGIs $50k-75k , 684.0% for AGIs $75k-100k , 1264.4% for AGIs $100k-200k , 9145.4% for AGIs over 200k ) Charity contributions: $17,020 (reported on 16.5% of returns )Here:
$17,020State:
$14,577
(% of AGI for various income ranges: 7.6% for AGIs below $25k , 18.2% for AGIs $25k-50k , 53.7% for AGIs $50k-75k , 112.6% for AGIs $75k-100k , 256.7% for AGIs $100k-200k , 4139.2% for AGIs over 200k ) Taxes paid: $9,089 (reported on 19.6% of returns )(% of AGI for various income ranges: 21.7% for AGIs below $25k , 37.2% for AGIs $25k-50k , 101.8% for AGIs $50k-75k , 238.5% for AGIs $75k-100k , 409.3% for AGIs $100k-200k , 1767.6% for AGIs over 200k ) Earned income credit: $1,689 (reported on 4.6% of returns )(% of AGI for various income ranges: 39.4% for AGIs below $25k , 23.0% for AGIs $25k-50k ) Percentage of individuals using paid preparers for their 2020 taxes: 93.9%(% for various income ranges: 91.5% for AGIs below $25k , 94.4% for AGIs $25k-50k , 94.7% for AGIs $50k-75k , 94.7% for AGIs $75k-100k , 93.9% for AGIs $100k-200k , 95.2% for AGIs over 200k )
Averages for the 2012 tax year for zip code 43054, filed in 2013:
Average Adjusted Gross Income (AGI) in 2012: $210,532 (Individual Income Tax Returns) Here:
$210,532State:
$54,926
Salary/wage: $136,454 (reported on 87.7% of returns )Here:
$136,454State:
$45,869
(% of AGI for various income ranges: 75.5% for AGIs below $25k , 83.6% for AGIs $25k-50k , 80.4% for AGIs $50k-75k , 79.5% for AGIs $75k-100k , 82.9% for AGIs $100k-200k , 47.8% for AGIs over 200k ) Taxable interest for individuals: $5,697 (reported on 45.7% of returns )This zip code:
$5,697Ohio:
$1,297
(% of AGI for various income ranges: 1.6% for AGIs below $25k , 0.5% for AGIs $25k-50k , 0.6% for AGIs $50k-75k , 0.4% for AGIs $75k-100k , 0.5% for AGIs $100k-200k , 1.5% for AGIs over 200k ) Ordinary dividends: $12,145 (reported on 37.1% of returns )(% of AGI for various income ranges: 4.3% for AGIs below $25k , 1.0% for AGIs $25k-50k , 1.3% for AGIs $50k-75k , 1.5% for AGIs $75k-100k , 1.3% for AGIs $100k-200k , 2.4% for AGIs over 200k ) Net capital gain/loss in AGI: +$35,191 (reported on 31.8% of returns )Here:
+$35,191State:
+$11,232
(% of AGI for various income ranges: 0.4% for AGIs below $25k , 0.3% for AGIs $25k-50k , 0.4% for AGIs $50k-75k , 0.6% for AGIs $75k-100k , 1.1% for AGIs $100k-200k , 7.0% for AGIs over 200k ) Profit/loss from business: +$35,282 (reported on 18.0% of returns )Here:
+$35,282State:
+$12,773
(% of AGI for various income ranges: 7.1% for AGIs below $25k , 2.8% for AGIs $25k-50k , 3.3% for AGIs $50k-75k , 4.2% for AGIs $75k-100k , 4.3% for AGIs $100k-200k , 2.6% for AGIs over 200k ) Taxable individual retirement arrangement distribution: $28,408 (reported on 10.1% of returns )43054:
$28,408Ohio:
$14,511
(% of AGI for various income ranges: 3.8% for AGIs below $25k , 2.2% for AGIs $25k-50k , 2.6% for AGIs $50k-75k , 2.3% for AGIs $75k-100k , 1.9% for AGIs $100k-200k , 1.0% for AGIs over 200k ) Self-employment retirement plans: $25,642 (reported on 2.4% of returns )43054:
$25,642Ohio:
$20,257
(% of AGI for various income ranges: 0.3% for AGIs $50k-75k , 0.3% for AGIs $100k-200k , 0.3% for AGIs over 200k ) Total itemized deductions: $43,375 (13% of AGI, reported on 59.5% of returns )Here:
$43,375State:
$21,278
Here:
13.1% of AGIState:
18.8% of AGI
(% of AGI for various income ranges: 17.1% for AGIs below $25k , 11.7% for AGIs $25k-50k , 16.3% for AGIs $50k-75k , 18.2% for AGIs $75k-100k , 19.3% for AGIs $100k-200k , 10.3% for AGIs over 200k ) Charity contributions: $6,672 (reported on 50.7% of returns )(% of AGI for various income ranges: 1.2% for AGIs below $25k , 0.9% for AGIs $25k-50k , 1.7% for AGIs $50k-75k , 1.7% for AGIs $75k-100k , 2.0% for AGIs $100k-200k , 1.6% for AGIs over 200k ) Taxes paid: $28,684 (reported on 59.4% of returns )43054:
$28,684State:
$9,568
(% of AGI for various income ranges: 5.1% for AGIs below $25k , 4.5% for AGIs $25k-50k , 6.7% for AGIs $50k-75k , 9.0% for AGIs $75k-100k , 10.3% for AGIs $100k-200k , 7.9% for AGIs over 200k ) Earned income credit: $1,763 (reported on 3.8% of returns )(% of AGI for various income ranges: 2.5% for AGIs below $25k , 0.2% for AGIs $25k-50k ) Percentage of individuals using paid preparers for their 2012 taxes: 52.8%(% for various income ranges: 45.5% for AGIs below $25k , 41.9% for AGIs $25k-50k , 48.7% for AGIs $50k-75k , 54.5% for AGIs $75k-100k , 53.1% for AGIs $100k-200k , 75.3% for AGIs over 200k )
Averages for the 2004 tax year for zip code 43054, filed in 2005:
Average Adjusted Gross Income (AGI) in 2004: $128,088 (Individual Income Tax Returns) Here:
$128,088State:
$44,480
Salary/wage: $110,127 (reported on 88.0% of returns )Here:
$110,127State:
$39,198
(% of AGI for various income ranges: 77.5% for AGIs $10k-25k , 86.8% for AGIs $25k-50k , 85.7% for AGIs $50k-75k , 84.9% for AGIs $75k-100k , 71.7% for AGIs over 100k ) Taxable interest for individuals: $2,404 (reported on 58.8% of returns )This zip code:
$2,404Ohio:
$1,532
(% of AGI for various income ranges: 2.4% for AGIs $10k-25k , 0.9% for AGIs $25k-50k , 0.7% for AGIs $50k-75k , 0.8% for AGIs $75k-100k , 1.1% for AGIs over 100k ) Taxable dividends: $7,573 (reported on 41.8% of returns )(% of AGI for various income ranges: 1.8% for AGIs $10k-25k , 0.9% for AGIs $25k-50k , 1.0% for AGIs $50k-75k , 1.1% for AGIs $75k-100k , 2.7% for AGIs over 100k ) Net capital gain/loss: +$25,665 (reported on 37.4% of returns )Here:
+$25,665State:
+$8,582
(% of AGI for various income ranges: -0.6% for AGIs $10k-25k , 0.8% for AGIs $25k-50k , 1.0% for AGIs $50k-75k , 1.8% for AGIs $75k-100k , 9.1% for AGIs over 100k ) Profit/loss from business: +$26,419 (reported on 18.7% of returns )Here:
+$26,419State:
+$10,813
(% of AGI for various income ranges: 6.3% for AGIs $10k-25k , 3.5% for AGIs $25k-50k , 3.8% for AGIs $50k-75k , 3.6% for AGIs $75k-100k , 3.9% for AGIs over 100k ) IRA payment deduction: $3,074 (reported on 2.5% of returns )(% of AGI for various income ranges: 0.3% for AGIs $10k-25k , 0.2% for AGIs $25k-50k , 0.1% for AGIs $50k-75k , 0.1% for AGIs $75k-100k , 0.0% for AGIs over 100k ) Self-employed pension: $20,245 (reported on 2.8% of returns )(% of AGI for various income ranges: 0.4% for AGIs $10k-25k , 0.2% for AGIs $50k-75k , 0.1% for AGIs $75k-100k , 0.5% for AGIs over 100k ) Total itemized deductions: $35,998 (19% of AGI, reported on 62.3% of returns )Here:
$35,998State:
$17,503
Here:
18.7% of AGIState:
20.8% of AGI
(% of AGI for various income ranges: 14.5% for AGIs $10k-25k , 15.5% for AGIs $25k-50k , 21.4% for AGIs $50k-75k , 22.6% for AGIs $75k-100k , 16.7% for AGIs over 100k ) Charity contributions deductions: $5,492 (3% of AGI, reported on 55.5% of returns )Here:
2.7% of AGIState:
3.4% of AGI
(% of AGI for various income ranges: 1.2% for AGIs $10k-25k , 1.4% for AGIs $25k-50k , 2.0% for AGIs $50k-75k , 2.2% for AGIs $75k-100k , 2.5% for AGIs over 100k ) Total tax: $28,870 (reported on 88.0% of returns )43054:
$28,870State:
$6,781
(% of AGI for various income ranges: 6.0% for AGIs $10k-25k , 8.8% for AGIs $25k-50k , 10.4% for AGIs $50k-75k , 10.6% for AGIs $75k-100k , 22.3% for AGIs over 100k ) Earned income credit: $1,213 (reported on 3.1% of returns )Percentage of individuals using paid preparers for their 2004 taxes: 54.3%(% for various income ranges: 52.1% for AGIs below $10k , 47.4% for AGIs $10k-25k , 46.8% for AGIs $25k-50k , 53.0% for AGIs $50k-75k , 52.8% for AGIs $75k-100k , 63.8% for AGIs over 100k )
Estimated median household income in 2022: This zip code:
$137,647Ohio:
$65,720
Nearest zip codes: 43004 ,
43230 ,
43081 ,
43082 ,
43068 ,
43213 .
New Albany Zip Code Map
Percentage of family households: This zip code:
51.5%Ohio:
43.3%
Percentage of households with unmarried partners: This zip code:
6.7%Ohio:
44.6%
Likely homosexual households (counted as self-reported same-sex unmarried-partner households)
Lesbian couples: 0.1% of all households Gay men: 0.0% of all households
Household received Food Stamps/SNAP in the past 12 months: 41Household did not receive Food Stamps/SNAP in the past 12 months: 11,149
Women who had a birth in the past 12 months: 544 (438 now married , 111 unmarried) Women who did not have a birth in the past 12 months: 6,510 (3,531 now married , 2,976 unmarried)
Housing units in zip code 43054 with a mortgage: 5,800 (859
second mortgage , 102
home equity loan , 717
both second mortgage and home equity loan )
Houses without a mortgage: 119
Median monthly owner costs for units with a mortgage: $2,568
Median monthly owner costs for units without a mortgage: $1,146
Residents with income below the poverty level in 2022:
This zip code:
2.3%Whole state:
13.4%
Residents with income below 50% of the poverty level in 2022:
This zip code:
0.8%Whole state:
7.0%
Median number of rooms in houses and condos: Median number of rooms in apartments: Notable locations in this zip code not listed on our city pages
Click to draw/clear zip code borders Notable locations in zip code 43054: (A) , The Golf Club (B) , The Offices at North High Place (C) , Winding Hollow Country Club (D) , Plain Township Fire Department Station 121 (E) , New Albany Village Hall (F) , Kerr-Harrington House Museum (G) . Display/hide their locations on the map
Church in zip code 43054: (A) . Display/hide its location on the map
Cemeteries: (1) , Maplewood Cemetery (2) , New Albany Cemetery (3) , Wagner Cemetery (4) . Display/hide their locations on the map
Streams, rivers, and creeks: (A) , Rose Run (B) . Display/hide their locations on the map
Parks in zip code 43054 include: (1) , Rose Run Park (2) . Display/hide their locations on the map
Year house built (houses)
86 2020 or later2,912 2010 to 20195,964 2000 to 20092,120 1990 to 1999196 1980 to 1989463 1970 to 1979148 1960 to 196995 1950 to 195924 1940 to 1949164 1939 or earlier
Zip code 43054 household income distribution in 2022 130 Less than $10,00025 $10,000 to $14,99983 $15,000 to $19,999216 $20,000 to $24,999164 $25,000 to $29,999136 $30,000 to $34,99977 $35,000 to $39,999145 $40,000 to $44,999154 $45,000 to $49,999420 $50,000 to $59,9991,140 $60,000 to $74,9991,163 $75,000 to $99,9991,054 $100,000 to $124,9991,183 $125,000 to $149,9991,144 $150,000 to $199,9993,940 $200,000 or moreEstimate of home value of owner-occupied houses/condos in 2022 in zip code 43054 13 Less than $10,00029 $20,000 to $24,99915 $25,000 to $29,99925 $30,000 to $34,99913 $40,000 to $49,99915 $70,000 to $79,99911 $90,000 to $99,99930 $100,000 to $124,999133 $125,000 to $149,999127 $150,000 to $174,999170 $175,000 to $199,999485 $200,000 to $249,999473 $250,000 to $299,9991,716 $300,000 to $399,9992,225 $400,000 to $499,9992,170 $500,000 to $749,999876 $750,000 to $999,999180 $1,000,000 to $1,499,999110 $1,500,000 to $1,999,999247 $2,000,000 or moreRent paid by renters in 2022 in zip code 43054 16 $500 to $54922 $550 to $59915 $600 to $64948 $800 to $899169 $900 to $999780 $1,000 to $1,249980 $1,250 to $1,4991,192 $1,500 to $1,999475 $2,000 to $2,499108 $2,500 to $2,99916 $3,500 or more124 No cash rent
Median gross rent in 2022: $1,679.
Median price asked for vacant for-sale houses and condos in 2022: $905,734.
Estimated median house (or condo) value in 2022 for: White Non-Hispanic householders: $489,604Black or African American householders: $449,679Asian householders: $676,842Two or more races householders: $322,674Hispanic or Latino householders: $556,032Estimated median house or condo value in 2022: $494,940
43054:
$494,940Ohio:
$204,100
Lower value quartile - upper value quartile: $348,670 - $714,960
Mean price in 2022: Detached houses: $633,450Here:
$633,450State:
$254,366
Townhouses or other attached units: $285,882Here:
$285,882State:
$225,733
In 3-to-4-unit structures: $270,114Here:
$270,114State:
$203,002
In 5-or-more-unit structures: $213,591Here:
$213,591State:
$211,593
Housing units in structures:
One, detached: 6,857One, attached: 1,224Two: 863 or 4: 8275 to 9: 1,35910 to 19: 89420 to 49: 24950 or more: 174Boats, RVs, vans, etc.: 19Unemployment : 1.8%
Means of transportation to work in zip code 43054 70.0% 11,104 Drove a car alone4.2% 662 Carpooled0.2% 34 Bus or trolley bus0.9% 149 Walked1.1% 167 Other means27.4% 4,355 Worked at homeTravel time to work (commute) in zip code 43054 322 Less than 5 minutes1,154 5 to 9 minutes1,029 10 to 14 minutes1,412 15 to 19 minutes2,664 20 to 24 minutes1,949 25 to 29 minutes1,656 30 to 34 minutes419 35 to 39 minutes407 40 to 44 minutes598 45 to 59 minutes253 60 to 89 minutes269 90 or more minutes
Percentage of zip code residents living and working in this county: 84.3%
Household type by relationship:
Households: 28,506
Male householders: 5,976 (1,416 living alone ), Female householders: 5,249 (1,392 living alone )6,581 spouses (6,498 opposite-sex spouses ), 886 unmarried partners , (828 opposite-sex unmarried partners ), 8,543 children (8,130 natural , 178 adopted , 239 stepchildren ), 130 grandchildren , 148 brothers or sisters , 244 parents , 0 foster children , 73 other relatives , 646 non-relatives In group quarters: 61 (-1 institutionalized population )
Size of family households: 2,808 2-persons , 1,822 3-persons , 1,836 4-persons , 682 5-persons , 237 6-persons , 56 7-or-more-persons
Size of nonfamily households: 2,805 1-person , 916 2-persons , 14 7-or-more-persons
6,566 married couples with children. single-parent households (290 men , 652 women ).
86.6% of residents of 43054 zip code speak English at home. of residents speak Spanish at home (62% very well, 36% well, 2% not well ).of residents speak other Indo-European language at home (86% very well, 12% well, 3% not at all ).of residents speak Asian or Pacific Island language at home (52% very well, 11% well, 36% not well, 1% not at all ).of residents speak other language at home (78% very well, 12% well, 9% not well ).
Foreign born population: 3,464 (12.2%)
(53.0%
of them are naturalized citizens )
This zip code:
12.2%Whole state:
5.0%
16% Bhutan 7% Uzbekistan 7% Lebanon 7% Thailand 6% Sweden 4% Cabo Verde 4% Pakistan 13% German 10% English 7% American 5% Italian 4% Irish 4% European 3% Polish
Year of entry for the foreign-born population
1,615 2010 or later 807 2000 to 2009 719 1990 to 1999 689 Before 1990
Facilities with environmental interests located in this zip code:
AMERITECH (14 W MAIN ST in NEW ALBANY, OH)
STATE MASTER (Ohio general info) - -25-4811-227-23, EPCRA (Resource Conservation and Recovery Act (tracking hazardous waste)) Alternative names: OHIO BELL TEL CO NEW ALBAINY 855 CO
ACME LIQUID WASTE SERVICE (7891 PETER HOOVER RD in NEW ALBANY, OH)
STATE MASTER (Ohio general info) - RCRA-OHD000772723, HAZARDOUS WASTE PROGRAM TRANSPORTER (Resource Conservation and Recovery Act (tracking hazardous waste)) Organizations: VIRGIL L STEBLETON SR (CONTACT/OWNER)
Housing units lacking complete plumbing facilities: 0.2%
Housing units lacking complete kitchen facilities: 0.4%
66.1% Utility gas 30.2% Electricity 2.1% Bottled, tank, or LP gas 1.4% Fuel oil, kerosene, etc.
Population in 1990: 3,520. Population change in the 1990s: +4,827 (+137.1%).
Place of birth for U.S.-born residents:
This state: 16,921Northeast: 2,454Midwest: 2,293South: 2,077West: 1,028
39% of the 43054 zip code residents lived in the same house 5 years ago.
Out of people who lived in different houses, 53% lived in this county.
Out of people who lived in different counties, 50% lived in Ohio.
87% of the 43054 zip code residents lived in the same house 1 year ago.
Out of people who lived in different houses, 57% moved from this county.
Out of people who lived in different houses, 22% moved from different county within same state.
Out of people who lived in different houses, 17% moved from different state.
Out of people who lived in different houses, 0% moved from abroad.
Private vs. public school enrollment:
Students in private schools in grades 1 to 8 (elementary and middle school): 425
Students in private schools in grades 9 to 12 (high school): 172
Students in private undergraduate colleges: 263
Occupation by median earnings in the past 12 months ($)
137,300 Management occupations 114,684 Fire fighting and prevention, and other protective service workers including supervisors 112,469 Health diagnosing and treating practitioners and other technical occupations 104,048 Legal occupations 100,049 Arts, design, entertainment, sports, and media occupations 94,159 Computer and mathematical occupations
Companies with federal contracts located in this zip code:
CARL JOOSS (42 N HIGH ST in NEW ALBANY, OH; small business) in 6 contracts from 2003 to 2006
Contracts for Miscellaneous Ammunition, Badges and Insignia, Training Aids, Guns, through 30 mm, and more by Air Force, Navy, ArmySigned by year: 2000: $0; 2001: $0; 2002: $0; 2003: $28,320; 2004: $9,715; 2005: $19,433; 2006: $23,747.
Biggest contracts: with Air Force for Miscellaneous Ammunition. Signed on 2003-07-01. Completion date: 2003-08-01.
with Navy for Badges and Insignia. Signed on 2006-02-06. Completion date: 2006-02-28.
with Navy for Training Aids. Signed on 2005-09-19. Completion date: 2005-09-30.
with Army for Guns, through 30 mm. Signed on 2004-08-06. Completion date: 2004-09-27.
AMERILINK CORP (6525 WEST CAMPUS OVAL, SUI in NEW ALBANY, OH) in 3 contracts in 2003
$50,292 with Department of Defense for Cable, Cord, and Wire Assemblies: Communications Equipment. Signed on 2003-03-17. Completion date: 2003-06-09.
with Navy for Communications Security Equipment and Components. Taking place in CA. Signed on 2003-11-19. Completion date: 2003-12-19.
, same as above. Signed on 2003-11-20. Completion date: 2003-12-19.
CASTLESTONE GROUP INC / (39 EAST MAIN ST in NEW ALBANY, OH; small business) in 2 contracts in 2001
$53,950 with Defense Logistics Agency for Nuts and Washers. Signed on 2001-06-07. Completion date: 2001-10-11.
, same as above. Signed on 2001-06-07. Completion date: 2001-10-11.
Top industries in this zip code by the number of employees in 2005:
Management of Companies and Enterprises: Corporate, Subsidiary, and Regional Managing Offices (over 1000 employees: 1 establishment, 500-999 employees: 2 establishments, 250-499 employees: 1 establishment, 20-49 employees: 1 establishment, 1-4 employees: 1 establishment)Finance and Insurance: Credit Card Issuing (over 1000: 1)Finance and Insurance: Direct Health and Medical Insurance Carriers (over 1000: 1)Professional, Scientific, and Technical Services: Engineering Services (250-499: 1, 1-4: 1)Health Care and Social Assistance: Specialty (except Psychiatric and Substance Abuse) Hospitals (250-499: 1)Accommodation and Food Services: Full-Service Restaurants (50-99: 4, 10-19: 1, 5-9: 1, 1-4: 1)Arts, Entertainment, and Recreation: Golf Courses and Country Clubs (100-249: 1, 50-99: 1, 20-49: 1, 10-19: 1)Administrative and Support and Waste Management and Remediation Services: Professional Employer Organizations (100-249: 1, 50-99: 1)
People in group quarters in 2000:
4 people in other noninstitutional group quarters
Fatal accident statistics in 2014:
Fatal accident count: 4Vehicles involved in fatal accidents: 7Fatal accidents caused by drunken drivers: 0Fatalities: 4Persons involved in fatal accidents: 10Pedestrians involved in fatal accidents: 0
Fatal accident statistics in 2013:
Fatal accident count: 2Vehicles involved in fatal accidents: 2Fatal accidents caused by drunken drivers: 1Fatalities: 2Persons involved in fatal accidents: 3Pedestrians involved in fatal accidents: 0
Home Mortgage Disclosure Act Aggregated Statistics For Year 2009(Based on 4 partial tracts) A) FHA, FSA/RHS & VA B) Conventional C) Refinancings D) Home Improvement Loans F) Non-occupant Loans on Number Average Value Number Average Value Number Average Value Number Average Value Number Average Value
LOANS ORIGINATED 358 $173,812 470 $256,343 1,582 $249,008 21 $112,818 40 $222,386 APPLICATIONS APPROVED, NOT ACCEPTED 24 $186,244 44 $229,396 131 $251,917 5 $21,666 5 $205,408 APPLICATIONS DENIED 36 $193,564 50 $293,923 330 $245,920 16 $60,496 25 $202,714 APPLICATIONS WITHDRAWN 36 $200,225 52 $336,897 280 $223,480 5 $20,452 7 $124,276 FILES CLOSED FOR INCOMPLETENESS 6 $171,275 6 $285,422 64 $235,810 2 $163,105 3 $600,553
Aggregated Statistics For Year 2008(Based on 4 partial tracts) A) FHA, FSA/RHS & VA B) Conventional C) Refinancings D) Home Improvement Loans E) Loans on Dwellings For 5+ Families F) Non-occupant Loans on Number Average Value Number Average Value Number Average Value Number Average Value Number Average Value Number Average Value
LOANS ORIGINATED 297 $170,771 580 $267,648 556 $285,450 36 $82,347 4 $3,118,305 96 $166,171 APPLICATIONS APPROVED, NOT ACCEPTED 33 $187,525 66 $278,227 89 $281,614 7 $36,709 0 $0 10 $252,776 APPLICATIONS DENIED 22 $177,415 61 $246,436 292 $230,044 29 $49,143 0 $0 20 $219,104 APPLICATIONS WITHDRAWN 17 $205,998 57 $274,703 150 $269,067 6 $126,788 0 $0 8 $186,499 FILES CLOSED FOR INCOMPLETENESS 2 $97,795 9 $347,846 39 $289,326 4 $97,305 0 $0 2 $138,375
Aggregated Statistics For Year 2007(Based on 4 partial tracts) A) FHA, FSA/RHS & VA B) Conventional C) Refinancings D) Home Improvement Loans E) Loans on Dwellings For 5+ Families F) Non-occupant Loans on G) Loans On Manufactured Number Average Value Number Average Value Number Average Value Number Average Value Number Average Value Number Average Value Number Average Value
LOANS ORIGINATED 205 $150,239 910 $252,080 538 $279,024 62 $128,541 0 $0 73 $213,789 1 $263,710 APPLICATIONS APPROVED, NOT ACCEPTED 12 $169,852 105 $291,156 106 $224,797 21 $91,168 0 $0 13 $266,285 0 $0 APPLICATIONS DENIED 13 $162,282 132 $265,496 368 $235,238 52 $91,563 0 $0 35 $234,102 0 $0 APPLICATIONS WITHDRAWN 7 $179,689 79 $331,989 119 $254,051 8 $67,144 1 $539,030 6 $1,118,053 0 $0 FILES CLOSED FOR INCOMPLETENESS 1 $300,370 13 $265,372 52 $355,677 1 $35,260 0 $0 3 $157,473 0 $0
Aggregated Statistics For Year 2006(Based on 4 partial tracts) A) FHA, FSA/RHS & VA B) Conventional C) Refinancings D) Home Improvement Loans F) Non-occupant Loans on G) Loans On Manufactured Number Average Value Number Average Value Number Average Value Number Average Value Number Average Value Number Average Value
LOANS ORIGINATED 156 $137,754 1,151 $245,823 625 $243,123 62 $66,514 89 $185,138 1 $267,940 APPLICATIONS APPROVED, NOT ACCEPTED 21 $146,029 172 $268,625 163 $207,986 9 $44,324 7 $209,343 3 $151,830 APPLICATIONS DENIED 20 $147,154 219 $320,530 336 $261,377 50 $109,729 12 $170,413 2 $130,125 APPLICATIONS WITHDRAWN 8 $154,064 128 $283,952 181 $273,537 13 $109,141 13 $169,755 0 $0 FILES CLOSED FOR INCOMPLETENESS 3 $167,343 20 $372,095 72 $247,293 10 $198,103 2 $305,365 0 $0
Aggregated Statistics For Year 2005(Based on 4 partial tracts) A) FHA, FSA/RHS & VA B) Conventional C) Refinancings D) Home Improvement Loans F) Non-occupant Loans on G) Loans On Manufactured Number Average Value Number Average Value Number Average Value Number Average Value Number Average Value Number Average Value
LOANS ORIGINATED 256 $131,517 1,425 $259,697 817 $251,555 85 $65,924 93 $221,260 1 $29,520 APPLICATIONS APPROVED, NOT ACCEPTED 28 $139,660 146 $268,617 120 $233,823 12 $48,966 15 $265,470 1 $81,790 APPLICATIONS DENIED 6 $159,107 123 $265,508 347 $255,244 60 $43,453 15 $126,253 3 $38,233 APPLICATIONS WITHDRAWN 6 $173,318 143 $276,090 277 $268,747 44 $170,351 18 $158,848 0 $0 FILES CLOSED FOR INCOMPLETENESS 1 $205,890 20 $168,121 65 $229,389 5 $514,188 3 $178,627 0 $0
Aggregated Statistics For Year 2004(Based on 4 partial tracts) A) FHA, FSA/RHS & VA B) Conventional C) Refinancings D) Home Improvement Loans E) Loans on Dwellings For 5+ Families F) Non-occupant Loans on G) Loans On Manufactured Number Average Value Number Average Value Number Average Value Number Average Value Number Average Value Number Average Value Number Average Value
LOANS ORIGINATED 416 $147,582 1,729 $224,521 954 $272,617 59 $81,263 2 $361,380 100 $221,779 1 $28,200 APPLICATIONS APPROVED, NOT ACCEPTED 37 $159,275 188 $240,924 125 $226,249 13 $78,092 0 $0 7 $135,294 0 $0 APPLICATIONS DENIED 26 $168,463 127 $264,764 294 $245,206 67 $45,853 0 $0 16 $169,920 0 $0 APPLICATIONS WITHDRAWN 8 $200,446 191 $220,516 189 $264,252 16 $90,336 0 $0 14 $130,831 0 $0 FILES CLOSED FOR INCOMPLETENESS 3 $172,983 28 $395,700 81 $224,434 7 $62,331 0 $0 0 $0 0 $0
Aggregated Statistics For Year 2003(Based on 4 partial tracts) A) FHA, FSA/RHS & VA B) Conventional C) Refinancings D) Home Improvement Loans E) Loans on Dwellings For 5+ Families F) Non-occupant Loans on Number Average Value Number Average Value Number Average Value Number Average Value Number Average Value Number Average Value
LOANS ORIGINATED 347 $146,324 1,032 $261,150 2,535 $260,862 53 $40,572 3 $9,408,853 76 $174,928 APPLICATIONS APPROVED, NOT ACCEPTED 45 $169,475 105 $259,512 237 $260,166 10 $28,454 0 $0 5 $120,462 APPLICATIONS DENIED 24 $175,808 64 $179,659 314 $223,376 23 $27,839 0 $0 12 $150,245 APPLICATIONS WITHDRAWN 15 $168,004 104 $264,136 234 $240,048 11 $92,845 0 $0 4 $263,788 FILES CLOSED FOR INCOMPLETENESS 0 $0 29 $301,483 98 $255,631 2 $39,535 0 $0 7 $189,370
Aggregated Statistics For Year 2002(Based on 2 partial tracts) A) FHA, FSA/RHS & VA B) Conventional C) Refinancings D) Home Improvement Loans F) Non-occupant Loans on Number Average Value Number Average Value Number Average Value Number Average Value Number Average Value
LOANS ORIGINATED 141 $192,357 781 $250,817 1,474 $288,955 28 $30,571 38 $186,035 APPLICATIONS APPROVED, NOT ACCEPTED 11 $201,017 73 $230,944 157 $247,126 4 $242,555 3 $140,080 APPLICATIONS DENIED 6 $188,967 48 $160,498 219 $239,122 25 $39,655 3 $125,977 APPLICATIONS WITHDRAWN 10 $164,993 68 $251,824 144 $228,756 10 $27,499 6 $184,502 FILES CLOSED FOR INCOMPLETENESS 3 $190,377 16 $259,301 71 $292,070 1 $9,870 3 $171,573
Aggregated Statistics For Year 2001(Based on 2 partial tracts) A) FHA, FSA/RHS & VA B) Conventional C) Refinancings D) Home Improvement Loans E) Loans on Dwellings For 5+ Families F) Non-occupant Loans on Number Average Value Number Average Value Number Average Value Number Average Value Number Average Value Number Average Value
LOANS ORIGINATED 154 $188,298 750 $251,104 1,048 $275,752 44 $30,992 4 $742,118 32 $207,960 APPLICATIONS APPROVED, NOT ACCEPTED 4 $193,902 59 $223,433 76 $179,318 20 $22,986 0 $0 3 $145,720 APPLICATIONS DENIED 1 $284,860 59 $192,958 176 $256,560 18 $20,604 0 $0 11 $125,508 APPLICATIONS WITHDRAWN 8 $183,150 52 $213,130 109 $206,652 7 $20,347 0 $0 3 $79,910 FILES CLOSED FOR INCOMPLETENESS 0 $0 16 $154,858 34 $288,179 3 $82,733 0 $0 1 $145,250
Aggregated Statistics For Year 2000(Based on 2 partial tracts) A) FHA, FSA/RHS & VA B) Conventional C) Refinancings D) Home Improvement Loans E) Loans on Dwellings For 5+ Families F) Non-occupant Loans on Number Average Value Number Average Value Number Average Value Number Average Value Number Average Value Number Average Value
LOANS ORIGINATED 89 $164,122 694 $273,479 165 $241,264 48 $37,165 1 $965,990 30 $274,378 APPLICATIONS APPROVED, NOT ACCEPTED 7 $153,510 51 $250,103 32 $185,970 16 $39,486 0 $0 3 $200,720 APPLICATIONS DENIED 14 $149,280 27 $224,222 104 $165,658 24 $26,206 0 $0 4 $143,488 APPLICATIONS WITHDRAWN 24 $155,298 47 $237,754 41 $234,437 6 $78,972 0 $0 3 $151,830 FILES CLOSED FOR INCOMPLETENESS 0 $0 11 $232,555 4 $323,992 1 $80,380 0 $0 0 $0
Aggregated Statistics For Year 1999(Based on 2 partial tracts) A) FHA, FSA/RHS & VA B) Conventional C) Refinancings D) Home Improvement Loans E) Loans on Dwellings For 5+ Families F) Non-occupant Loans on Number Average Value Number Average Value Number Average Value Number Average Value Number Average Value Number Average Value
LOANS ORIGINATED 43 $139,132 320 $262,264 236 $211,500 30 $38,565 1 $4,375,070 18 $158,539 APPLICATIONS APPROVED, NOT ACCEPTED 1 $107,500 27 $240,154 37 $133,060 8 $33,994 0 $0 1 $155,710 APPLICATIONS DENIED 3 $165,973 23 $208,645 58 $200,947 15 $10,300 0 $0 6 $190,385 APPLICATIONS WITHDRAWN 3 $128,643 19 $219,507 44 $193,061 2 $61,330 0 $0 2 $180,865 FILES CLOSED FOR INCOMPLETENESS 0 $0 5 $327,676 12 $164,070 0 $0 0 $0 0 $0
Detailed HMDA statistics for the following Tracts:
0072.00
,
0073.91
Private Mortgage Insurance Companies Aggregated Statistics For Year 2009(Based on 4 partial tracts) A) Conventional B) Refinancings C) Non-occupant Loans on Number Average Value Number Average Value Number Average Value
LOANS ORIGINATED 92 $234,622 47 $244,747 0 $0 APPLICATIONS APPROVED, NOT ACCEPTED 12 $203,680 15 $237,324 3 $141,020 APPLICATIONS DENIED 10 $206,388 13 $287,172 0 $0 APPLICATIONS WITHDRAWN 4 $228,480 6 $197,715 0 $0 FILES CLOSED FOR INCOMPLETENESS 3 $242,083 0 $0 0 $0
Aggregated Statistics For Year 2008(Based on 4 partial tracts) A) Conventional B) Refinancings C) Non-occupant Loans on Number Average Value Number Average Value Number Average Value
LOANS ORIGINATED 188 $233,869 44 $267,125 23 $178,611 APPLICATIONS APPROVED, NOT ACCEPTED 50 $216,894 24 $295,736 5 $135,182 APPLICATIONS DENIED 15 $208,897 8 $281,159 4 $142,078 APPLICATIONS WITHDRAWN 9 $338,004 4 $418,478 2 $132,105 FILES CLOSED FOR INCOMPLETENESS 4 $322,582 3 $224,580 2 $140,850
Aggregated Statistics For Year 2007(Based on 4 partial tracts) A) Conventional B) Refinancings C) Non-occupant Loans on Number Average Value Number Average Value Number Average Value
LOANS ORIGINATED 193 $200,858 43 $257,112 14 $172,157 APPLICATIONS APPROVED, NOT ACCEPTED 17 $205,818 21 $247,985 3 $173,053 APPLICATIONS DENIED 5 $337,316 2 $303,985 1 $101,530 APPLICATIONS WITHDRAWN 5 $143,108 4 $216,290 0 $0 FILES CLOSED FOR INCOMPLETENESS 0 $0 0 $0 0 $0
Aggregated Statistics For Year 2006(Based on 4 partial tracts) A) Conventional B) Refinancings C) Non-occupant Loans on Number Average Value Number Average Value Number Average Value
LOANS ORIGINATED 129 $208,489 23 $257,144 5 $151,538 APPLICATIONS APPROVED, NOT ACCEPTED 22 $230,873 24 $246,577 1 $291,910 APPLICATIONS DENIED 0 $0 0 $0 0 $0 APPLICATIONS WITHDRAWN 7 $210,801 0 $0 0 $0 FILES CLOSED FOR INCOMPLETENESS 0 $0 1 $401,910 0 $0
Aggregated Statistics For Year 2005(Based on 4 partial tracts) A) Conventional B) Refinancings C) Non-occupant Loans on Number Average Value Number Average Value Number Average Value
LOANS ORIGINATED 117 $226,266 46 $213,111 10 $177,110 APPLICATIONS APPROVED, NOT ACCEPTED 18 $234,035 11 $261,627 0 $0 APPLICATIONS DENIED 0 $0 0 $0 0 $0 APPLICATIONS WITHDRAWN 3 $1,018,497 4 $284,155 0 $0 FILES CLOSED FOR INCOMPLETENESS 0 $0 0 $0 0 $0
Aggregated Statistics For Year 2004(Based on 4 partial tracts) A) Conventional B) Refinancings C) Non-occupant Loans on Number Average Value Number Average Value Number Average Value
LOANS ORIGINATED 171 $219,800 81 $224,870 6 $145,852 APPLICATIONS APPROVED, NOT ACCEPTED 41 $251,363 26 $213,318 4 $293,675 APPLICATIONS DENIED 0 $0 0 $0 0 $0 APPLICATIONS WITHDRAWN 18 $219,413 7 $260,133 0 $0 FILES CLOSED FOR INCOMPLETENESS 0 $0 3 $210,120 0 $0
Aggregated Statistics For Year 2003(Based on 4 partial tracts) A) Conventional B) Refinancings C) Non-occupant Loans on Number Average Value Number Average Value Number Average Value
LOANS ORIGINATED 171 $225,704 181 $217,025 7 $173,326 APPLICATIONS APPROVED, NOT ACCEPTED 28 $257,190 53 $228,003 0 $0 APPLICATIONS DENIED 3 $170,687 2 $214,120 0 $0 APPLICATIONS WITHDRAWN 10 $236,382 8 $240,216 1 $373,700 FILES CLOSED FOR INCOMPLETENESS 0 $0 0 $0 0 $0
Aggregated Statistics For Year 2002(Based on 2 partial tracts) A) Conventional B) Refinancings C) Non-occupant Loans on Number Average Value Number Average Value Number Average Value
LOANS ORIGINATED 210 $231,494 117 $212,217 6 $224,222 APPLICATIONS APPROVED, NOT ACCEPTED 18 $278,593 18 $217,249 0 $0 APPLICATIONS DENIED 4 $132,208 3 $306,953 3 $103,413 APPLICATIONS WITHDRAWN 13 $262,514 8 $349,378 0 $0 FILES CLOSED FOR INCOMPLETENESS 0 $0 0 $0 0 $0
Aggregated Statistics For Year 2001(Based on 2 partial tracts) A) Conventional B) Refinancings C) Non-occupant Loans on Number Average Value Number Average Value Number Average Value
LOANS ORIGINATED 192 $216,715 59 $224,724 3 $141,490 APPLICATIONS APPROVED, NOT ACCEPTED 31 $217,262 11 $207,940 0 $0 APPLICATIONS DENIED 0 $0 0 $0 0 $0 APPLICATIONS WITHDRAWN 3 $287,210 3 $196,017 0 $0 FILES CLOSED FOR INCOMPLETENESS 1 $328,580 0 $0 0 $0
Aggregated Statistics For Year 2000(Based on 2 partial tracts) A) Conventional B) Refinancings C) Non-occupant Loans on Number Average Value Number Average Value Number Average Value
LOANS ORIGINATED 158 $211,155 6 $222,577 1 $291,910 APPLICATIONS APPROVED, NOT ACCEPTED 8 $252,426 0 $0 0 $0 APPLICATIONS DENIED 4 $247,138 0 $0 0 $0 APPLICATIONS WITHDRAWN 4 $185,090 1 $217,170 0 $0 FILES CLOSED FOR INCOMPLETENESS 0 $0 0 $0 0 $0
Aggregated Statistics For Year 1999(Based on 2 partial tracts) A) Conventional B) Refinancings C) Non-occupant Loans on Number Average Value Number Average Value Number Average Value
LOANS ORIGINATED 91 $209,075 19 $179,401 3 $102,060 APPLICATIONS APPROVED, NOT ACCEPTED 10 $213,497 5 $173,422 1 $235,290 APPLICATIONS DENIED 4 $321,570 3 $260,553 0 $0 APPLICATIONS WITHDRAWN 1 $299,510 0 $0 0 $0 FILES CLOSED FOR INCOMPLETENESS 0 $0 0 $0 0 $0
Detailed PMIC statistics for the following Tracts:
0072.00
,
0073.91
2002 - 2018 National Fire Incident Reporting System (NFIRS) incidents See full 2006 National Fire Incident Reporting System statistics for zip code 43054, Ohio
Most common first names in zip code 43054 among deceased individuals Name Count Lived (average)
John 32 73.9 years Mary 26 79.7 years James 25 74.1 years William 19 76.6 years Robert 19 71.9 years Charles 18 75.8 years Helen 13 81.3 years George 13 75.3 years Walter 11 76.4 years Dorothy 11 79.0 years
Most common last names in zip code 43054 among deceased individuals Last name Count Lived (average)
Doran 11 84.4 years Smith 11 81.4 years Williams 7 74.2 years Jones 5 78.0 years Sullivan 5 77.8 years Kindler 4 73.5 years Johnson 4 83.0 years Herb 4 81.1 years Garrabrant 4 70.8 years Barnes 4 85.5 years
Businesses in zip code 43054
Name Count Name Count
Blockbuster 1 Starbucks 2 Burger King 1 Subway 2 CVS 1 Tim Hortons 2 FedEx 5 UPS 6 Kroger 1 Walgreens 1 Sprint Nextel 1 Wendy's 1

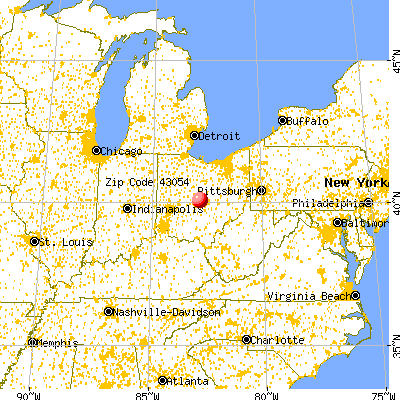


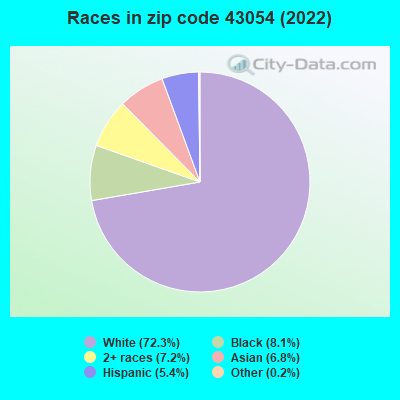


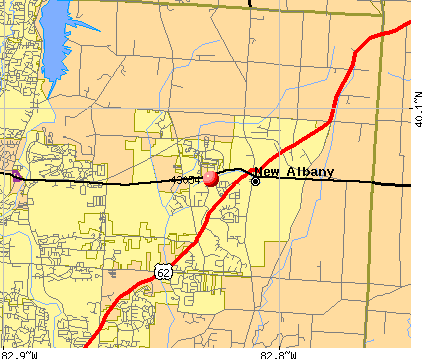 Nearest zip codes: 43004, 43230, 43081, 43082, 43068, 43213.
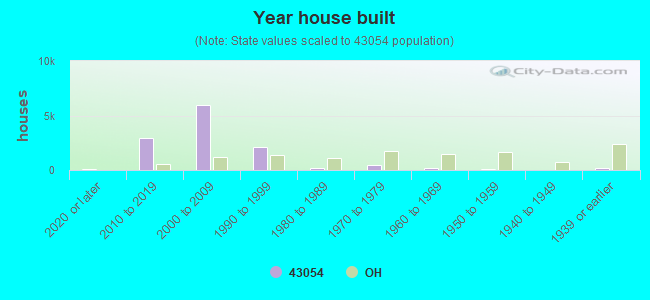

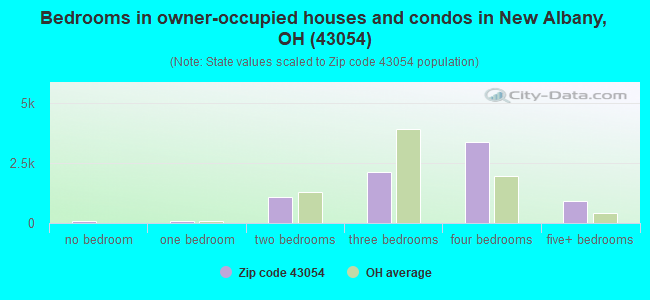
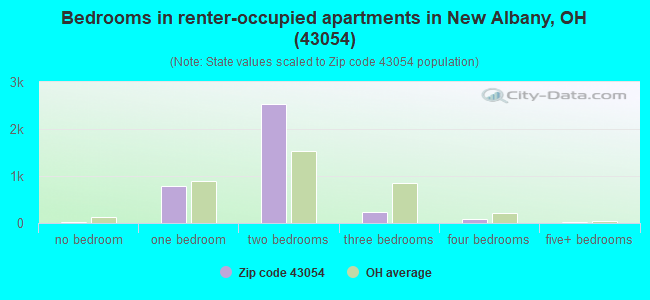
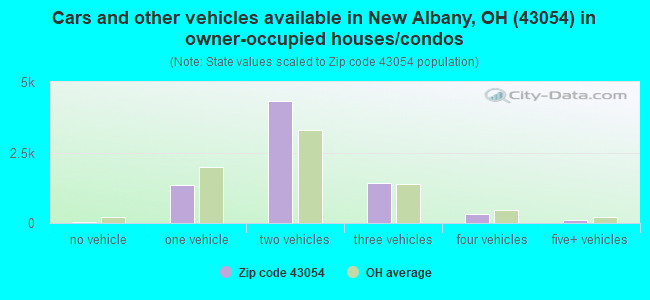
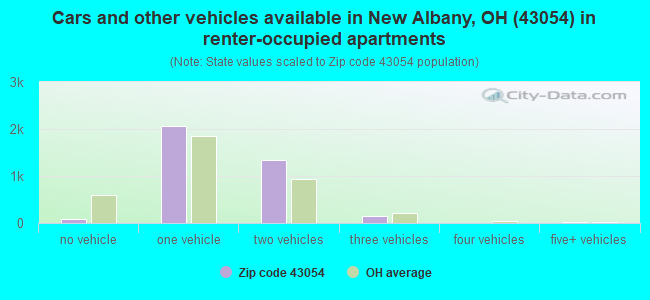


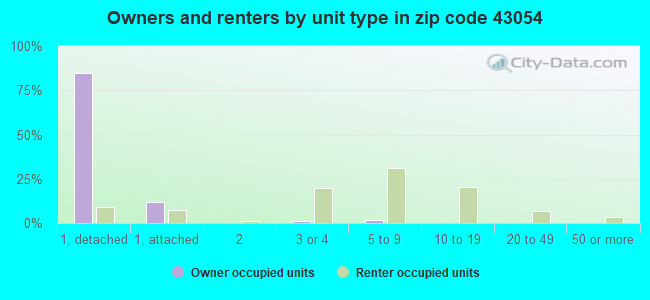
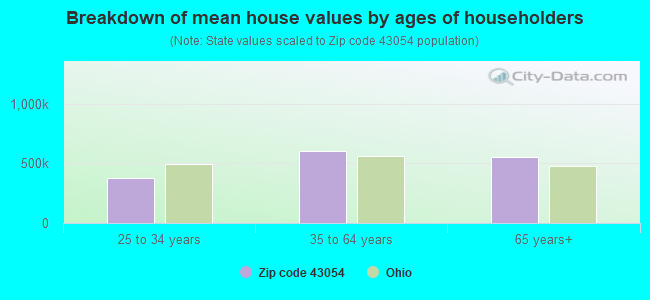


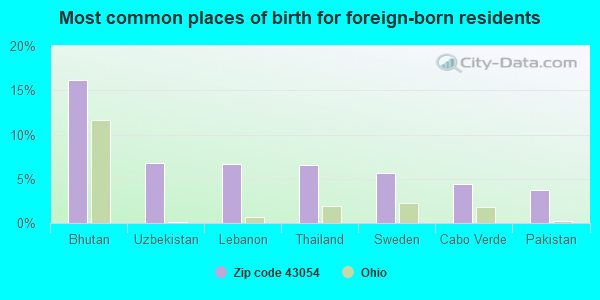
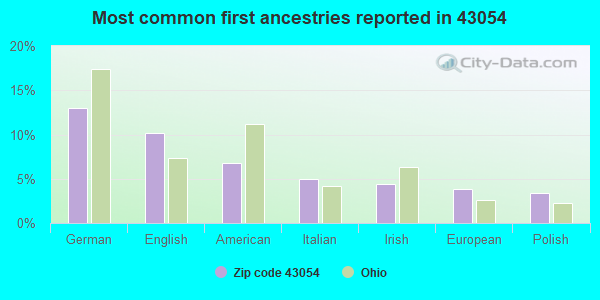
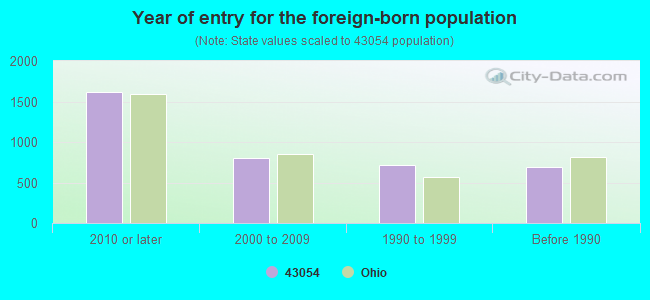
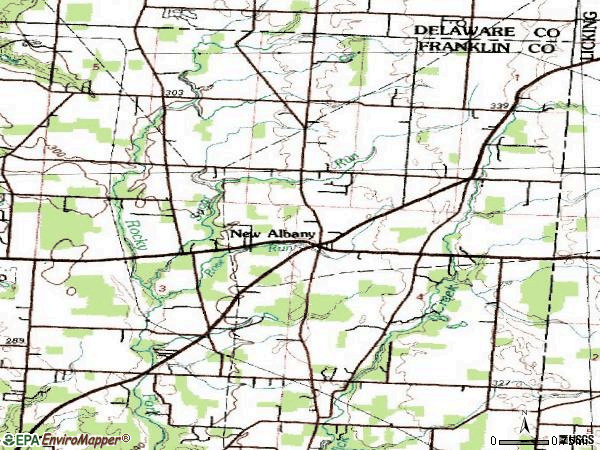

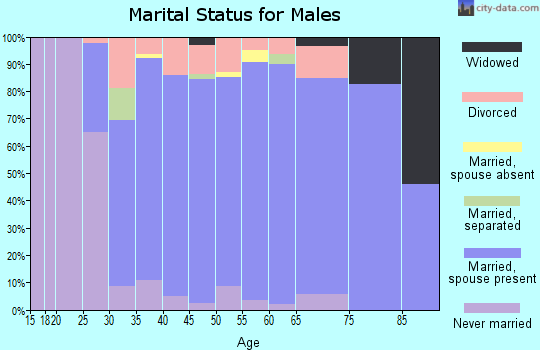
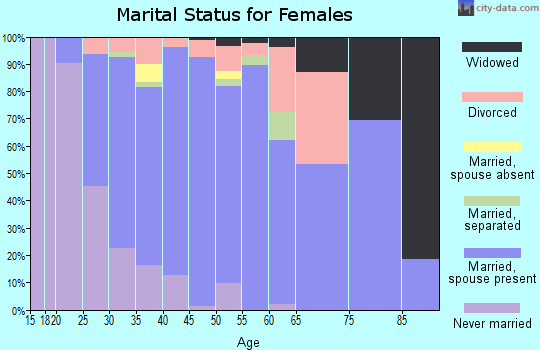
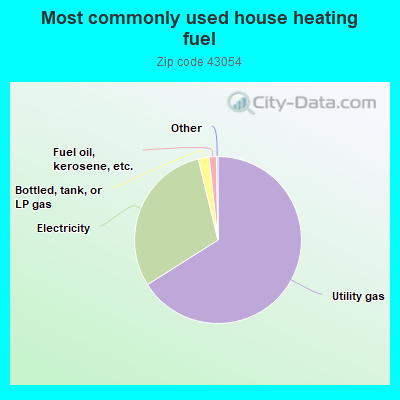
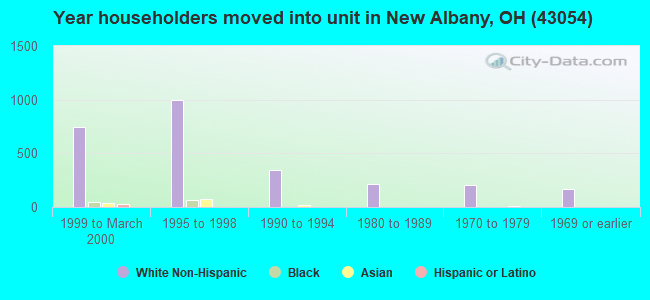
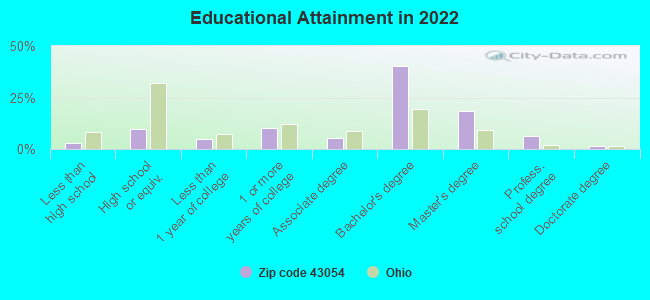
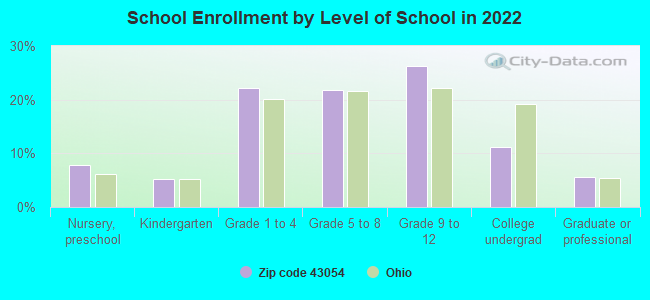
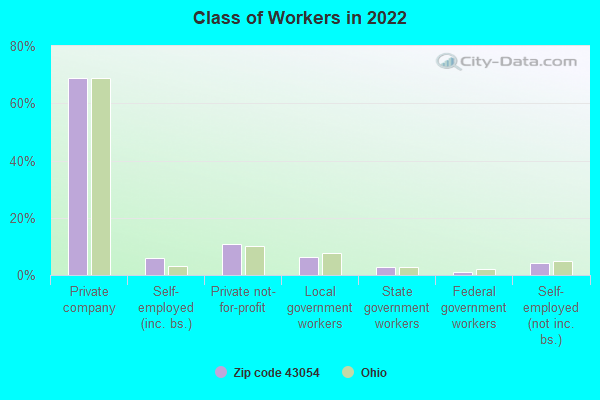
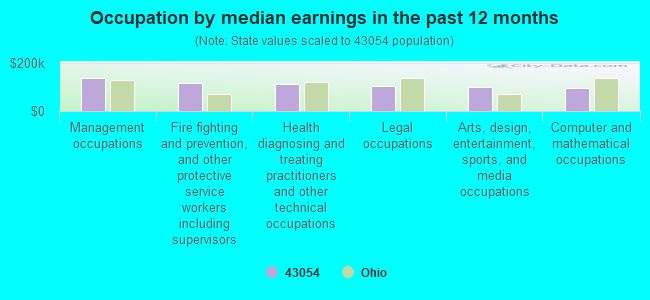
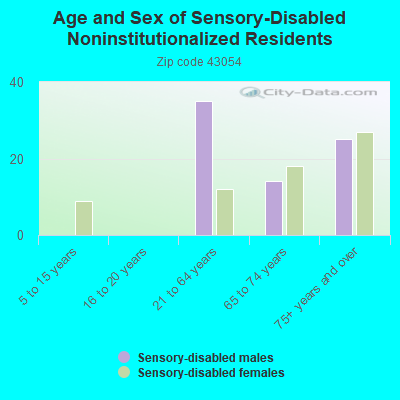
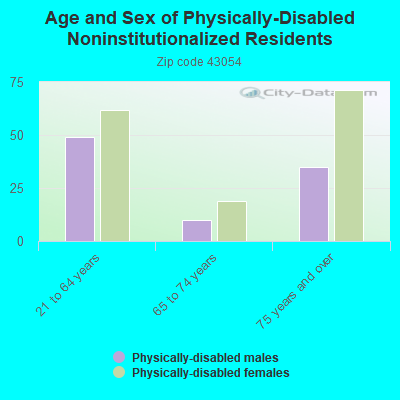
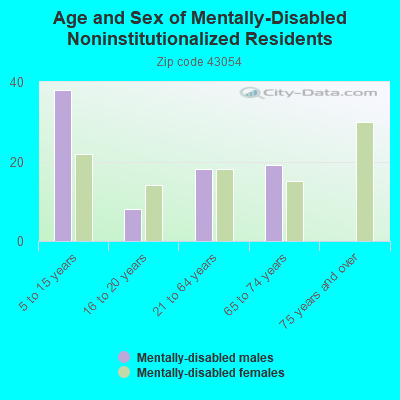
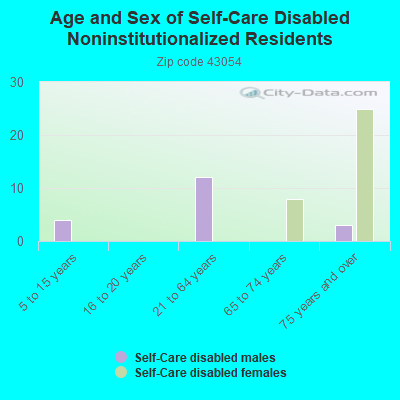
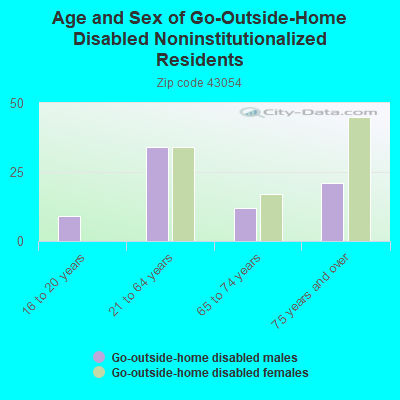
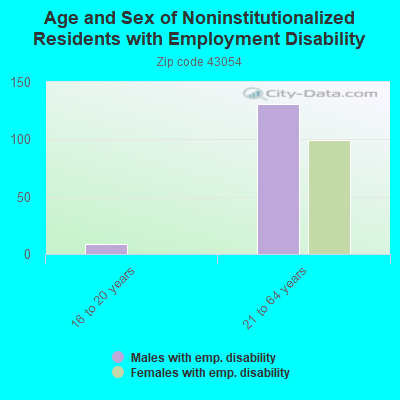
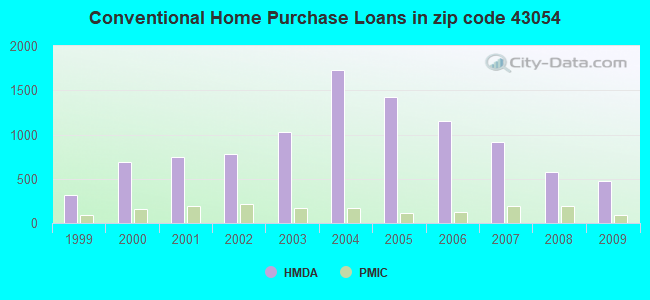
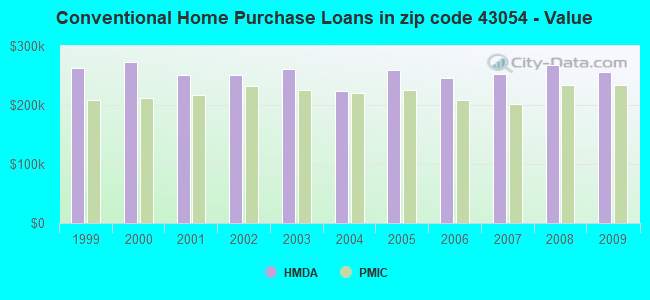
 Based on the data from the years 2002 - 2018 the average number of fire incidents per year is 42. The highest number of reported fire incidents - 67 took place in 2018, and the least - 22 in 2005. The data has a rising trend.
 When looking into fire subcategories, the most reports belonged to: Structure Fires (46.4%), and Outside Fires (31.9%).