Estimated zip code population in 2022: 36,665 Zip code population in 2010: 30,444 Zip code population in 2000: 30,723
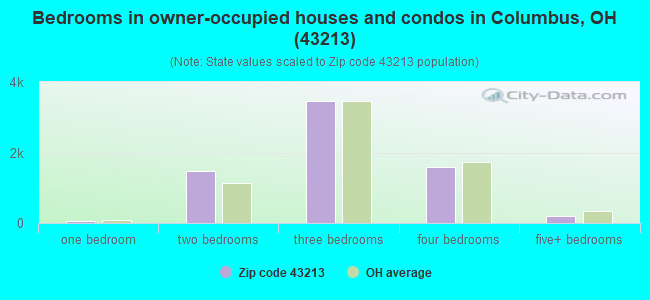
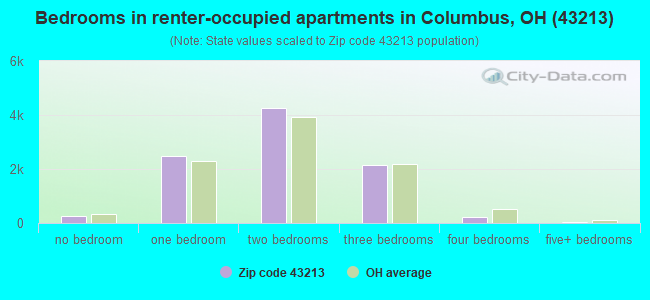
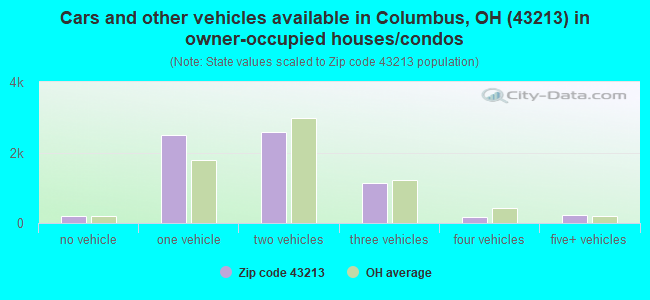
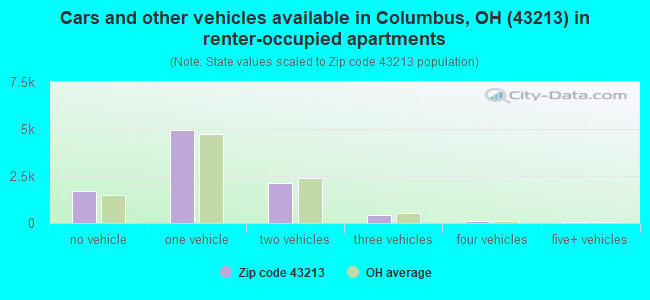
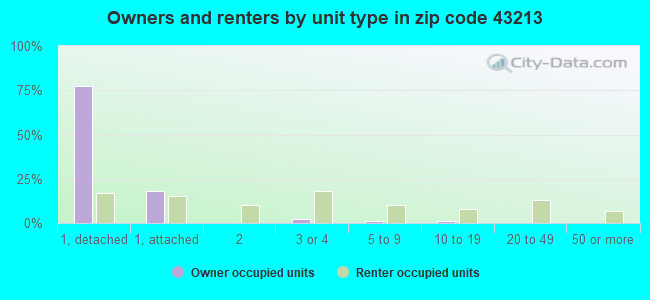
Houses and condos: 17,143 Renter-occupied apartments: 9,355
% of renters here:
58%
State:
33%
March 2022 cost of living index in zip code 43213: 95.4 (near average, U.S. average is 100)
Land area: 9.0 sq. mi. Water area: 0.1 sq. mi.
Population density: 4,077 people per square mile
(average).
OSM Map
General Map
Google Map
MSN Map
OSM Map
General Map
Google Map
MSN Map
OSM Map
General Map
Google Map
MSN Map
OSM Map
General Map
Google Map
MSN Map
Please wait while loading the map...
Real estate property taxes paid for housing units in 2022:
This zip code:
1.3% ($2,574)
Ohio:
1.3% ($2,639)
Median real estate property taxes paid for housing units with mortgages in 2022: $2,758 (1.3%) Median real estate property taxes paid for housing units with no mortgage in 2022: $2,317 (1.3%)
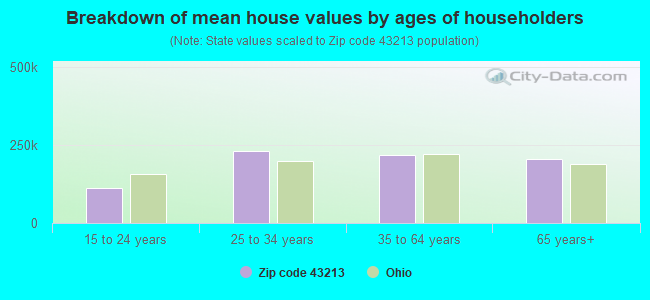
Estimated median house/condo value in 2022: $191,406
43213:
$191,406
Ohio:
$204,100
According to our research of Ohio and other state lists, there were 54 registered sex offenders living in 43213 zip code as of April 27, 2024. The ratio of all residents to sex offenders in zip code 43213 is 610 to 1. The ratio of registered sex offenders to all residents in this zip code is near the state average.
Median resident age:
This zip code:
37.6 years
Ohio median age:
39.9 years
Average household size:
This zip code:
2.2 people
Ohio:
2.4 people
Averages for the 2020 tax year for zip code 43213, filed in 2021:
Average Adjusted Gross Income (AGI) in 2020: $43,164 (Individual Income Tax Returns)
Here:
$43,164
State:
$67,288
Salary/wage: $37,162 (reported on 82.6% of returns)
Here:
$37,162
State:
$55,628
(% of AGI for various income ranges: 1211.6% for AGIs below $25k, 3753.7% for AGIs $25k-50k, 6410.4% for AGIs $50k-75k, 9473.6% for AGIs $75k-100k, 17062.1% for AGIs $100k-200k, 62750.0% for AGIs over 200k)
Taxable interest for individuals: $1,215 (reported on 14.3% of returns)
This zip code:
$1,215
Ohio:
$1,518
(% of AGI for various income ranges: 6.3% for AGIs below $25k, 8.5% for AGIs $25k-50k, 22.2% for AGIs $50k-75k, 51.2% for AGIs $75k-100k, 124.1% for AGIs $100k-200k, 1856.0% for AGIs over 200k)
Ordinary dividends: $6,074 (reported on 9.2% of returns)
Here:
$6,074
State:
$7,167
(% of AGI for various income ranges: 8.8% for AGIs below $25k, 19.3% for AGIs $25k-50k, 63.1% for AGIs $50k-75k, 179.4% for AGIs $75k-100k, 503.0% for AGIs $100k-200k, 6846.0% for AGIs over 200k)
Net capital gain/loss in AGI: +$10,363 (reported on 8.1% of returns)
Here:
+$10,363
State:
+$18,919
(% of AGI for various income ranges: 2.8% for AGIs below $25k, 9.9% for AGIs $25k-50k, 74.6% for AGIs $50k-75k, 137.4% for AGIs $75k-100k, 642.0% for AGIs $100k-200k, 17090.0% for AGIs over 200k)
Profit/loss from business: +$6,386 (reported on 16.6% of returns)
Here:
+$6,386
State:
+$13,744
(% of AGI for various income ranges: 59.4% for AGIs below $25k, 82.1% for AGIs $25k-50k, 161.4% for AGIs $50k-75k, 300.6% for AGIs $75k-100k, 628.0% for AGIs $100k-200k, 6692.0% for AGIs over 200k)
Taxable individual retirement arrangement distribution: $18,026 (reported on 6.2% of returns)
43213:
$18,026
Ohio:
$18,876
(% of AGI for various income ranges: 29.8% for AGIs below $25k, 47.5% for AGIs $25k-50k, 167.3% for AGIs $50k-75k, 368.5% for AGIs $75k-100k, 1342.5% for AGIs $100k-200k, 6248.0% for AGIs over 200k)
Self-employed (Keogh) retirement plans: $19,900 (reported on 0.1% of returns)
43213:
$19,900
Ohio:
$24,898
(% of AGI for various income ranges: 60.3% for AGIs $75k-100k)
Total itemized deductions: $27,539 (reported on 4.8% of returns)
Here:
$27,539
State:
$33,869
(% of AGI for various income ranges: 27.6% for AGIs below $25k, 67.0% for AGIs $25k-50k, 287.8% for AGIs $50k-75k, 546.5% for AGIs $75k-100k, 1161.1% for AGIs $100k-200k, 7436.0% for AGIs over 200k)
Charity contributions: $10,116 (reported on 3.8% of returns)
Here:
$10,116
State:
$14,577
(% of AGI for various income ranges: 2.8% for AGIs below $25k, 10.2% for AGIs $25k-50k, 61.4% for AGIs $50k-75k, 168.5% for AGIs $75k-100k, 359.3% for AGIs $100k-200k, 4168.0% for AGIs over 200k)
Taxes paid: $6,473 (reported on 4.7% of returns)
43213:
$6,473
State:
$7,681
(% of AGI for various income ranges: 4.1% for AGIs below $25k, 9.3% for AGIs $25k-50k, 65.4% for AGIs $50k-75k, 158.8% for AGIs $75k-100k, 359.6% for AGIs $100k-200k, 1224.0% for AGIs over 200k)
Earned income credit: $2,484 (reported on 26.0% of returns)
Here:
$2,484
State:
$2,304
(% of AGI for various income ranges: 132.1% for AGIs below $25k, 83.9% for AGIs $25k-50k, 1.1% for AGIs $50k-75k)
Percentage of individuals using paid preparers for their 2020 taxes: 93.3%
Here:
93%
State:
94%
(% for various income ranges: 92.7% for AGIs below $25k, 95.0% for AGIs $25k-50k, 92.3% for AGIs $50k-75k, 92.4% for AGIs $75k-100k, 91.9% for AGIs $100k-200k, 89.5% for AGIs over 200k)
Averages for the 2012 tax year for zip code 43213, filed in 2013:
Average Adjusted Gross Income (AGI) in 2012: $36,691 (Individual Income Tax Returns)
Here:
$36,691
State:
$54,926
Salary/wage: $31,210 (reported on 84.6% of returns)
Here:
$31,210
State:
$45,869
(% of AGI for various income ranges: 80.5% for AGIs below $25k, 83.8% for AGIs $25k-50k, 72.1% for AGIs $50k-75k, 67.2% for AGIs $75k-100k, 63.5% for AGIs $100k-200k, 39.7% for AGIs over 200k)
Taxable interest for individuals: $1,533 (reported on 17.9% of returns)
This zip code:
$1,533
Ohio:
$1,297
(% of AGI for various income ranges: 0.4% for AGIs below $25k, 0.4% for AGIs $25k-50k, 0.5% for AGIs $50k-75k, 0.8% for AGIs $75k-100k, 1.3% for AGIs $100k-200k, 2.2% for AGIs over 200k)
Ordinary dividends: $5,572 (reported on 10.7% of returns)
Here:
$5,572
State:
$5,821
(% of AGI for various income ranges: 0.6% for AGIs below $25k, 0.5% for AGIs $25k-50k, 1.3% for AGIs $50k-75k, 1.3% for AGIs $75k-100k, 2.6% for AGIs $100k-200k, 6.0% for AGIs over 200k)
Net capital gain/loss in AGI: +$11,493 (reported on 7.4% of returns)
Here:
+$11,493
State:
+$11,232
(% of AGI for various income ranges: 0.2% for AGIs $50k-75k, 0.5% for AGIs $75k-100k, 1.4% for AGIs $100k-200k, 20.2% for AGIs over 200k)
Profit/loss from business: +$8,167 (reported on 12.9% of returns)
Here:
+$8,167
State:
+$12,773
(% of AGI for various income ranges: 7.8% for AGIs below $25k, 1.5% for AGIs $25k-50k, 1.2% for AGIs $50k-75k, 2.3% for AGIs $75k-100k, 3.3% for AGIs $100k-200k, 0.9% for AGIs over 200k)
Taxable individual retirement arrangement distribution: $13,909 (reported on 7.5% of returns)
43213:
$13,909
Ohio:
$14,511
(% of AGI for various income ranges: 1.6% for AGIs below $25k, 1.4% for AGIs $25k-50k, 2.9% for AGIs $50k-75k, 4.5% for AGIs $75k-100k, 4.6% for AGIs $100k-200k, 4.6% for AGIs over 200k)
Self-employment retirement plans: $12,200 (reported on 0.2% of returns)
43213:
$12,200
Ohio:
$20,257
(% of AGI for various income ranges: 0.6% for AGIs $100k-200k)
Total itemized deductions: $17,938 (23% of AGI, reported on 20.7% of returns)
Here:
$17,938
State:
$21,278
Here:
22.9% of AGI
State:
18.8% of AGI
(% of AGI for various income ranges: 4.9% for AGIs below $25k, 7.3% for AGIs $25k-50k, 12.0% for AGIs $50k-75k, 13.2% for AGIs $75k-100k, 15.4% for AGIs $100k-200k, 13.2% for AGIs over 200k)
Charity contributions: $4,053 (reported on 16.3% of returns)
Here:
$4,053
State:
$3,943
(% of AGI for various income ranges: 0.4% for AGIs below $25k, 1.1% for AGIs $25k-50k, 2.0% for AGIs $50k-75k, 2.4% for AGIs $75k-100k, 3.0% for AGIs $100k-200k, 3.7% for AGIs over 200k)
Taxes paid: $6,727 (reported on 20.5% of returns)
43213:
$6,727
State:
$9,568
(% of AGI for various income ranges: 1.2% for AGIs below $25k, 2.0% for AGIs $25k-50k, 4.1% for AGIs $50k-75k, 5.2% for AGIs $75k-100k, 6.8% for AGIs $100k-200k, 6.7% for AGIs over 200k)
Earned income credit: $2,501 (reported on 29.5% of returns)
Here:
$2,501
State:
$2,285
(% of AGI for various income ranges: 9.2% for AGIs below $25k, 1.3% for AGIs $25k-50k)
Percentage of individuals using paid preparers for their 2012 taxes: 45.5%
Here:
46%
State:
51%
(% for various income ranges: 44.3% for AGIs below $25k, 44.2% for AGIs $25k-50k, 47.7% for AGIs $50k-75k, 49.4% for AGIs $75k-100k, 53.7% for AGIs $100k-200k, 73.3% for AGIs over 200k)
Averages for the 2004 tax year for zip code 43213, filed in 2005:
Average Adjusted Gross Income (AGI) in 2004: $34,182 (Individual Income Tax Returns)
Here:
$34,182
State:
$44,480
Salary/wage: $29,619 (reported on 85.4% of returns)
Here:
$29,619
State:
$39,198
(% of AGI for various income ranges: 107.4% for AGIs below $10k, 82.0% for AGIs $10k-25k, 83.0% for AGIs $25k-50k, 75.6% for AGIs $50k-75k, 73.2% for AGIs $75k-100k, 49.7% for AGIs over 100k)
Taxable interest for individuals: $1,983 (reported on 30.2% of returns)
This zip code:
$1,983
Ohio:
$1,532
(% of AGI for various income ranges: 3.1% for AGIs below $10k, 1.4% for AGIs $10k-25k, 1.2% for AGIs $25k-50k, 1.4% for AGIs $50k-75k, 1.3% for AGIs $75k-100k, 3.3% for AGIs over 100k)
Taxable dividends: $4,018 (reported on 15.8% of returns)
Here:
$4,018
State:
$3,496
(% of AGI for various income ranges: 2.0% for AGIs below $10k, 0.8% for AGIs $10k-25k, 0.8% for AGIs $25k-50k, 1.4% for AGIs $50k-75k, 2.0% for AGIs $75k-100k, 4.6% for AGIs over 100k)
Net capital gain/loss: +$8,097 (reported on 12.9% of returns)
Here:
+$8,097
State:
+$8,582
(% of AGI for various income ranges: -1.4% for AGIs below $10k, -0.0% for AGIs $10k-25k, 0.2% for AGIs $25k-50k, 0.8% for AGIs $50k-75k, 1.3% for AGIs $75k-100k, 13.0% for AGIs over 100k)
Profit/loss from business: +$8,040 (reported on 10.6% of returns)
Here:
+$8,040
State:
+$10,813
(% of AGI for various income ranges: 4.5% for AGIs below $10k, 3.1% for AGIs $10k-25k, 1.4% for AGIs $25k-50k, 1.7% for AGIs $50k-75k, 1.7% for AGIs $75k-100k, 4.6% for AGIs over 100k)
IRA payment deduction: $2,385 (reported on 1.8% of returns)
43213:
$2,385
Ohio:
$2,794
(% of AGI for various income ranges: 0.1% for AGIs $10k-25k, 0.1% for AGIs $25k-50k, 0.1% for AGIs $50k-75k, 0.2% for AGIs $75k-100k, 0.1% for AGIs over 100k)
Self-employed pension: $13,453 (reported on 0.4% of returns)
Here:
$13,453
Ohio:
$13,981
Total itemized deductions: $15,856 (24% of AGI, reported on 25.0% of returns)
Here:
$15,856
State:
$17,503
Here:
23.5% of AGI
State:
20.8% of AGI
(% of AGI for various income ranges: 7.7% for AGIs below $10k, 5.7% for AGIs $10k-25k, 9.7% for AGIs $25k-50k, 13.7% for AGIs $50k-75k, 16.4% for AGIs $75k-100k, 15.3% for AGIs over 100k)
Charity contributions deductions: $3,377 (5% of AGI, reported on 21.3% of returns)
Here:
$3,377
State:
$3,087
Here:
4.7% of AGI
State:
3.4% of AGI
(% of AGI for various income ranges: 0.5% for AGIs below $10k, 0.7% for AGIs $10k-25k, 1.5% for AGIs $25k-50k, 2.3% for AGIs $50k-75k, 2.7% for AGIs $75k-100k, 3.8% for AGIs over 100k)
Total tax: $4,688 (reported on 71.2% of returns)
43213:
$4,688
State:
$6,781
(% of AGI for various income ranges: 2.4% for AGIs below $10k, 3.7% for AGIs $10k-25k, 7.1% for AGIs $25k-50k, 10.0% for AGIs $50k-75k, 11.6% for AGIs $75k-100k, 18.1% for AGIs over 100k)
Earned income credit: $1,775 (reported on 22.3% of returns)
Here:
$1,775
State:
$1,696
Percentage of individuals using paid preparers for their 2004 taxes: 54.1%
Here:
54%
State:
55%
(% for various income ranges: 50.6% for AGIs below $10k, 57.0% for AGIs $10k-25k, 52.3% for AGIs $25k-50k, 53.2% for AGIs $50k-75k, 55.0% for AGIs $75k-100k, 64.8% for AGIs over 100k)
Likely homosexual households (counted as self-reported same-sex unmarried-partner households)
Lesbian couples: 0.4% of all households
Gay men: 0.2% of all households
Household received Food Stamps/SNAP in the past 12 months: 2,950 Household did not receive Food Stamps/SNAP in the past 12 months: 13,327
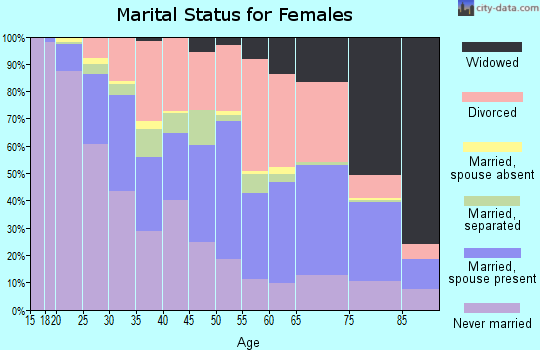
Women who had a birth in the past 12 months: 516 (165 now married, 340 unmarried) Women who did not have a birth in the past 12 months: 8,039 (3,011 now married, 5,029 unmarried)
Housing units in zip code 43213 with a mortgage: 4,487 (524 second mortgage, 385 both second mortgage and home equity loan) Houses without a mortgage: 128
Median monthly owner costs for units with a mortgage: $1,359 Median monthly owner costs for units without a mortgage: $542
Residents with income below the poverty level in 2022:
This zip code:
19.0%
Whole state:
13.4%
Residents with income below 50% of the poverty level in 2022:
This zip code:
10.4%
Whole state:
7.0%
Median number of rooms in houses and condos:
Here:
6.1
State:
6.7
Median number of rooms in apartments:
Here:
4.3
State:
4.4
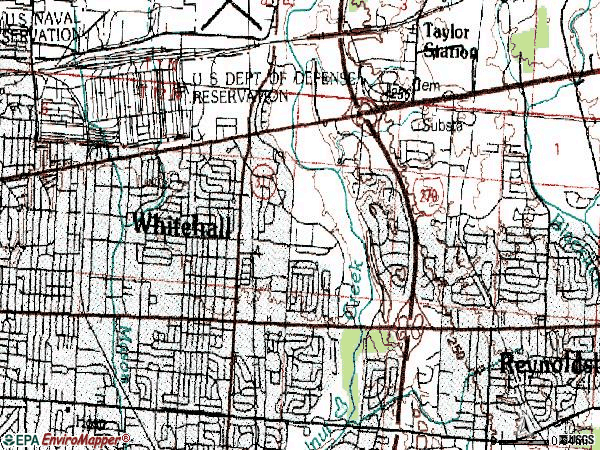
Notable locations in this zip code not listed on our city pages
Notable locations in zip code 43213: Archie Griffin Stadium (A), Airport Commerce Park (B), Columbus Country Club (C), Whitehall Branch Library (D), Medstat of Ohio (E), Defense Supply Center Columbus Fire Department (F), Whitehall Division of Fire (G), Columbus Division of Fire Station 21 Eastmoor Fire Station (H), Columbus Division of Fire Station 5 Olde Orchard Fire Station (I), Whitehall Municipal Building (J). Display/hide their locations on the map
Shopping Centers: Hamilton Square Shopping Center (1), Canyon Center Shopping Center (2), Town and Country Shopping Center (3), Great Eastern Shoppers Mart Shopping Center (4), Main 270 Shopping Center (5), Great Eastern Shopping Center (6). Display/hide their locations on the map
Churches in zip code 43213 include: Saint Marys Macedonian Eastern Orthodox Church (A), Saint Theresas Shrine (B), Temple Israel (C), Columbus Eastwood Seventh Day Adventist Church (D), Bethany Lutheran Church (E), Fairmoor Presbyterian Church (F), Laurel Canyon Church of Christ (G), Prince of Peace Lutheran Church (H), Saint Edward Episcopal Church (I). Display/hide their locations on the map
Parks in zip code 43213 include: Big Walnut Park (1), Orton-Davis Park (2), Whitehall Community Park (3), Shadylane Park (4), Norton Field Playground (5), Napoleon Park (6), Lamby Park (7). Display/hide their locations on the map
Tourist attractions (not listed on the city page) : Holiday Lanes (Amusement & Theme Parks; 4589 East Broad Street), AAA Insurance Agency - East (Tours & Charters; 6023 East Main Street).
2,363 married couples with children.
4,644 single-parent households (788 men, 3,856 women).
79.7% of residents of 43213 zip code speak English at home.
8.0% of residents speak Spanish at home (44% very well, 30% well, 15% not well, 11% not at all).
3.3% of residents speak other Indo-European language at home (62% very well, 34% well, 2% not well, 3% not at all).
1.1% of residents speak Asian or Pacific Island language at home (62% very well, 19% well, 19% not well).
8.3% of residents speak other language at home (60% very well, 31% well, 7% not well, 1% not at all).
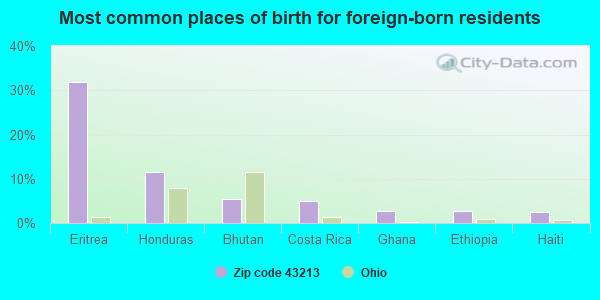
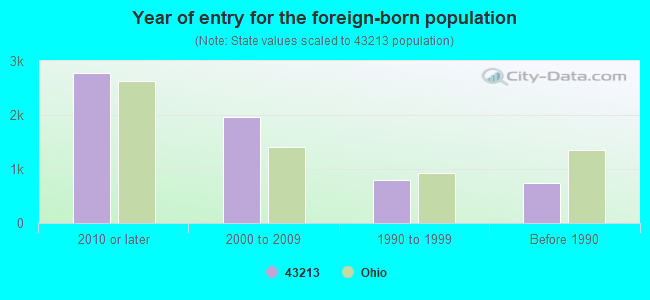
Foreign born population: 5,607 (15.3%) (52.7% of them are naturalized citizens)
Facilities with environmental interests located in this zip code:
BILL SWAD CHEVROLET USED CARS (667 S HAMILTON in COLUMBUS, OH)
STATE MASTER (Ohio general info) - RCRA-OHD017920729, HAZARDOUS WASTE PROGRAM Small Quantity Generators, between 100 kg and 1000 kg of hazardous waste/month (Resource Conservation and Recovery Act (tracking hazardous waste)) - notification
83RD INFANTRY DIV MEM USARC (165 NORTH YEARLING ROAD in COLUMBUS, OH) . Federal Facility. U.S. ARMY
STATE MASTER (Ohio general info) - RCRA-OHR000019836, HAZARDOUS WASTE PROGRAM Conditionally Exempt Small Quantity Generators, less than 100 kg/month of hazardous waste (Resource Conservation and Recovery Act (tracking hazardous waste)) - notification Organizations: 88TH REGIONAL SUPPORT COMMAND (CONTACT/OWNER)
Alternative names: US ARMY 83RD INFANTRY DIV MAN USARC
ALTRACOLOR (4645 POTH ROAD in COLUMBUS, OH)
STATE MASTER (Ohio general info) - RCRA-OHR000034298, HAZARDOUS WASTE PROGRAM Small Quantity Generators, between 100 kg and 1000 kg of hazardous waste/month (Resource Conservation and Recovery Act (tracking hazardous waste)) - notification Organizations: DAVE MILLER (CONTACT/OWNER)
AMSA NO 56 (185 N YEARLING RD in COLUMBUS, OH) . Federal Facility. U.S. ARMY
STATE MASTER (Ohio general info) - RCRA-OHR000019844, HAZARDOUS WASTE PROGRAM Small Quantity Generators, between 100 kg and 1000 kg of hazardous waste/month (Resource Conservation and Recovery Act (tracking hazardous waste)) - notification Organizations: 88TH REGIONAL SUPPORT COMMAND (CONTACT/OWNER)
Alternative names: US ARMY AMSA NO 56
AULD CO (180 OUTERBELT ST in COLUMBUS, OH)
STATE MASTER (Ohio general info) - AIR MAJOR Small Quantity Generators, between 100 kg and 1000 kg of hazardous waste/month (Resource Conservation and Recovery Act (tracking hazardous waste)) - notification Business SIC classification: COMMERCIAL PRINTING Organizations: AULD DAVID L (CONTACT/OWNER)
BP OIL CO SITE 07913 (3140 E MAIN ST in COLUMBUS, OH)
STATE MASTER (Ohio general info) - RCRA-OHD987016557, HAZARDOUS WASTE PROGRAM, AIR MAJOR, -25-5541-168-11, EPCRA Conditionally Exempt Small Quantity Generators, less than 100 kg/month of hazardous waste (Resource Conservation and Recovery Act (tracking hazardous waste)) - notification Business SIC classification: GASOLINE SERVICE STATIONS Alternative names: BP OIL COMPANY
ALLIANCE DATA SYSTEMS (4590 E BROAD ST in COLUMBUS, OH)
(Resource Conservation and Recovery Act (tracking hazardous waste))
ACTIONGROUP INC (411 REYNOLDSBURG NEW ALBANY RD in COLUMBUS, OH)
Conditionally Exempt Small Quantity Generators, less than 100 kg/month of hazardous waste (Resource Conservation and Recovery Act (tracking hazardous waste)) - notification Organizations: FRANK DENUTTE (CONTACT/OWNER)
ARCHITECTURAL IDENTIFICATION INC (121 OUTERBELT ST in COLUMBUS, OH)
Small Quantity Generators, between 100 kg and 1000 kg of hazardous waste/month (Resource Conservation and Recovery Act (tracking hazardous waste)) - notification Organizations: ARCHITETURAL IDENTIFICATION CORP (CONTACT/OWNER)
BP FACILITY #24042 (7040 E BROAD ST in COLUMBUS, OH)
Small Quantity Generators, between 100 kg and 1000 kg of hazardous waste/month (Resource Conservation and Recovery Act (tracking hazardous waste)) Organizations: BP PRODUCTS NORTH AMERICA INC (CONTACT/OPERATOR)
Housing units lacking complete plumbing facilities: 0.7% Housing units lacking complete kitchen facilities: 1.7%
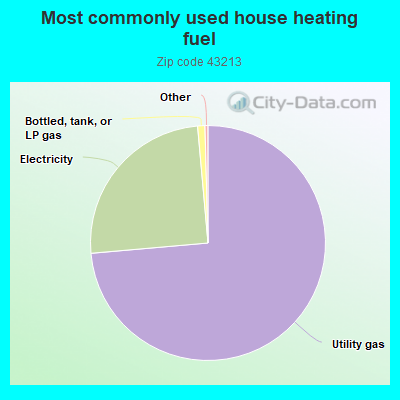
73.6%Utility gas
25.0%Electricity
1.0%Bottled, tank, or LP gas
Population in 1990: 29,375. Population change in the 1990s: +1,348 (+4.6%).
Place of birth for U.S.-born residents:
This state: 23,851
Northeast: 2,111
Midwest: 1,177
South: 2,715
West: 718
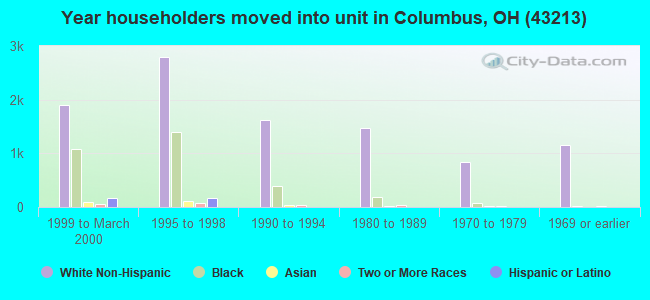
47% of the 43213 zip code residents lived in the same house 5 years ago. Out of people who lived in different houses, 70% lived in this county. Out of people who lived in different counties, 50% lived in Ohio.
86% of the 43213 zip code residents lived in the same house 1 year ago. Out of people who lived in different houses, 74% moved from this county. Out of people who lived in different houses, 10% moved from different county within same state. Out of people who lived in different houses, 7% moved from different state. Out of people who lived in different houses, 3% moved from abroad.
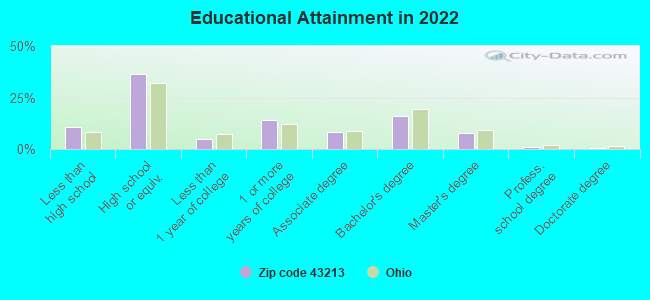
Private vs. public school enrollment:
Students in private schools in grades 1 to 8 (elementary and middle school): 399
Here:
10.6%
Ohio:
16.0%
Students in private schools in grades 9 to 12 (high school): 192
Here:
13.2%
Ohio:
13.1%
Students in private undergraduate colleges: 211
Here:
22.2%
Ohio:
22.3%
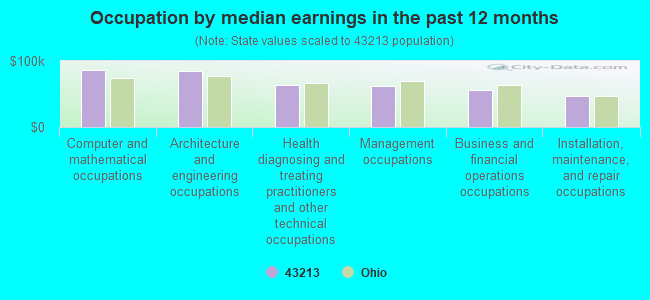
Occupation by median earnings in the past 12 months ($)
85,680Computer and mathematical occupations
84,301Architecture and engineering occupations
63,310Health diagnosing and treating practitioners and other technical occupations
62,181Management occupations
55,456Business and financial operations occupations
47,125Installation, maintenance, and repair occupations
Companies with biggest federal contracts located in this zip code (COLUMBUS, OH):
WATEC INC (5923 BAINTREE DR; small business) : $16,200,700 in 165 contractsfrom 2003 to 2004
Contracts for Water Purification Equipment, Power and Hand Pumps, Hose, Pipe, Tube, Lubrication, and Railing Fittings, Hose and Flexible Tubing, and moreby Defense Logistics Agency Signed by year:2000: $0; 2001: $0; 2002: $0; 2003: $3,284,488; 2004: $12,916,212; 2005: $0; 2006: $0.
Biggest contracts:
$748,066 with Defense Logistics Agency for Water Purification Equipment. Signed on 2004-04-26. Completion date: 2004-05-08.
$746,531 with Defense Logistics Agency for Power and Hand Pumps. Signed on 2004-05-14. Completion date: 2004-05-17.
$576,270 with Defense Logistics Agency for Hose, Pipe, Tube, Lubrication, and Railing Fittings. Signed on 2004-04-15. Completion date: 2004-04-18.
$525,980, same as above.Signed on 2003-10-16. Completion date: 2003-10-28.
UNICON INTERNATIONAL INC (241 OUTERBELT ST) : $88,451 in 3 contractsin 2003
$102,805 with Army for Specialized Shipping and Storage Containers. Taking place in VA. Signed on 2003-07-25. Completion date: 2003-04-15.
-$174 with Army for Inspection Services (including commercial testing and lab services, except medical/dental) -- Ship and Marine Equipment. Taking place in CA. Signed on 2003-04-07. Completion date: 2000-09-28.
-$14,180 with Army for Specialized Shipping and Storage Containers. Taking place in VA. Signed on 2003-09-20. Completion date: 2003-04-15.
IDEAL PRECISION INSTRUMENT SER (4539 E BROAD STREET; small business)
$66,230 with Air Force for Physical Properties Testing and Inspection. Signed on 2003-02-12. Completion date: 2003-04-14.
BRAD SMITH CLEANING INC (875 S HAMILTON RD; small business) : $51,140 in 11 contractsfrom 2001 to 2004
Contracts for Custodial Janitorial Services by Navy, Army Signed by year:2000: $0; 2001: $18,308; 2002: $18,718; 2003: $19,701; 2004: -$5,587; 2005: $0; 2006: $0.
Biggest contracts:
$19,701 with Navy for Custodial Janitorial Services. Signed on 2003-10-01. Completion date: 2004-09-30.
$19,128, same as above.Signed on 2002-11-08. Completion date: 2003-09-30.
$18,000, same as above.Signed on 2001-10-01. Completion date: 2002-09-30.
$4,120 with Army for Custodial Janitorial Services. Signed on 2004-03-26. Completion date: 2004-04-08.
BROAD STREET HOTEL ASSOCIATES, (4801 E BROAD ST; small business) : $47,493 in 4 contractsfrom 2003 to 2005
$42,372 with Army for Lodging - Hotel/Motel. Signed on 2005-11-02. Completion date: 2005-11-20.
$3,186, same as above.Signed on 2003-07-24. Completion date: 2003-07-25.
$3,123, same as above.Signed on 2004-10-01. Completion date: 2004-10-06.
-$1,188, same as above.Signed on 2005-12-28. Completion date: 2005-11-20.
COLUMBUS TECHNICAL SERVICES IN (5763 WESTBOURNE AVE; small business)
$34,980 with Defense Logistics Agency for Maintenance, Repair and Rebuilding of Equipment -- Miscellaneous. Signed on 2000-09-15. Completion date: 2001-07-31.
BERRYS BARBELL & FITNESS EQUIP (4815 EAST MAIN STREET; small business)
$29,007 with Army for Equipment and Materials Testing -- Recreational and Athletic Equipment. Signed on 2003-08-05. Completion date: 2003-08-15.
BANNISTER ENTERPRISES (571 WINNARD DRIVE; small business) : $26,205 in 11 contractsfrom 2004 to 2006
Contracts for Custodial Janitorial Services by Army Signed by year:2000: $0; 2001: $0; 2002: $0; 2003: $0; 2004: $19,905; 2005: $5,400; 2006: $900.
Biggest contracts:
$7,500 with Army for Custodial Janitorial Services. Signed on 2004-08-20. Completion date: 2005-08-31.
$6,768, same as above.Signed on 2004-08-20. Completion date: 2005-08-31.
$5,160, same as above.Signed on 2005-02-11. Completion date: 2002-12-31.
$5,160, same as above.Signed on 2004-02-11. Completion date: 2002-12-31.
DAVID GILL PONTIAC INC (4700 E BROAD ST; small business)
$24,000 with Army for Maintenance, Repair and Rebuilding of Equipment -- Ground Effect Vehicles, Motor Vehicles, Trailers, and Cycles. Signed on 2005-06-21. Completion date: 2005-07-29.
CITY OF WHITEHALL (360 S YEARLING RD)
$4,125 with Defense Logistics Agency for Miscellaneous Items. Signed on 2005-05-27. Completion date: 2005-08-31.
Top industries in this zip code by the number of employees in 2005:
Management of Companies and Enterprises: Corporate, Subsidiary, and Regional Managing Offices (over 1000 employees: 1 establishment, 500-999 employees: 1 establishment, 250-499 employees: 1 establishment, 1-4 employees: 3 establishments)
Health Care and Social Assistance: General Medical and Surgical Hospitals (over 1000: 1)
Health Care and Social Assistance: Offices of Physicians (except Mental Health Specialists) (250-499: 1, 50-99: 1, 20-49: 14, 10-19: 18, 5-9: 14, 1-4: 27)
Administrative and Support and Waste Management and Remediation Services: Temporary Help Services (250-499: 2, 100-249: 2, 50-99: 2, 20-49: 1, 10-19: 1, 1-4: 2)
2002 - 2018 National Fire Incident Reporting System (NFIRS) incidents
Based on the data from the years 2002 - 2018 the average number of fire incidents per year is 139. The highest number of fire incidents - 186 took place in 2015, and the least - 85 in 2004. The data has a dropping trend.
When looking into fire subcategories, the most incidents belonged to: Structure Fires (39.9%), and Outside Fires (33.6%).
Fire incident types reported to NFIRS in Zip Code 43213

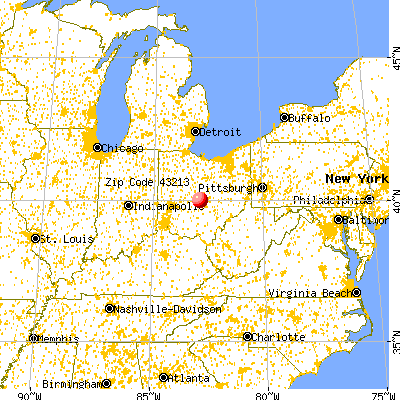


 Nearest zip codes: 43227, 43232, 43109, 43209, 43230, 43219.


 Based on the data from the years 2002 - 2018 the average number of fire incidents per year is 139. The highest number of fire incidents - 186 took place in 2015, and the least - 85 in 2004. The data has a dropping trend.
 When looking into fire subcategories, the most incidents belonged to: Structure Fires (39.9%), and Outside Fires (33.6%).