Estimated zip code population in 2022: 46,806 Zip code population in 2010: 42,201 Zip code population in 2000: 39,981
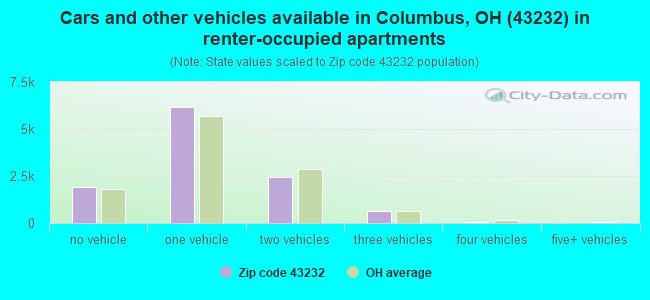
Houses and condos: 20,083 Renter-occupied apartments: 11,157
% of renters here:
59%
State:
33%
March 2022 cost of living index in zip code 43232: 94.6 (less than average, U.S. average is 100)
Land area: 12.3 sq. mi. Water area: 0.2 sq. mi.
Population density: 3,815 people per square mile
(average).
OSM Map
General Map
Google Map
MSN Map
OSM Map
General Map
Google Map
MSN Map
OSM Map
General Map
Google Map
MSN Map
OSM Map
General Map
Google Map
MSN Map
Please wait while loading the map...
Real estate property taxes paid for housing units in 2022:
This zip code:
1.4% ($2,096)
Ohio:
1.3% ($2,639)
Median real estate property taxes paid for housing units with mortgages in 2022: $2,205 (1.3%) Median real estate property taxes paid for housing units with no mortgage in 2022: $1,848 (1.5%)
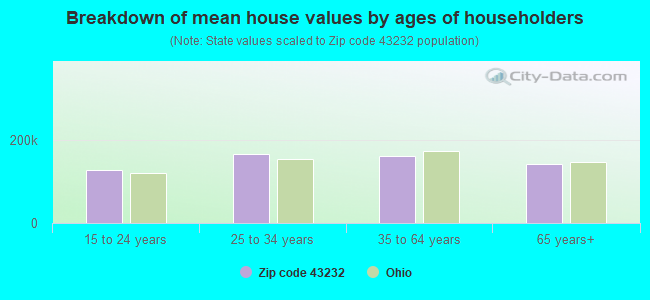
Estimated median house/condo value in 2022: $151,767
43232:
$151,767
Ohio:
$204,100
According to our research of Ohio and other state lists, there were 87 registered sex offenders living in 43232 zip code as of April 27, 2024. The ratio of all residents to sex offenders in zip code 43232 is 507 to 1. The ratio of registered sex offenders to all residents in this zip code is near the state average.
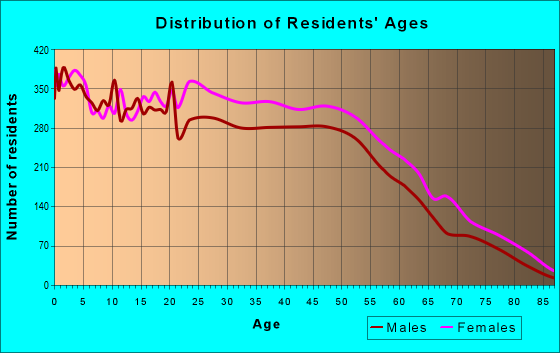
Median resident age:
This zip code:
34.2 years
Ohio median age:
39.9 years
Average household size:
This zip code:
2.4 people
Ohio:
2.4 people
Averages for the 2020 tax year for zip code 43232, filed in 2021:
Average Adjusted Gross Income (AGI) in 2020: $36,690 (Individual Income Tax Returns)
Here:
$36,690
State:
$67,288
Salary/wage: $33,715 (reported on 87.5% of returns)
Here:
$33,715
State:
$55,628
(% of AGI for various income ranges: 1229.0% for AGIs below $25k, 3715.9% for AGIs $25k-50k, 6818.3% for AGIs $50k-75k, 10389.4% for AGIs $75k-100k, 15865.8% for AGIs $100k-200k)
Taxable interest for individuals: $629 (reported on 8.2% of returns)
This zip code:
$629
Ohio:
$1,518
(% of AGI for various income ranges: 2.6% for AGIs below $25k, 3.2% for AGIs $25k-50k, 11.6% for AGIs $50k-75k, 17.1% for AGIs $75k-100k, 41.2% for AGIs $100k-200k)
Ordinary dividends: $1,814 (reported on 4.0% of returns)
Here:
$1,814
State:
$7,167
(% of AGI for various income ranges: 2.1% for AGIs below $25k, 3.7% for AGIs $25k-50k, 9.5% for AGIs $50k-75k, 28.6% for AGIs $75k-100k, 69.8% for AGIs $100k-200k)
Net capital gain/loss in AGI: +$4,595 (reported on 3.9% of returns)
Here:
+$4,595
State:
+$18,919
(% of AGI for various income ranges: 0.3% for AGIs below $25k, 1.9% for AGIs $25k-50k, 14.2% for AGIs $50k-75k, 64.4% for AGIs $75k-100k, 709.3% for AGIs $100k-200k)
Profit/loss from business: +$2,857 (reported on 16.6% of returns)
Here:
+$2,857
State:
+$13,744
(% of AGI for various income ranges: 28.5% for AGIs below $25k, 25.4% for AGIs $25k-50k, 79.2% for AGIs $50k-75k, 234.4% for AGIs $75k-100k, 725.3% for AGIs $100k-200k)
Taxable individual retirement arrangement distribution: $12,206 (reported on 2.9% of returns)
43232:
$12,206
Ohio:
$18,876
(% of AGI for various income ranges: 15.3% for AGIs below $25k, 19.3% for AGIs $25k-50k, 71.4% for AGIs $50k-75k, 126.8% for AGIs $75k-100k, 666.7% for AGIs $100k-200k)
Total itemized deductions: $23,454 (reported on 3.0% of returns)
Here:
$23,454
State:
$33,869
(% of AGI for various income ranges: 8.9% for AGIs below $25k, 56.0% for AGIs $25k-50k, 192.5% for AGIs $50k-75k, 418.6% for AGIs $75k-100k, 829.8% for AGIs $100k-200k)
Charity contributions: $9,176 (reported on 2.4% of returns)
Here:
$9,176
State:
$14,577
(% of AGI for various income ranges: 1.3% for AGIs below $25k, 13.9% for AGIs $25k-50k, 55.8% for AGIs $50k-75k, 116.5% for AGIs $75k-100k, 388.6% for AGIs $100k-200k)
Taxes paid: $5,141 (reported on 3.0% of returns)
43232:
$5,141
State:
$7,681
(% of AGI for various income ranges: 1.1% for AGIs below $25k, 8.3% for AGIs $25k-50k, 43.6% for AGIs $50k-75k, 104.5% for AGIs $75k-100k, 230.9% for AGIs $100k-200k)
Earned income credit: $2,578 (reported on 30.9% of returns)
Here:
$2,578
State:
$2,304
(% of AGI for various income ranges: 149.9% for AGIs below $25k, 91.0% for AGIs $25k-50k, 1.1% for AGIs $50k-75k)
Percentage of individuals using paid preparers for their 2020 taxes: 94.2%
Here:
94%
State:
94%
(% for various income ranges: 93.8% for AGIs below $25k, 95.3% for AGIs $25k-50k, 93.9% for AGIs $50k-75k, 92.5% for AGIs $75k-100k, 91.9% for AGIs $100k-200k, 80.0% for AGIs over 200k)
Averages for the 2012 tax year for zip code 43232, filed in 2013:
Average Adjusted Gross Income (AGI) in 2012: $30,973 (Individual Income Tax Returns)
Here:
$30,973
State:
$54,926
Salary/wage: $28,881 (reported on 88.7% of returns)
Here:
$28,881
State:
$45,869
(% of AGI for various income ranges: 82.1% for AGIs below $25k, 87.6% for AGIs $25k-50k, 82.3% for AGIs $50k-75k, 78.3% for AGIs $75k-100k, 70.2% for AGIs $100k-200k, 81.4% for AGIs over 200k)
Taxable interest for individuals: $528 (reported on 11.5% of returns)
This zip code:
$528
Ohio:
$1,297
(% of AGI for various income ranges: 0.2% for AGIs below $25k, 0.1% for AGIs $25k-50k, 0.2% for AGIs $50k-75k, 0.3% for AGIs $75k-100k, 0.5% for AGIs $100k-200k)
Ordinary dividends: $1,702 (reported on 5.3% of returns)
Here:
$1,702
State:
$5,821
(% of AGI for various income ranges: 0.2% for AGIs below $25k, 0.2% for AGIs $25k-50k, 0.3% for AGIs $50k-75k, 0.5% for AGIs $75k-100k, 1.1% for AGIs $100k-200k)
Net capital gain/loss in AGI: +$1,289 (reported on 3.4% of returns)
Here:
+$1,289
State:
+$11,232
(% of AGI for various income ranges: 0.4% for AGIs $75k-100k, 1.0% for AGIs $100k-200k)
Profit/loss from business: +$6,134 (reported on 12.8% of returns)
Here:
+$6,134
State:
+$12,773
(% of AGI for various income ranges: 8.2% for AGIs below $25k, 0.9% for AGIs $25k-50k, 0.9% for AGIs $50k-75k, 1.2% for AGIs $75k-100k, 1.3% for AGIs $100k-200k)
Taxable individual retirement arrangement distribution: $11,192 (reported on 4.2% of returns)
43232:
$11,192
Ohio:
$14,511
(% of AGI for various income ranges: 0.9% for AGIs below $25k, 0.9% for AGIs $25k-50k, 1.8% for AGIs $50k-75k, 2.6% for AGIs $75k-100k, 4.2% for AGIs $100k-200k)
Total itemized deductions: $14,715 (26% of AGI, reported on 19.0% of returns)
Here:
$14,715
State:
$21,278
Here:
26.1% of AGI
State:
18.8% of AGI
(% of AGI for various income ranges: 3.8% for AGIs below $25k, 8.4% for AGIs $25k-50k, 12.1% for AGIs $50k-75k, 11.6% for AGIs $75k-100k, 13.2% for AGIs $100k-200k, 13.2% for AGIs over 200k)
Charity contributions: $3,224 (reported on 14.3% of returns)
Here:
$3,224
State:
$3,943
(% of AGI for various income ranges: 0.4% for AGIs below $25k, 1.2% for AGIs $25k-50k, 1.9% for AGIs $50k-75k, 2.2% for AGIs $75k-100k, 3.2% for AGIs $100k-200k, 2.9% for AGIs over 200k)
Taxes paid: $4,708 (reported on 18.9% of returns)
43232:
$4,708
State:
$9,568
(% of AGI for various income ranges: 0.8% for AGIs below $25k, 2.2% for AGIs $25k-50k, 4.1% for AGIs $50k-75k, 4.5% for AGIs $75k-100k, 5.5% for AGIs $100k-200k, 5.3% for AGIs over 200k)
Earned income credit: $2,615 (reported on 34.3% of returns)
Here:
$2,615
State:
$2,285
(% of AGI for various income ranges: 11.0% for AGIs below $25k, 1.5% for AGIs $25k-50k)
Percentage of individuals using paid preparers for their 2012 taxes: 41.5%
Here:
42%
State:
51%
(% for various income ranges: 40.2% for AGIs below $25k, 41.2% for AGIs $25k-50k, 45.5% for AGIs $50k-75k, 47.1% for AGIs $75k-100k, 45.2% for AGIs $100k-200k, 66.7% for AGIs over 200k)
Averages for the 2004 tax year for zip code 43232, filed in 2005:
Average Adjusted Gross Income (AGI) in 2004: $30,471 (Individual Income Tax Returns)
Here:
$30,471
State:
$44,480
Salary/wage: $28,434 (reported on 91.1% of returns)
Here:
$28,434
State:
$39,198
(% of AGI for various income ranges: 92.4% for AGIs below $10k, 86.8% for AGIs $10k-25k, 89.1% for AGIs $25k-50k, 87.4% for AGIs $50k-75k, 87.3% for AGIs $75k-100k, 49.6% for AGIs over 100k)
Taxable interest for individuals: $819 (reported on 20.2% of returns)
This zip code:
$819
Ohio:
$1,532
(% of AGI for various income ranges: 0.9% for AGIs below $10k, 0.5% for AGIs $10k-25k, 0.4% for AGIs $25k-50k, 0.5% for AGIs $50k-75k, 0.7% for AGIs $75k-100k, 1.4% for AGIs over 100k)
Taxable dividends: $1,041 (reported on 8.3% of returns)
Here:
$1,041
State:
$3,496
(% of AGI for various income ranges: 0.6% for AGIs below $10k, 0.3% for AGIs $10k-25k, 0.2% for AGIs $25k-50k, 0.3% for AGIs $50k-75k, 0.2% for AGIs $75k-100k, 0.7% for AGIs over 100k)
Net capital gain/loss: +$1,837 (reported on 5.9% of returns)
Here:
+$1,837
State:
+$8,582
(% of AGI for various income ranges: -0.3% for AGIs below $10k, 0.1% for AGIs $10k-25k, 0.1% for AGIs $25k-50k, 0.3% for AGIs $50k-75k, 0.5% for AGIs $75k-100k, 2.5% for AGIs over 100k)
Profit/loss from business: +$5,014 (reported on 10.1% of returns)
Here:
+$5,014
State:
+$10,813
(% of AGI for various income ranges: 6.1% for AGIs below $10k, 2.7% for AGIs $10k-25k, 1.1% for AGIs $25k-50k, 0.9% for AGIs $50k-75k, 1.1% for AGIs $75k-100k, 3.0% for AGIs over 100k)
IRA payment deduction: $1,707 (reported on 1.4% of returns)
43232:
$1,707
Ohio:
$2,794
(% of AGI for various income ranges: 0.1% for AGIs $10k-25k, 0.1% for AGIs $25k-50k, 0.1% for AGIs $50k-75k, 0.1% for AGIs $75k-100k)
Self-employed pension: $6,500 (reported on 0.1% of returns)
Here:
$6,500
Ohio:
$13,981
Total itemized deductions: $13,475 (26% of AGI, reported on 27.2% of returns)
Here:
$13,475
State:
$17,503
Here:
25.6% of AGI
State:
20.8% of AGI
(% of AGI for various income ranges: 5.4% for AGIs below $10k, 5.8% for AGIs $10k-25k, 12.1% for AGIs $25k-50k, 15.6% for AGIs $50k-75k, 18.4% for AGIs $75k-100k, 10.7% for AGIs over 100k)
Charity contributions deductions: $2,524 (5% of AGI, reported on 22.8% of returns)
Here:
$2,524
State:
$3,087
Here:
4.6% of AGI
State:
3.4% of AGI
(% of AGI for various income ranges: 0.5% for AGIs below $10k, 0.8% for AGIs $10k-25k, 1.8% for AGIs $25k-50k, 2.6% for AGIs $50k-75k, 2.8% for AGIs $75k-100k, 2.2% for AGIs over 100k)
Total tax: $3,275 (reported on 67.2% of returns)
43232:
$3,275
State:
$6,781
(% of AGI for various income ranges: 2.0% for AGIs below $10k, 3.4% for AGIs $10k-25k, 6.4% for AGIs $25k-50k, 9.0% for AGIs $50k-75k, 10.3% for AGIs $75k-100k, 13.3% for AGIs over 100k)
Earned income credit: $1,826 (reported on 27.1% of returns)
Here:
$1,826
State:
$1,696
Percentage of individuals using paid preparers for their 2004 taxes: 52.0%
Here:
52%
State:
55%
(% for various income ranges: 46.5% for AGIs below $10k, 56.7% for AGIs $10k-25k, 52.0% for AGIs $25k-50k, 49.8% for AGIs $50k-75k, 46.8% for AGIs $75k-100k, 52.4% for AGIs over 100k)
Likely homosexual households (counted as self-reported same-sex unmarried-partner households)
Lesbian couples: 0.4% of all households
Gay men: 0.0% of all households
Household received Food Stamps/SNAP in the past 12 months: 3,957 Household did not receive Food Stamps/SNAP in the past 12 months: 15,143
Women who had a birth in the past 12 months: 789 (430 now married, 354 unmarried) Women who did not have a birth in the past 12 months: 10,819 (3,682 now married, 7,139 unmarried)
Housing units in zip code 43232 with a mortgage: 5,460 (594 second mortgage, 389 both second mortgage and home equity loan) Houses without a mortgage: 4
Median monthly owner costs for units with a mortgage: $1,187 Median monthly owner costs for units without a mortgage: $510
Residents with income below the poverty level in 2022:
This zip code:
18.3%
Whole state:
13.4%
Residents with income below 50% of the poverty level in 2022:
This zip code:
11.6%
Whole state:
7.0%
Median number of rooms in houses and condos:
Here:
6.3
State:
6.7
Median number of rooms in apartments:
Here:
4.4
State:
4.4
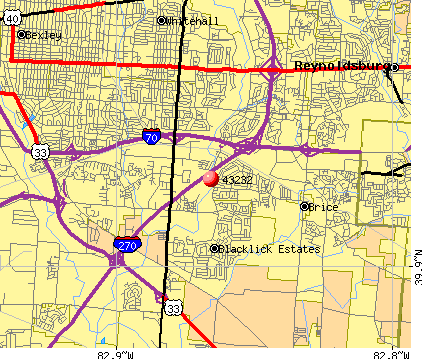
Notable locations in this zip code not listed on our city pages
Notable locations in zip code 43232: York Plaza Shpping Center (A), Industrial Commons Industrial Park (B), Kimberly Industrial Park (C), Scarborough Corporate Park (D), Walnut Hill Golf Club (E), Southeast Library (F), J C Penney Catalog Outlet Store (G), Barnett Recreation Center (H), Columbus Division of Fire Station 4 Berwick Fire Station (I). Display/hide their locations on the map
Shopping Centers: Scarborough Mall Shopping Center (1), Eastland Plaza Shopping Center (2), Crossroads East Shopping Center (3), Eastland Square Shopping Center (4), Brice Home Outlet Shopping Center (5), Eastland Centre Shopping Center (6), Berwick Plaza Shopping Center (7), Carnaby Mall Shopping Center (8), Chantry Square Shopping Center (9). Display/hide their locations on the map
Churches in zip code 43232 include: Asbury United Methodist Church (A), Grace Evangelical Lutheran Church (B), Faith United Methodist Church (C), Calvin United Presbyterian Church (D), Calvary Lutheran Church (E), Berwick First Church of God (F), Pine Hills Baptist Church (G), Oromo Lutheran Church (H), Calvary Chapel of Columbus (I). Display/hide their locations on the map
Parks in zip code 43232 include: Catalpa Park (1), Helsel Park (2), Maybury School Park (3), Far East Park (4), Easthaven Park (5), Kelly Park (6), Berwick Park (7), Maybury Park (8), Noe-Bixby Park (9). Display/hide their locations on the map
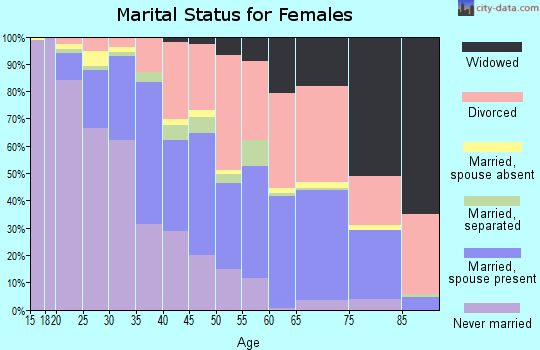
4,504 married couples with children.
6,141 single-parent households (705 men, 5,436 women).
86.8% of residents of 43232 zip code speak English at home.
5.3% of residents speak Spanish at home (34% very well, 24% well, 29% not well, 14% not at all).
2.2% of residents speak other Indo-European language at home (28% very well, 38% well, 27% not well, 7% not at all).
0.7% of residents speak Asian or Pacific Island language at home (32% very well, 63% well, 5% not at all).
4.8% of residents speak other language at home (51% very well, 38% well, 9% not well, 3% not at all).
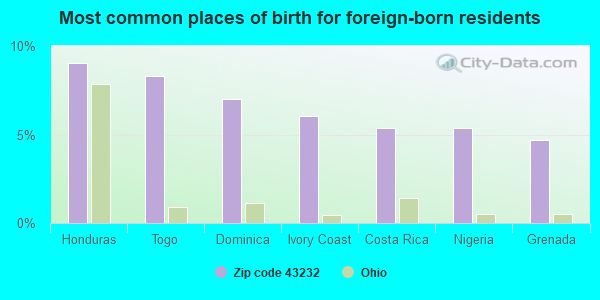
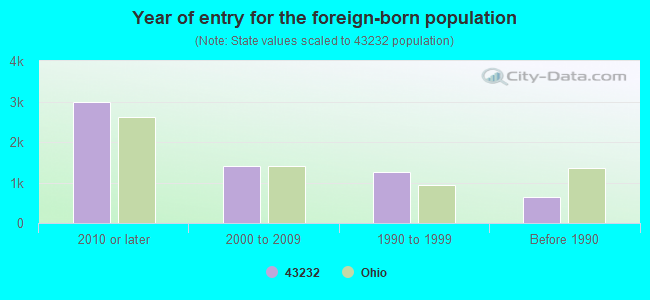
Foreign born population: 5,506 (11.8%) (34.2% of them are naturalized citizens)
Facilities with environmental interests located in this zip code:
4 INDUSTRIES INC (2135 S JAMES RD in COLUMBUS, OH)
STATE MASTER (Ohio general info) - RCRA-OHD987033412, HAZARDOUS WASTE PROGRAM (Resource Conservation and Recovery Act (tracking hazardous waste)) Organizations: BALLARD HAROLD (CONTACT/OWNER)
, HAROLD BALLARD (CONTACT/OWNER)
BAE SYSTEMS MISSION SOLUTIONS INC (4717 HILTON CORPORATE DR in COLUMBUS, OH)
STATE MASTER (Ohio general info) - RCRA-OHR000011502, HAZARDOUS WASTE PROGRAM (Resource Conservation and Recovery Act (tracking hazardous waste)) Organizations: GDE SYSTEMS INC (CONTACT/OWNER)
CERTIFIED ENGINES AND PARTS (2848 BANWICK RD in COLUMBUS, OH)
STATE MASTER (Ohio general info) - RCRA-OHD987056835, HAZARDOUS WASTE PROGRAM (Resource Conservation and Recovery Act (tracking hazardous waste)) Organizations: CROSS DAN (CONTACT/OWNER)
, DAN CROSS (CONTACT/OWNER)
ALLIED FABRICATING & WELDING CO (5699 CHANTRY DR in COLUMBUS, OH)
STATE MASTER (Ohio general info) - AIR MAJOR Small Quantity Generators, between 100 kg and 1000 kg of hazardous waste/month (Resource Conservation and Recovery Act (tracking hazardous waste)) - notification Organizations: BRATCHER W E (CONTACT/OWNER)
, UNKNOWN (CONTACT/OWNER)
BONDED 1205 (3006 NOE BIXBY RD in COLUMBUS, OH)
STATE MASTER (Ohio general info) - RCRA-OHD987005840, HAZARDOUS WASTE PROGRAM, AIR MAJOR, -25-5541-899-16, EPCRA Conditionally Exempt Small Quantity Generators, less than 100 kg/month of hazardous waste (Resource Conservation and Recovery Act (tracking hazardous waste)) - notification Organizations: SPEEDWAY/SUPERAMERICA LLC (CONTACT/OPERATOR)
, EMRO MARKETING CO (CONTACT/OWNER)
BOUTSELIS AUTO CARE INC (6050 E LIVINGSTON AVE in COLUMBUS, OH)
STATE MASTER (Ohio general info) - RCRA-OHD000818377, HAZARDOUS WASTE PROGRAM Small Quantity Generators, between 100 kg and 1000 kg of hazardous waste/month (Resource Conservation and Recovery Act (tracking hazardous waste)) - notification Organizations: BOUTSELIS JOHN (CONTACT/OWNER)
BP OIL CO SITE 07813 (2285 S HAMILTON RD in COLUMBUS, OH)
STATE MASTER (Ohio general info) - RCRA-OHD987016524, HAZARDOUS WASTE PROGRAM, AIR MAJOR, -25-5541-168-33, EPCRA Conditionally Exempt Small Quantity Generators, less than 100 kg/month of hazardous waste (Resource Conservation and Recovery Act (tracking hazardous waste)) - notification Organizations: BP OIL COMPANY (CONTACT/OWNER)
ARTS & COLLEGE PREPARATORY ACA (2002 S HAMILTON RD in COLUMBUS, OH)
(National Center for Education Statistics) - STATE ID-143610
ASBURY ELEMENTARY SCHOOL (5127 HARBOR BLVD in COLUMBUS, OH)
(National Center for Education Statistics) - STATE ID-001073 Organizations: GROVEPORT MADISON LOCAL SD (SCHOOL DISTRICT)
Housing units lacking complete plumbing facilities: 1.0% Housing units lacking complete kitchen facilities: 2.3%
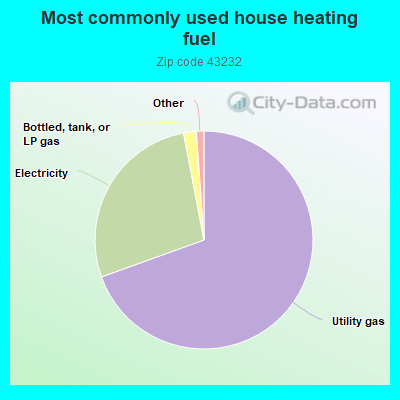
69.5%Utility gas
27.5%Electricity
1.9%Bottled, tank, or LP gas
Population in 1990: 38,848. Population change in the 1990s: +1,133 (+2.9%).
Place of birth for U.S.-born residents:
This state: 31,015
Northeast: 1,942
Midwest: 2,090
South: 4,706
West: 916
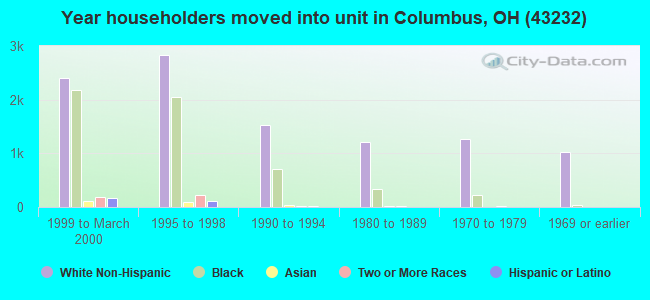
46% of the 43232 zip code residents lived in the same house 5 years ago. Out of people who lived in different houses, 66% lived in this county. Out of people who lived in different counties, 50% lived in Ohio.
88% of the 43232 zip code residents lived in the same house 1 year ago. Out of people who lived in different houses, 68% moved from this county. Out of people who lived in different houses, 15% moved from different county within same state. Out of people who lived in different houses, 10% moved from different state. Out of people who lived in different houses, 4% moved from abroad.
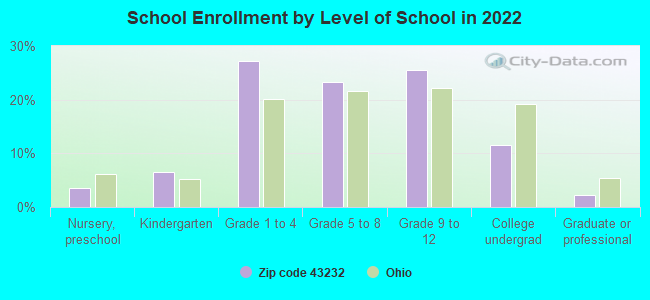
Private vs. public school enrollment:
Students in private schools in grades 1 to 8 (elementary and middle school): 844
Here:
15.0%
Ohio:
16.0%
Students in private schools in grades 9 to 12 (high school): 418
Here:
14.6%
Ohio:
13.1%
Students in private undergraduate colleges: 389
Here:
30.1%
Ohio:
22.3%
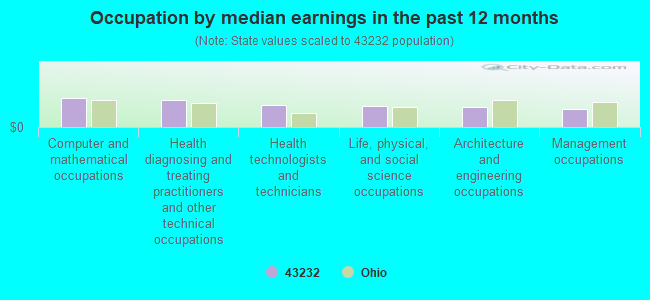
Occupation by median earnings in the past 12 months ($)
77,763Computer and mathematical occupations
71,896Health diagnosing and treating practitioners and other technical occupations
57,867Health technologists and technicians
54,928Life, physical, and social science occupations
54,096Architecture and engineering occupations
48,896Management occupations
Companies with biggest federal contracts located in this zip code (COLUMBUS, OH):
SALEM MANUFACTURING AND SALES (2856 BANWICK RD; small business) : $765,818 in 86 contractsfrom 2000 to 2006
Contracts for Degaussing and Mine Sweeping Equipment, Miscellaneous Vehicular Components, Valves, Nonpowered, Miscellaneous Power Transmission Equipment, and moreby Defense Logistics Agency, Navy Signed by year:2000: $57,900; 2001: $98,913; 2002: $0; 2003: $74,370; 2004: $117,668; 2005: $267,922; 2006: $149,045.
Biggest contracts:
$57,900 with Defense Logistics Agency for Degaussing and Mine Sweeping Equipment. Signed on 2000-11-17. Completion date: 2001-04-16.
$57,280 with Defense Logistics Agency for Miscellaneous Vehicular Components. Signed on 2005-07-15. Completion date: 2006-02-10.
$49,305 with Defense Logistics Agency for Valves, Nonpowered. Signed on 2003-10-01. Completion date: 2003-12-29.
$41,925 with Defense Logistics Agency for Miscellaneous Power Transmission Equipment. Signed on 2001-11-15. Completion date: 2002-06-18.
FOUR POINTS SHERATON (2124 SOUTH HAMILTON ROAD)
$182,400 with Navy for Lodging - Hotel/Motel. Signed on 2001-10-01. Completion date: 2004-09-30.
MC KEE DOOR SALES OF COLUMBUS (3025 NOE BIXBY RD; small business) : $62,625 in 3 contractsfrom 2004 to 2006
$56,220 with Defense Logistics Agency for Maintenance, Repair or Alteration of Real Property -- Other Non-Building Facilities. Signed on 2004-09-07. Completion date: 2005-09-06.
$4,987 with Army for Maintenance, Repair or Alteration of Real Property -- Miscellaneous Buildings. Signed on 2006-06-09. Completion date: 2006-08-06.
$1,418 with Defense Logistics Agency for Marine Hardware and Hull Items. Signed on 2006-06-07. Completion date: 2006-06-07.
KELLER ENVIRONMENTAL COMPANY (3909 GROVES RD; small business)
$50,750 with Defense Logistics Agency for Maintenance, Repair or Alteration of Real Property -- Other Non-Building Facilities. Signed on 2000-12-04. Completion date: 2001-12-03.
J P MAINTENANCE SERVICE INC (3314 REFUGEE RD; small business)
$37,200 with Army for Custodial Janitorial Services. Signed on 2001-02-28. Completion date: 2004-02-28.
CBG BIOTECH LTD (2211 LAKE CLUB DRIVE STE 2; small business) : $23,898 in 6 contractsfrom 2003 to 2005
Contracts for Maintenance, Repair and Rebuilding of Equipment -- Instruments and Laboratory Equipment, Maintenance, Repair and Rebuilding of Equipment -- Medical, Dental, and Veterinary Equipment and Supplies by Army Signed by year:2000: $0; 2001: $0; 2002: $0; 2003: $7,160; 2004: $8,560; 2005: $8,178; 2006: $0.
Biggest contracts:
$12,458 with Army for Maintenance, Repair and Rebuilding of Equipment -- Instruments and Laboratory Equipment. Signed on 2005-09-22. Completion date: 2004-09-22.
$8,560, same as above.Signed on 2004-02-16. Completion date: 2004-09-22.
$7,160 with Army for Maintenance, Repair and Rebuilding of Equipment -- Medical, Dental, and Veterinary Equipment and Supplies. Signed on 2003-10-15. Completion date: 2004-09-30.
$0 with Army for Maintenance, Repair and Rebuilding of Equipment -- Instruments and Laboratory Equipment. Signed on 2004-02-16. Completion date: 2004-09-22.
INNKEEPERS HOSPITALITY III, IN (2084 SOUTH HAMILTON ROAD) : $15,608 in 2 contractsin 2004
$13,650 with Army for Lodging - Hotel/Motel. Signed on 2004-01-26. Completion date: 2004-02-09.
$1,958, same as above.Signed on 2004-02-27. Completion date: 2004-02-09.
BRE/ESA OPERATING LESSEE INC (2200 LAKE CLUB DR) : $5,302 in 8 contractsfrom 2005 to 2006
Contracts for Lodging - Hotel/Motel by Army Signed by year:2000: $0; 2001: $0; 2002: $0; 2003: $0; 2004: $0; 2005: $9,102; 2006: -$3,800.
Biggest contracts:
$5,599 with Army for Lodging - Hotel/Motel. Signed on 2005-09-01. Completion date: 2005-09-30.
$1,960 with Army for Lodging - Hotel/Motel. Taking place in IN. Signed on 2005-08-01. Completion date: 2005-08-31.
$1,377 with Army for Lodging - Hotel/Motel. Signed on 2005-10-01. Completion date: 2005-10-31.
$166, same as above.Signed on 2005-11-01. Completion date: 2005-11-30.
GREATER COLUMBUS TRANSFER INC (4740 S GROVES RD; small business)
$5,208 with Army for Motor Freight. Signed on 2004-01-20. Completion date: 2004-01-28.
FORMWARE INC (3441 WINCHESTER PIKE; small business)
$4,600 with Army for Office Supplies. Signed on 2005-08-20. Completion date: 2005-07-31.
Top industries in this zip code by the number of employees in 2005:
Administrative and Support and Waste Management and Remediation Services: Telephone Answering Services (over 1000 employees: 1 establishment)
Administrative and Support and Waste Management and Remediation Services: Temporary Help Services (250-499: 1, 100-249: 1, 50-99: 4, 20-49: 1, 1-4: 1)
2002 - 2018 National Fire Incident Reporting System (NFIRS) incidents
Based on the data from the years 2002 - 2018 the average number of fire incidents per year is 176. The highest number of reported fire incidents - 218 took place in 2017, and the least - 137 in 2011. The data has a decreasing trend.
When looking into fire subcategories, the most incidents belonged to: Structure Fires (42.6%), and Outside Fires (31.3%).
Fire incident types reported to NFIRS in Zip Code 43232
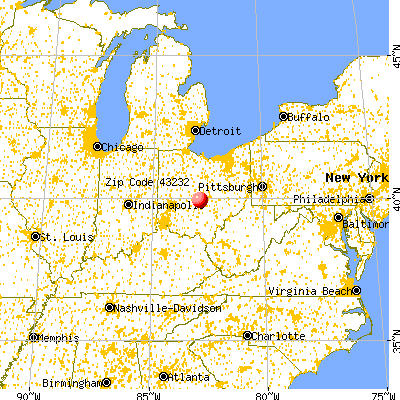


 Nearest zip codes: 43227, 43109, 43213, 43209, 43125, 43068.


 Based on the data from the years 2002 - 2018 the average number of fire incidents per year is 176. The highest number of reported fire incidents - 218 took place in 2017, and the least - 137 in 2011. The data has a decreasing trend.
 When looking into fire subcategories, the most incidents belonged to: Structure Fires (42.6%), and Outside Fires (31.3%).