Estimated zip code population in 2022: 14,189 Zip code population in 2010: 12,161 Zip code population in 2000: 9,772
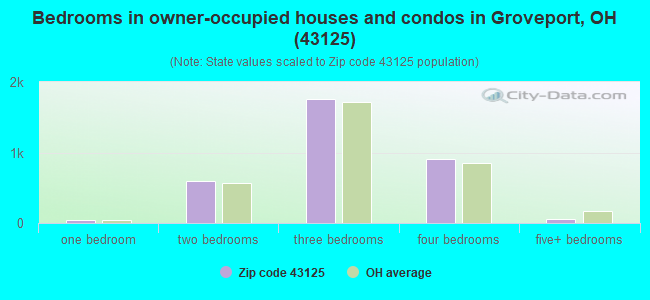
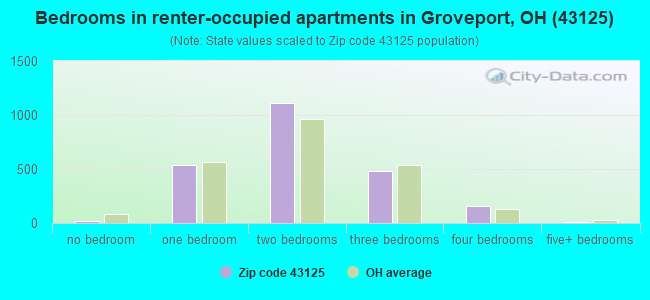
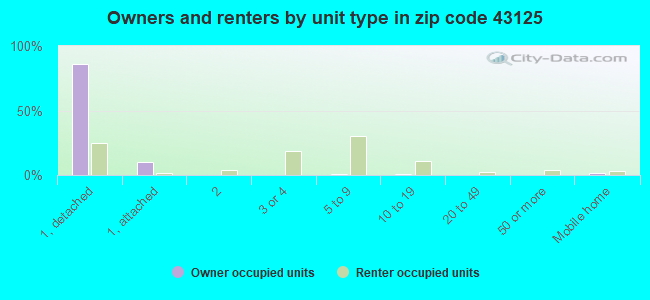
Houses and condos: 5,872 Renter-occupied apartments: 2,299
% of renters here:
41%
State:
33%
March 2022 cost of living index in zip code 43125: 95.0 (less than average, U.S. average is 100)
Land area: 31.4 sq. mi. Water area: 0.7 sq. mi.
Population density: 452 people per square mile
(low).
OSM Map
General Map
Google Map
MSN Map
OSM Map
General Map
Google Map
MSN Map
OSM Map
General Map
Google Map
MSN Map
OSM Map
General Map
Google Map
MSN Map
Please wait while loading the map...
Real estate property taxes paid for housing units in 2022:
This zip code:
1.4% ($3,164)
Ohio:
1.3% ($2,639)
Median real estate property taxes paid for housing units with mortgages in 2022: $3,370 (1.4%) Median real estate property taxes paid for housing units with no mortgage in 2022: $2,849 (1.5%)
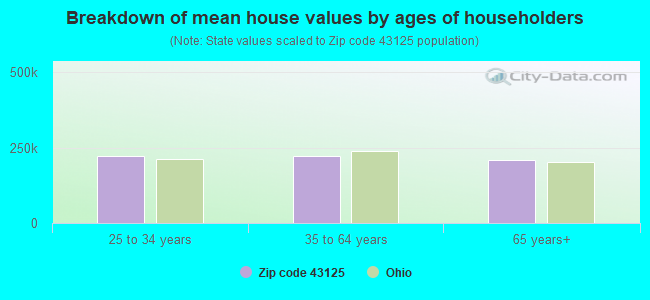
Estimated median house/condo value in 2022: $224,031
43125:
$224,031
Ohio:
$204,100
According to our research of Ohio and other state lists, there were 20 registered sex offenders living in 43125 zip code as of April 27, 2024. The ratio of all residents to sex offenders in zip code 43125 is 691 to 1. The ratio of registered sex offenders to all residents in this zip code is lower than the state average.
Median resident age:
This zip code:
41.9 years
Ohio median age:
39.9 years
Average household size:
This zip code:
2.5 people
Ohio:
2.4 people
Averages for the 2020 tax year for zip code 43125, filed in 2021:
Average Adjusted Gross Income (AGI) in 2020: $53,271 (Individual Income Tax Returns)
Here:
$53,271
State:
$67,288
Salary/wage: $47,968 (reported on 82.9% of returns)
Here:
$47,968
State:
$55,628
(% of AGI for various income ranges: 1195.3% for AGIs below $25k, 3678.2% for AGIs $25k-50k, 6362.3% for AGIs $50k-75k, 9859.8% for AGIs $75k-100k, 16483.8% for AGIs $100k-200k, 62605.0% for AGIs over 200k)
Taxable interest for individuals: $643 (reported on 19.7% of returns)
This zip code:
$643
Ohio:
$1,518
(% of AGI for various income ranges: 8.4% for AGIs below $25k, 7.6% for AGIs $25k-50k, 19.2% for AGIs $50k-75k, 30.7% for AGIs $75k-100k, 48.4% for AGIs $100k-200k, 390.0% for AGIs over 200k)
Ordinary dividends: $2,109 (reported on 11.2% of returns)
Here:
$2,109
State:
$7,167
(% of AGI for various income ranges: 12.4% for AGIs below $25k, 10.5% for AGIs $25k-50k, 35.0% for AGIs $50k-75k, 66.0% for AGIs $75k-100k, 119.0% for AGIs $100k-200k, 395.0% for AGIs over 200k)
Net capital gain/loss in AGI: +$6,743 (reported on 9.9% of returns)
Here:
+$6,743
State:
+$18,919
(% of AGI for various income ranges: 4.8% for AGIs below $25k, 11.5% for AGIs $25k-50k, 51.2% for AGIs $50k-75k, 170.9% for AGIs $75k-100k, 423.8% for AGIs $100k-200k, 5915.0% for AGIs over 200k)
Profit/loss from business: +$6,612 (reported on 13.7% of returns)
Here:
+$6,612
State:
+$13,744
(% of AGI for various income ranges: 45.1% for AGIs below $25k, 60.6% for AGIs $25k-50k, 107.5% for AGIs $50k-75k, 118.9% for AGIs $75k-100k, 353.6% for AGIs $100k-200k, 7430.0% for AGIs over 200k)
Taxable individual retirement arrangement distribution: $14,734 (reported on 7.8% of returns)
43125:
$14,734
Ohio:
$18,876
(% of AGI for various income ranges: 55.9% for AGIs below $25k, 74.7% for AGIs $25k-50k, 169.8% for AGIs $50k-75k, 287.3% for AGIs $75k-100k, 613.6% for AGIs $100k-200k)
Total itemized deductions: $26,060 (reported on 5.9% of returns)
Here:
$26,060
State:
$33,869
(% of AGI for various income ranges: 95.4% for AGIs $25k-50k, 251.6% for AGIs $50k-75k, 477.1% for AGIs $75k-100k, 952.4% for AGIs $100k-200k)
Charity contributions: $9,066 (reported on 4.2% of returns)
Here:
$9,066
State:
$14,577
(% of AGI for various income ranges: 15.1% for AGIs $25k-50k, 55.2% for AGIs $50k-75k, 106.7% for AGIs $75k-100k, 294.0% for AGIs $100k-200k)
Taxes paid: $6,998 (reported on 5.9% of returns)
43125:
$6,998
State:
$7,681
(% of AGI for various income ranges: 21.4% for AGIs $25k-50k, 67.5% for AGIs $50k-75k, 153.1% for AGIs $75k-100k, 244.2% for AGIs $100k-200k)
Earned income credit: $2,183 (reported on 14.3% of returns)
Here:
$2,183
State:
$2,304
(% of AGI for various income ranges: 82.4% for AGIs below $25k, 54.9% for AGIs $25k-50k)
Percentage of individuals using paid preparers for their 2020 taxes: 93.3%
Here:
93%
State:
94%
(% for various income ranges: 93.0% for AGIs below $25k, 94.0% for AGIs $25k-50k, 93.7% for AGIs $50k-75k, 92.6% for AGIs $75k-100k, 92.8% for AGIs $100k-200k, 87.5% for AGIs over 200k)
Averages for the 2012 tax year for zip code 43125, filed in 2013:
Average Adjusted Gross Income (AGI) in 2012: $45,022 (Individual Income Tax Returns)
Here:
$45,022
State:
$54,926
Salary/wage: $40,797 (reported on 84.5% of returns)
Here:
$40,797
State:
$45,869
(% of AGI for various income ranges: 72.2% for AGIs below $25k, 79.8% for AGIs $25k-50k, 78.4% for AGIs $50k-75k, 79.9% for AGIs $75k-100k, 74.5% for AGIs $100k-200k, 46.8% for AGIs over 200k)
Taxable interest for individuals: $639 (reported on 25.2% of returns)
This zip code:
$639
Ohio:
$1,297
(% of AGI for various income ranges: 0.8% for AGIs below $25k, 0.3% for AGIs $25k-50k, 0.3% for AGIs $50k-75k, 0.3% for AGIs $75k-100k, 0.3% for AGIs $100k-200k, 0.5% for AGIs over 200k)
Ordinary dividends: $1,983 (reported on 13.4% of returns)
Here:
$1,983
State:
$5,821
(% of AGI for various income ranges: 0.7% for AGIs below $25k, 0.5% for AGIs $25k-50k, 0.4% for AGIs $50k-75k, 0.7% for AGIs $75k-100k, 0.8% for AGIs $100k-200k)
Net capital gain/loss in AGI: +$1,814 (reported on 8.6% of returns)
Here:
+$1,814
State:
+$11,232
(% of AGI for various income ranges: 0.2% for AGIs $25k-50k, 0.5% for AGIs $75k-100k, 1.2% for AGIs $100k-200k)
Profit/loss from business: +$7,558 (reported on 12.7% of returns)
Here:
+$7,558
State:
+$12,773
(% of AGI for various income ranges: 6.1% for AGIs below $25k, 1.9% for AGIs $25k-50k, 1.7% for AGIs $50k-75k, 1.4% for AGIs $75k-100k, 2.1% for AGIs $100k-200k)
Taxable individual retirement arrangement distribution: $11,223 (reported on 9.7% of returns)
43125:
$11,223
Ohio:
$14,511
(% of AGI for various income ranges: 3.0% for AGIs below $25k, 2.1% for AGIs $25k-50k, 2.3% for AGIs $50k-75k, 2.4% for AGIs $75k-100k, 3.2% for AGIs $100k-200k)
Total itemized deductions: $16,939 (24% of AGI, reported on 34.0% of returns)
Here:
$16,939
State:
$21,278
Here:
23.6% of AGI
State:
18.8% of AGI
(% of AGI for various income ranges: 9.6% for AGIs below $25k, 9.7% for AGIs $25k-50k, 13.5% for AGIs $50k-75k, 15.3% for AGIs $75k-100k, 15.3% for AGIs $100k-200k, 10.9% for AGIs over 200k)
Charity contributions: $3,013 (reported on 26.3% of returns)
Here:
$3,013
State:
$3,943
(% of AGI for various income ranges: 0.7% for AGIs below $25k, 1.2% for AGIs $25k-50k, 1.8% for AGIs $50k-75k, 2.2% for AGIs $75k-100k, 2.4% for AGIs $100k-200k, 2.3% for AGIs over 200k)
Taxes paid: $6,374 (reported on 33.8% of returns)
43125:
$6,374
State:
$9,568
(% of AGI for various income ranges: 1.9% for AGIs below $25k, 2.8% for AGIs $25k-50k, 5.1% for AGIs $50k-75k, 6.2% for AGIs $75k-100k, 6.9% for AGIs $100k-200k, 5.5% for AGIs over 200k)
Earned income credit: $2,180 (reported on 15.6% of returns)
Here:
$2,180
State:
$2,285
(% of AGI for various income ranges: 5.6% for AGIs below $25k, 0.8% for AGIs $25k-50k)
Percentage of individuals using paid preparers for their 2012 taxes: 42.6%
Here:
43%
State:
51%
(% for various income ranges: 37.7% for AGIs below $25k, 41.6% for AGIs $25k-50k, 48.2% for AGIs $50k-75k, 46.2% for AGIs $75k-100k, 51.1% for AGIs $100k-200k, 66.7% for AGIs over 200k)
Averages for the 2004 tax year for zip code 43125, filed in 2005:
Average Adjusted Gross Income (AGI) in 2004: $40,616 (Individual Income Tax Returns)
Here:
$40,616
State:
$44,480
Salary/wage: $38,308 (reported on 85.9% of returns)
Here:
$38,308
State:
$39,198
(% of AGI for various income ranges: 121.7% for AGIs below $10k, 72.6% for AGIs $10k-25k, 82.2% for AGIs $25k-50k, 84.1% for AGIs $50k-75k, 85.6% for AGIs $75k-100k, 69.2% for AGIs over 100k)
Taxable interest for individuals: $939 (reported on 41.0% of returns)
This zip code:
$939
Ohio:
$1,532
(% of AGI for various income ranges: 5.2% for AGIs below $10k, 2.0% for AGIs $10k-25k, 0.8% for AGIs $25k-50k, 0.7% for AGIs $50k-75k, 0.9% for AGIs $75k-100k, 0.6% for AGIs over 100k)
Taxable dividends: $1,283 (reported on 18.2% of returns)
Here:
$1,283
State:
$3,496
(% of AGI for various income ranges: 2.9% for AGIs below $10k, 0.8% for AGIs $10k-25k, 0.4% for AGIs $25k-50k, 0.4% for AGIs $50k-75k, 0.5% for AGIs $75k-100k, 0.9% for AGIs over 100k)
Net capital gain/loss: +$2,301 (reported on 12.9% of returns)
Here:
+$2,301
State:
+$8,582
(% of AGI for various income ranges: -1.2% for AGIs below $10k, -0.2% for AGIs $10k-25k, 0.2% for AGIs $25k-50k, 0.4% for AGIs $50k-75k, 0.8% for AGIs $75k-100k, 3.1% for AGIs over 100k)
Profit/loss from business: +$7,268 (reported on 13.0% of returns)
Here:
+$7,268
State:
+$10,813
(% of AGI for various income ranges: -1.4% for AGIs below $10k, 4.3% for AGIs $10k-25k, 1.6% for AGIs $25k-50k, 1.8% for AGIs $50k-75k, 1.3% for AGIs $75k-100k, 5.1% for AGIs over 100k)
Profit/loss from farming: +$3,686 (reported on 0.6% of returns)
Here:
+$3,686
State:
-$3,706
IRA payment deduction: $2,670 (reported on 1.8% of returns)
43125:
$2,670
Ohio:
$2,794
(% of AGI for various income ranges: 0.1% for AGIs $10k-25k, 0.2% for AGIs $25k-50k, 0.1% for AGIs $50k-75k, 0.2% for AGIs $75k-100k)
Self-employed pension: $11,059 (reported on 0.3% of returns)
Here:
$11,059
Ohio:
$13,981
Total itemized deductions: $15,561 (26% of AGI, reported on 43.4% of returns)
Here:
$15,561
State:
$17,503
Here:
25.5% of AGI
State:
20.8% of AGI
(% of AGI for various income ranges: 19.5% for AGIs below $10k, 11.2% for AGIs $10k-25k, 15.6% for AGIs $25k-50k, 18.1% for AGIs $50k-75k, 18.4% for AGIs $75k-100k, 17.2% for AGIs over 100k)
Charity contributions deductions: $2,248 (4% of AGI, reported on 36.6% of returns)
Here:
$2,248
State:
$3,087
Here:
3.6% of AGI
State:
3.4% of AGI
(% of AGI for various income ranges: 0.9% for AGIs below $10k, 1.2% for AGIs $10k-25k, 1.6% for AGIs $25k-50k, 2.5% for AGIs $50k-75k, 2.5% for AGIs $75k-100k, 2.2% for AGIs over 100k)
Total tax: $4,674 (reported on 80.9% of returns)
43125:
$4,674
State:
$6,781
(% of AGI for various income ranges: 3.3% for AGIs below $10k, 4.3% for AGIs $10k-25k, 7.4% for AGIs $25k-50k, 9.2% for AGIs $50k-75k, 10.1% for AGIs $75k-100k, 16.2% for AGIs over 100k)
Earned income credit: $1,645 (reported on 10.7% of returns)
Here:
$1,645
State:
$1,696
Percentage of individuals using paid preparers for their 2004 taxes: 50.3%
Here:
50%
State:
55%
(% for various income ranges: 39.9% for AGIs below $10k, 51.9% for AGIs $10k-25k, 52.2% for AGIs $25k-50k, 54.4% for AGIs $50k-75k, 45.7% for AGIs $75k-100k, 54.2% for AGIs over 100k)
Likely homosexual households (counted as self-reported same-sex unmarried-partner households)
Lesbian couples: 0.8% of all households
Gay men: 0.2% of all households
Household received Food Stamps/SNAP in the past 12 months: 543 Household did not receive Food Stamps/SNAP in the past 12 months: 5,129
Women who had a birth in the past 12 months: 246 (193 now married, 55 unmarried) Women who did not have a birth in the past 12 months: 2,972 (1,267 now married, 1,704 unmarried)
Housing units in zip code 43125 with a mortgage: 2,204 (222 second mortgage, 28 home equity loan, 173 both second mortgage and home equity loan) Houses without a mortgage: 66
Median monthly owner costs for units with a mortgage: $1,447 Median monthly owner costs for units without a mortgage: $586
Residents with income below the poverty level in 2022:
This zip code:
8.0%
Whole state:
13.4%
Residents with income below 50% of the poverty level in 2022:
This zip code:
6.6%
Whole state:
7.0%
Median number of rooms in houses and condos:
Here:
6.4
State:
6.7
Median number of rooms in apartments:
Here:
4.3
State:
4.4
Notable locations in this zip code not listed on our city pages
Notable locations in zip code 43125: Groveport Golf Course (A), Groveport Commerce Center (B), Madison Township Fire Department Station 181 (C), Groveport City Hall (D), Madison Township Community Center (E). Display/hide their locations on the map
Churches in zip code 43125 include: Saint Vincents Church (A), Fellowship Baptist Church (B), Church of Christ (C), Saint Marys Roman Catholic Church (D), Wesley Chapel Methodist Church (E), Zion Evangelical Church (F), Hopewell Church (G). Display/hide their locations on the map
Cemeteries: Hopewell Cemetery (1), Asbury Methodist Episcopal Cemetery (2), Groveport Cemetery (3), Hendren Cemetery (4), Walton Cemetery (5), Rarey Cemetery (6). Display/hide their locations on the map
In group quarters: 7 (-1 institutionalized population)
Size of family households: 1,784 2-persons, 823 3-persons, 687 4-persons, 268 5-persons, 218 6-persons, 86 7-or-more-persons
Size of nonfamily households: 1,616 1-person, 152 2-persons, 22 3-persons
1,609 married couples with children.
1,303 single-parent households (150 men, 1,153 women).
94.7% of residents of 43125 zip code speak English at home.
1.8% of residents speak Spanish at home (91% very well, 3% well, 6% not well).
1.8% of residents speak other Indo-European language at home (68% very well, 25% well, 7% not at all).
0.4% of residents speak Asian or Pacific Island language at home (63% very well, 37% well).
0.7% of residents speak other language at home (66% very well, 5% well, 28% not at all).
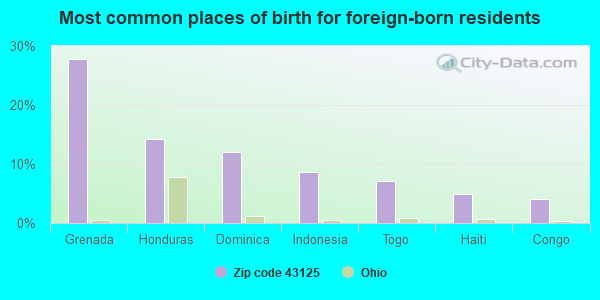
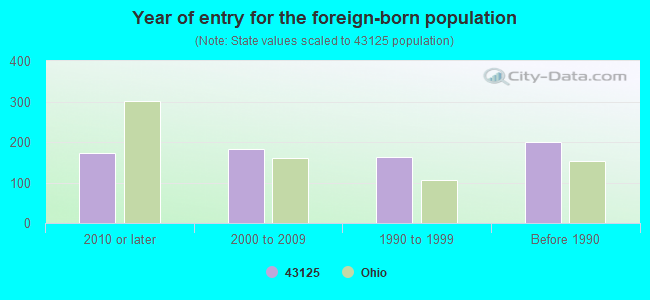
Foreign born population: 557 (3.9%) (76.5% of them are naturalized citizens)
This zip code:
3.9%
Whole state:
5.0%
28%Grenada
14%Honduras
12%Dominica
9%Indonesia
7%Togo
5%Haiti
4%Congo
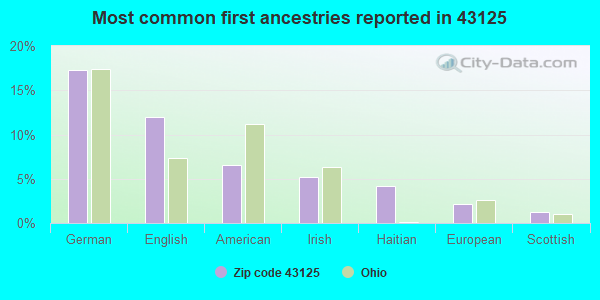
17%German
12%English
7%American
5%Irish
4%Haitian
2%European
1%Scottish
Year of entry for the foreign-born population
1742010 or later
1832000 to 2009
1641990 to 1999
201Before 1990
Facilities with environmental interests located in this zip code:
CHARLIES AUTOBODY (4309 DIRECTORS BOULEVARD in GROVEPORT, OH)
STATE MASTER (Ohio general info) - EPCRA, AIR MAJOR (Resource Conservation and Recovery Act (tracking hazardous waste)) Business SIC classification: TOP, BODY, AND UPHOLSTERY REPAIR SHOPS AND PAINT SHOPS Organizations: TRUGREEN-CHEMLAWN (CONTACT/OWNER)
Alternative names: CHEMICAL LAWN SERVICES CORPORATION, TRUGREEN-CHEMLAWN
CENTURY ACRES WWTP (EAST END OF GREENGATE DRIVE in GROVEPORT, OH)
STATE MASTER (Ohio general info) - PCS-OH0054992, National Pollutant Discharge Elimination System Permit National Pollutant Discharge Elimination System NON-MAJOR (Tracking pollutant discharge elimination systems) - permit Business SIC classification: SEWERAGE SYSTEMS Organizations: FRANKLIN CO BRD OF COMM (CONTACT/OWNER)
Alternative names: FRANKLIN CO. COMMISSIONERS, FRANKLIN CTY SANITARY ENGS., FRANKLIN CTY SANITARY ENGS CENTURY ACRES STP
ADVENT DESIGNS (4091 VENTURE PLACE in GROVEPORT, OH)
STATE MASTER (Ohio general info) - RCRA-OHR000002618, HAZARDOUS WASTE PROGRAM Conditionally Exempt Small Quantity Generators, less than 100 kg/month of hazardous waste (Resource Conservation and Recovery Act (tracking hazardous waste)) - notification Organizations: ED & JUDY ZELL (CONTACT/OWNER)
CHEMBAR INC (302 C LOWERY COURT in GROVEPORT, OH)
STATE MASTER (Ohio general info) - RCRA-OHD099726184, HAZARDOUS WASTE PROGRAM Small Quantity Generators, between 100 kg and 1000 kg of hazardous waste/month (Resource Conservation and Recovery Act (tracking hazardous waste)) - notification Organizations: KILPATRICK ROBERT (CONTACT/OWNER)
(National Center for Education Statistics) - STATE ID-119842 Organizations: EASTLAND-FAIRFIELD CAREER/TEC (SCHOOL DISTRICT)
CHEMPOINT.COM (C/O DHL COLUMBUS WRHS) (2400 SPIEGEL DR in GROVEPORT, OH)
Large Quantity Generators, more that 1000 kg of hazardous waste/month (Resource Conservation and Recovery Act (tracking hazardous waste)) Organizations: DHL COLUMBUS WAREHOUSE (CONTACT/OWNER)
AMERICAN ELECTRIC POWER CORP LAB (4001 BIXBY RD in GROVEPORT, OH)
Conditionally Exempt Small Quantity Generators, less than 100 kg/month of hazardous waste (Resource Conservation and Recovery Act (tracking hazardous waste)) - notification Organizations: AMERICAN ELECTRIC POWER CORPORATION (CONTACT/OWNER)
CHEMICAL WASTE MANAGEMENT INC (4700 HOMER OHIO LANE in GROVEPORT, OH)
COMPLIANCE ACTIVITY (Tracking inspections of insecticide, fungicide, and rodenticide, and toxic substances)
Housing units lacking complete kitchen facilities: 0.7%
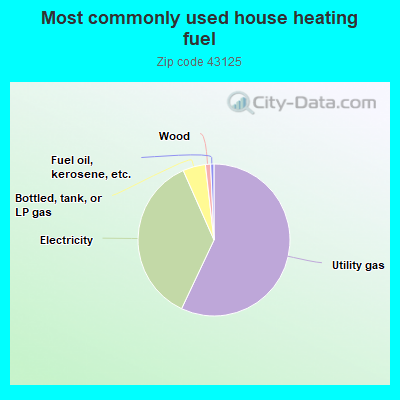
56.8%Utility gas
36.2%Electricity
4.8%Bottled, tank, or LP gas
1.1%Wood
0.7%Fuel oil, kerosene, etc.
Population in 1990: 7,728. Population change in the 1990s: +2,044 (+26.4%).
Place of birth for U.S.-born residents:
This state: 10,809
Northeast: 465
Midwest: 551
South: 1,033
West: 583
51% of the 43125 zip code residents lived in the same house 5 years ago. Out of people who lived in different houses, 70% lived in this county. Out of people who lived in different counties, 50% lived in Ohio.
89% of the 43125 zip code residents lived in the same house 1 year ago. Out of people who lived in different houses, 56% moved from this county. Out of people who lived in different houses, 17% moved from different county within same state. Out of people who lived in different houses, 25% moved from different state.
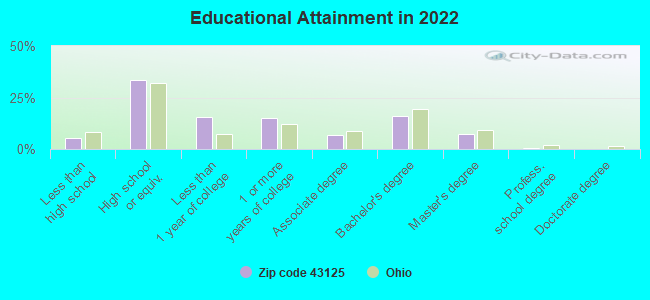
Private vs. public school enrollment:
Students in private schools in grades 1 to 8 (elementary and middle school): 121
Here:
8.2%
Ohio:
16.0%
Students in private schools in grades 9 to 12 (high school): 27
Here:
4.6%
Ohio:
13.1%
Students in private undergraduate colleges: 41
Here:
12.3%
Ohio:
22.3%
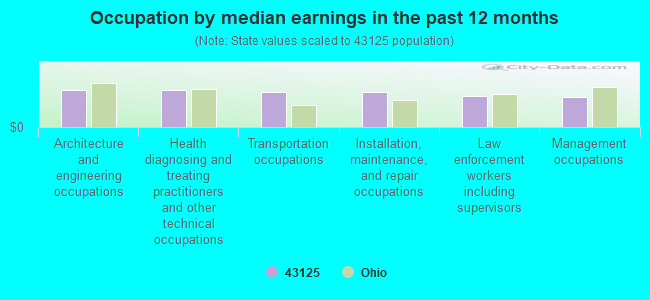
Occupation by median earnings in the past 12 months ($)
85,236Architecture and engineering occupations
84,050Health diagnosing and treating practitioners and other technical occupations
80,734Transportation occupations
79,607Installation, maintenance, and repair occupations
70,709Law enforcement workers including supervisors
69,123Management occupations
Companies with federal contracts located in this zip code:
VERIZON COMMUNICATIONS (4375 PROFESSIONAL PARKWAY in GROVEPORT, OH) : $18,653 in 2 contractsfrom 2002 to 2004
$12,943 with Navy for Communications Services. Taking place in ME. Signed on 2004-08-26. Completion date: 2004-09-10.
$5,710 with U.S. Army Corps of Engineers - civil program financing only for Telephone and Telegraph Equipment. Signed on 2002-04-10. Completion date: 2002-05-10.
Top industries in this zip code by the number of employees in 2005:
Other Services (except Public Administration): Computer and Office Machine Repair and Maintenance (500-999 employees: 1 establishment)
Health Care and Social Assistance: Vocational Rehabilitation Services (250-499: 1)
Administrative and Support and Waste Management and Remediation Services: Landscaping Services (50-99: 2, 20-49: 1, 10-19: 1, 5-9: 1, 1-4: 3)
Management of Companies and Enterprises: Corporate, Subsidiary, and Regional Managing Offices (100-249: 1, 10-19: 1, 5-9: 2, 1-4: 2)
People in group quarters in 2000:
10 people in agriculture workers' dormitories on farms
6 people in mental (psychiatric) hospitals or wards
Fatal accident statistics in 2014:
Fatal accident count: 1
Vehicles involved in fatal accidents: 1
Fatal accidents caused by drunken drivers: 1
Fatalities: 1
Persons involved in fatal accidents: 2
Pedestrians involved in fatal accidents: 0
Fatal accident statistics in 2013:
Fatal accident count: 3
Vehicles involved in fatal accidents: 6
Fatal accidents caused by drunken drivers: 0
Fatalities: 3
Persons involved in fatal accidents: 6
Pedestrians involved in fatal accidents: 1
Home Mortgage Disclosure Act Aggregated Statistics For Year 2009 (Based on 1 full and 8 partial tracts)
A) FHA, FSA/RHS & VA Home Purchase Loans
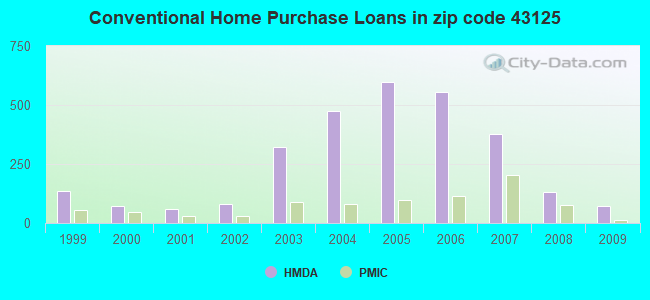
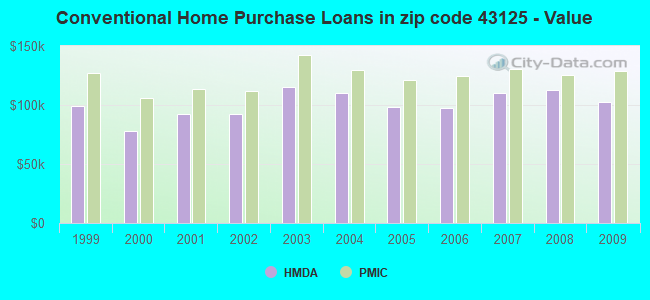
B) Conventional Home Purchase Loans
C) Refinancings
D) Home Improvement Loans
E) Loans on Dwellings For 5+ Families
F) Non-occupant Loans on < 5 Family Dwellings (A B C & D)
G) Loans On Manufactured Home Dwelling (A B C & D)
Number
Average Value
Number
Average Value
Number
Average Value
Number
Average Value
Number
Average Value
Number
Average Value
Number
Average Value
LOANS ORIGINATED
256
$111,315
71
$102,772
389
$126,151
10
$21,261
4
$4,562,708
20
$80,698
0
$0
APPLICATIONS APPROVED, NOT ACCEPTED
10
$98,365
10
$84,832
37
$117,765
3
$29,757
0
$0
3
$68,623
2
$54,650
APPLICATIONS DENIED
41
$103,834
14
$128,394
225
$134,091
35
$15,000
0
$0
13
$73,703
2
$13,165
APPLICATIONS WITHDRAWN
31
$104,980
8
$143,062
106
$134,352
4
$26,735
0
$0
3
$82,407
0
$0
FILES CLOSED FOR INCOMPLETENESS
6
$110,273
3
$73,203
39
$137,464
3
$78,780
0
$0
1
$149,410
0
$0
Aggregated Statistics For Year 2008 (Based on 1 full and 8 partial tracts)
A) FHA, FSA/RHS & VA Home Purchase Loans
B) Conventional Home Purchase Loans
C) Refinancings
D) Home Improvement Loans
E) Loans on Dwellings For 5+ Families
F) Non-occupant Loans on < 5 Family Dwellings (A B C & D)
G) Loans On Manufactured Home Dwelling (A B C & D)
Number
Average Value
Number
Average Value
Number
Average Value
Number
Average Value
Number
Average Value
Number
Average Value
Number
Average Value
LOANS ORIGINATED
203
$118,177
133
$112,659
221
$120,787
24
$16,021
4
$812,132
40
$107,795
0
$0
APPLICATIONS APPROVED, NOT ACCEPTED
13
$116,118
18
$116,781
44
$130,908
16
$14,406
0
$0
8
$92,369
2
$49,000
APPLICATIONS DENIED
58
$116,684
42
$104,338
280
$127,459
92
$29,835
3
$1,591,093
17
$94,563
2
$31,375
APPLICATIONS WITHDRAWN
25
$145,872
17
$95,570
89
$117,213
7
$47,770
0
$0
6
$87,873
0
$0
FILES CLOSED FOR INCOMPLETENESS
3
$135,620
4
$122,848
26
$160,494
3
$114,310
1
$1,595,600
3
$75,027
0
$0
Aggregated Statistics For Year 2007 (Based on 1 full and 8 partial tracts)
A) FHA, FSA/RHS & VA Home Purchase Loans
B) Conventional Home Purchase Loans
C) Refinancings
D) Home Improvement Loans
E) Loans on Dwellings For 5+ Families
F) Non-occupant Loans on < 5 Family Dwellings (A B C & D)
G) Loans On Manufactured Home Dwelling (A B C & D)
Number
Average Value
Number
Average Value
Number
Average Value
Number
Average Value
Number
Average Value
Number
Average Value
Number
Average Value
LOANS ORIGINATED
147
$134,957
376
$110,485
366
$110,146
49
$32,057
1
$12,764,800
67
$91,765
0
$0
APPLICATIONS APPROVED, NOT ACCEPTED
10
$130,788
48
$114,872
106
$129,564
9
$49,332
0
$0
12
$85,562
2
$56,860
APPLICATIONS DENIED
29
$130,336
129
$117,098
514
$131,194
79
$52,565
0
$0
31
$101,466
4
$18,190
APPLICATIONS WITHDRAWN
17
$150,360
48
$132,912
174
$135,806
6
$40,700
0
$0
15
$91,243
1
$3,990
FILES CLOSED FOR INCOMPLETENESS
1
$98,930
12
$92,172
52
$138,272
2
$99,460
0
$0
2
$148,390
0
$0
Aggregated Statistics For Year 2006 (Based on 1 full and 8 partial tracts)
A) FHA, FSA/RHS & VA Home Purchase Loans
B) Conventional Home Purchase Loans
C) Refinancings
D) Home Improvement Loans
E) Loans on Dwellings For 5+ Families
F) Non-occupant Loans on < 5 Family Dwellings (A B C & D)
G) Loans On Manufactured Home Dwelling (A B C & D)
Number
Average Value
Number
Average Value
Number
Average Value
Number
Average Value
Number
Average Value
Number
Average Value
Number
Average Value
LOANS ORIGINATED
117
$143,668
555
$97,531
384
$106,142
69
$32,664
2
$267,035
99
$88,864
2
$61,755
APPLICATIONS APPROVED, NOT ACCEPTED
11
$189,333
72
$95,775
114
$112,036
13
$43,968
0
$0
14
$95,796
3
$33,860
APPLICATIONS DENIED
25
$140,340
215
$109,215
553
$126,346
103
$27,810
1
$10,146,360
55
$84,421
15
$49,517
APPLICATIONS WITHDRAWN
23
$140,680
78
$100,652
234
$132,577
16
$61,796
0
$0
30
$82,995
1
$130,000
FILES CLOSED FOR INCOMPLETENESS
3
$156,413
27
$103,953
78
$139,159
2
$41,765
0
$0
6
$91,118
0
$0
Aggregated Statistics For Year 2005 (Based on 1 full and 8 partial tracts)
A) FHA, FSA/RHS & VA Home Purchase Loans
B) Conventional Home Purchase Loans
C) Refinancings
D) Home Improvement Loans
F) Non-occupant Loans on < 5 Family Dwellings (A B C & D)
G) Loans On Manufactured Home Dwelling (A B C & D)
Number
Average Value
Number
Average Value
Number
Average Value
Number
Average Value
Number
Average Value
Number
Average Value
LOANS ORIGINATED
139
$138,826
599
$98,270
508
$115,499
51
$46,845
96
$101,121
2
$12,275
APPLICATIONS APPROVED, NOT ACCEPTED
12
$141,262
98
$97,913
136
$125,602
16
$46,038
20
$63,558
3
$28,417
APPLICATIONS DENIED
29
$144,902
221
$90,795
608
$122,750
107
$40,908
46
$78,910
13
$42,949
APPLICATIONS WITHDRAWN
10
$99,593
82
$104,541
283
$130,288
45
$155,936
15
$103,381
0
$0
FILES CLOSED FOR INCOMPLETENESS
4
$145,395
23
$105,146
86
$133,287
1
$52,860
2
$82,070
0
$0
Aggregated Statistics For Year 2004 (Based on 1 full and 8 partial tracts)
A) FHA, FSA/RHS & VA Home Purchase Loans
B) Conventional Home Purchase Loans
C) Refinancings
D) Home Improvement Loans
E) Loans on Dwellings For 5+ Families
F) Non-occupant Loans on < 5 Family Dwellings (A B C & D)
G) Loans On Manufactured Home Dwelling (A B C & D)
Number
Average Value
Number
Average Value
Number
Average Value
Number
Average Value
Number
Average Value
Number
Average Value
Number
Average Value
LOANS ORIGINATED
200
$138,214
475
$110,097
635
$123,848
54
$43,190
2
$2,329,160
82
$108,738
2
$15,965
APPLICATIONS APPROVED, NOT ACCEPTED
25
$146,736
72
$107,699
140
$126,316
15
$53,662
0
$0
17
$97,883
0
$0
APPLICATIONS DENIED
41
$152,410
127
$103,157
534
$122,577
107
$38,951
0
$0
27
$107,327
10
$30,686
APPLICATIONS WITHDRAWN
33
$138,746
79
$102,483
262
$132,467
17
$28,045
0
$0
9
$156,414
2
$100,645
FILES CLOSED FOR INCOMPLETENESS
4
$128,778
16
$105,672
90
$124,992
4
$58,970
0
$0
3
$191,263
0
$0
Aggregated Statistics For Year 2003 (Based on 1 full and 8 partial tracts)
A) FHA, FSA/RHS & VA Home Purchase Loans
B) Conventional Home Purchase Loans
C) Refinancings
D) Home Improvement Loans
F) Non-occupant Loans on < 5 Family Dwellings (A B C & D)
Number
Average Value
Number
Average Value
Number
Average Value
Number
Average Value
Number
Average Value
LOANS ORIGINATED
196
$140,788
321
$115,244
1,242
$115,042
31
$14,863
69
$86,974
APPLICATIONS APPROVED, NOT ACCEPTED
20
$158,009
62
$107,383
208
$114,637
11
$25,124
11
$92,906
APPLICATIONS DENIED
26
$148,697
61
$84,270
492
$115,282
75
$20,603
15
$69,039
APPLICATIONS WITHDRAWN
26
$131,673
43
$117,702
251
$122,937
7
$26,519
10
$104,999
FILES CLOSED FOR INCOMPLETENESS
4
$126,170
11
$105,425
85
$118,392
2
$13,880
2
$143,665
Aggregated Statistics For Year 2002 (Based on 1 full and 4 partial tracts)
A) FHA, FSA/RHS & VA Home Purchase Loans
B) Conventional Home Purchase Loans
C) Refinancings
D) Home Improvement Loans
E) Loans on Dwellings For 5+ Families
F) Non-occupant Loans on < 5 Family Dwellings (A B C & D)
Number
Average Value
Number
Average Value
Number
Average Value
Number
Average Value
Number
Average Value
Number
Average Value
LOANS ORIGINATED
114
$129,696
82
$92,200
234
$96,428
18
$14,391
1
$900,630
18
$77,817
APPLICATIONS APPROVED, NOT ACCEPTED
7
$149,980
14
$99,116
56
$89,276
2
$7,515
0
$0
3
$66,370
APPLICATIONS DENIED
23
$161,390
34
$66,363
156
$86,509
24
$9,694
0
$0
5
$51,138
APPLICATIONS WITHDRAWN
10
$112,665
10
$88,315
97
$111,050
5
$21,450
0
$0
3
$81,910
FILES CLOSED FOR INCOMPLETENESS
1
$129,000
8
$66,771
35
$105,148
0
$0
0
$0
2
$51,000
Aggregated Statistics For Year 2001 (Based on 1 full and 4 partial tracts)
A) FHA, FSA/RHS & VA Home Purchase Loans
B) Conventional Home Purchase Loans
C) Refinancings
D) Home Improvement Loans
F) Non-occupant Loans on < 5 Family Dwellings (A B C & D)
Number
Average Value
Number
Average Value
Number
Average Value
Number
Average Value
Number
Average Value
LOANS ORIGINATED
97
$124,839
61
$92,581
236
$94,793
28
$30,810
36
$82,679
APPLICATIONS APPROVED, NOT ACCEPTED
7
$151,480
23
$73,517
39
$71,522
13
$14,246
2
$41,415
APPLICATIONS DENIED
2
$166,155
41
$50,462
149
$88,066
34
$9,931
6
$42,483
APPLICATIONS WITHDRAWN
9
$100,313
5
$99,150
71
$87,493
5
$34,560
2
$81,820
FILES CLOSED FOR INCOMPLETENESS
1
$190,000
4
$90,042
17
$91,223
2
$23,290
2
$35,545
Aggregated Statistics For Year 2000 (Based on 1 full and 4 partial tracts)
A) FHA, FSA/RHS & VA Home Purchase Loans
B) Conventional Home Purchase Loans
C) Refinancings
D) Home Improvement Loans
F) Non-occupant Loans on < 5 Family Dwellings (A B C & D)
Number
Average Value
Number
Average Value
Number
Average Value
Number
Average Value
Number
Average Value
LOANS ORIGINATED
63
$124,421
71
$78,044
93
$74,533
28
$16,907
13
$59,182
APPLICATIONS APPROVED, NOT ACCEPTED
21
$61,054
24
$58,165
28
$77,501
7
$17,323
1
$29,000
APPLICATIONS DENIED
23
$75,198
51
$50,474
103
$68,334
28
$16,679
4
$36,465
APPLICATIONS WITHDRAWN
7
$112,947
13
$98,708
35
$69,354
2
$9,330
1
$51,000
FILES CLOSED FOR INCOMPLETENESS
2
$95,745
4
$64,720
8
$98,540
1
$11,400
0
$0
Aggregated Statistics For Year 1999 (Based on 1 full and 3 partial tracts)
A) FHA, FSA/RHS & VA Home Purchase Loans
B) Conventional Home Purchase Loans
C) Refinancings
D) Home Improvement Loans
E) Loans on Dwellings For 5+ Families
F) Non-occupant Loans on < 5 Family Dwellings (A B C & D)
2002 - 2018 National Fire Incident Reporting System (NFIRS) incidents
Based on the data from the years 2002 - 2018 the average number of fire incidents per year is 68. The highest number of fire incidents - 100 took place in 2009, and the least - 42 in 2006. The data has a dropping trend.
When looking into fire subcategories, the most incidents belonged to: Structure Fires (43.2%), and Outside Fires (34.1%).
Fire incident types reported to NFIRS in Zip Code 43125


+$3,686
-$3,706
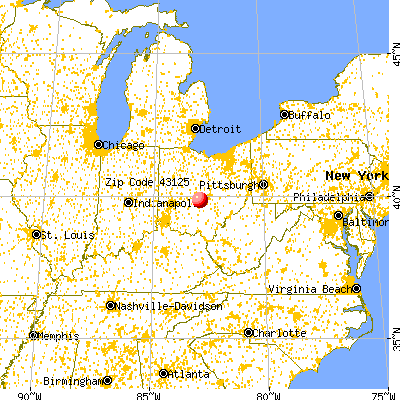
 Nearest zip codes: 43217, 43136, 43232, 43110, 43207, 43109.


 Based on the data from the years 2002 - 2018 the average number of fire incidents per year is 68. The highest number of fire incidents - 100 took place in 2009, and the least - 42 in 2006. The data has a dropping trend.
 When looking into fire subcategories, the most incidents belonged to: Structure Fires (43.2%), and Outside Fires (34.1%).