Estimated zip code population in 2022: 45,985 Zip code population in 2010: 38,440 Zip code population in 2000: 28,137
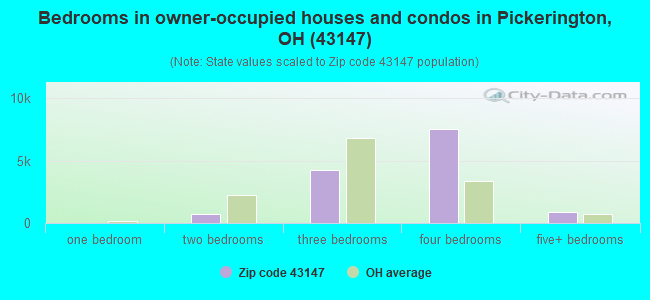
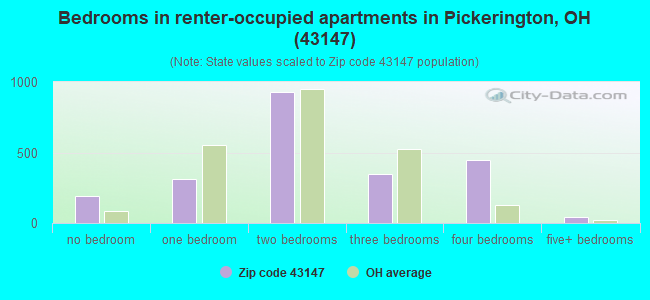
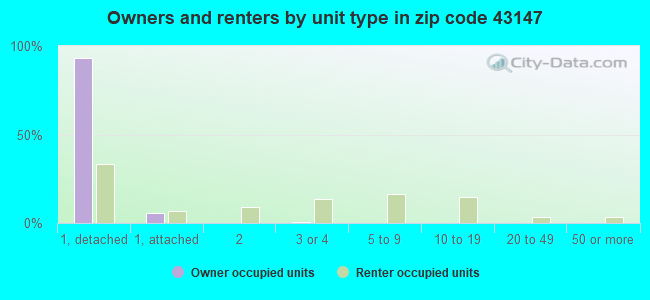
Houses and condos: 16,204 Renter-occupied apartments: 2,286
% of renters here:
15%
State:
33%
March 2022 cost of living index in zip code 43147: 96.3 (near average, U.S. average is 100)
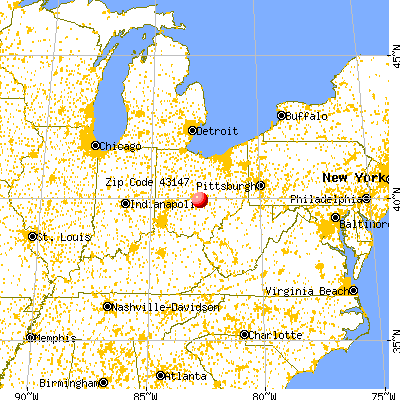
Land area: 29.1 sq. mi. Water area: 0.0 sq. mi.
Population density: 1,578 people per square mile
(low).
OSM Map
General Map
Google Map
MSN Map
OSM Map
General Map
Google Map
MSN Map
OSM Map
General Map
Google Map
MSN Map
OSM Map
General Map
Google Map
MSN Map
Please wait while loading the map...
Real estate property taxes paid for housing units in 2022:
This zip code:
1.4% ($4,426)
Ohio:
1.3% ($2,639)
Median real estate property taxes paid for housing units with mortgages in 2022: $4,403 (1.4%) Median real estate property taxes paid for housing units with no mortgage in 2022: $4,513 (1.5%)
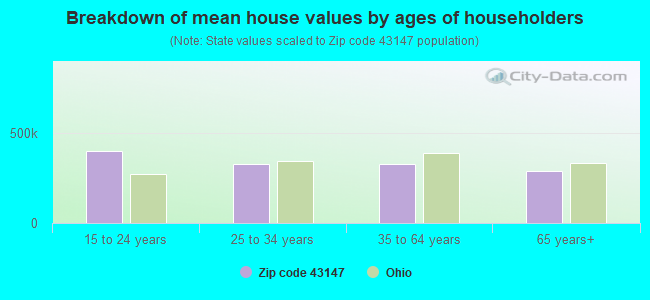
Estimated median house/condo value in 2022: $319,345
43147:
$319,345
Ohio:
$204,100
According to our research of Ohio and other state lists, there were 18 registered sex offenders living in 43147 zip code as of April 27, 2024. The ratio of all residents to sex offenders in zip code 43147 is 2,230 to 1. The ratio of registered sex offenders to all residents in this zip code is much lower than the state average.
Median resident age:
This zip code:
37.5 years
Ohio median age:
39.9 years
Average household size:
This zip code:
2.9 people
Ohio:
2.4 people
Averages for the 2020 tax year for zip code 43147, filed in 2021:
Average Adjusted Gross Income (AGI) in 2020: $82,245 (Individual Income Tax Returns)
Here:
$82,245
State:
$67,288
Salary/wage: $72,842 (reported on 84.7% of returns)
Here:
$72,842
State:
$55,628
(% of AGI for various income ranges: 1121.0% for AGIs below $25k, 3602.2% for AGIs $25k-50k, 6537.9% for AGIs $50k-75k, 9712.1% for AGIs $75k-100k, 19062.7% for AGIs $100k-200k, 67797.7% for AGIs over 200k)
Taxable interest for individuals: $1,101 (reported on 28.9% of returns)
This zip code:
$1,101
Ohio:
$1,518
(% of AGI for various income ranges: 13.4% for AGIs below $25k, 15.4% for AGIs $25k-50k, 26.1% for AGIs $50k-75k, 47.9% for AGIs $75k-100k, 62.6% for AGIs $100k-200k, 601.8% for AGIs over 200k)
Ordinary dividends: $4,219 (reported on 21.2% of returns)
Here:
$4,219
State:
$7,167
(% of AGI for various income ranges: 19.2% for AGIs below $25k, 29.3% for AGIs $25k-50k, 68.9% for AGIs $50k-75k, 99.6% for AGIs $75k-100k, 205.6% for AGIs $100k-200k, 1948.2% for AGIs over 200k)
Net capital gain/loss in AGI: +$9,626 (reported on 18.8% of returns)
Here:
+$9,626
State:
+$18,919
(% of AGI for various income ranges: 8.5% for AGIs below $25k, 31.4% for AGIs $25k-50k, 73.2% for AGIs $50k-75k, 117.2% for AGIs $75k-100k, 347.6% for AGIs $100k-200k, 5628.2% for AGIs over 200k)
Profit/loss from business: +$13,291 (reported on 16.9% of returns)
Here:
+$13,291
State:
+$13,744
(% of AGI for various income ranges: 89.2% for AGIs below $25k, 117.2% for AGIs $25k-50k, 192.7% for AGIs $50k-75k, 259.8% for AGIs $75k-100k, 561.1% for AGIs $100k-200k, 3696.8% for AGIs over 200k)
Taxable individual retirement arrangement distribution: $19,427 (reported on 9.2% of returns)
43147:
$19,427
Ohio:
$18,876
(% of AGI for various income ranges: 55.1% for AGIs below $25k, 123.2% for AGIs $25k-50k, 205.9% for AGIs $50k-75k, 318.7% for AGIs $75k-100k, 550.2% for AGIs $100k-200k, 1341.4% for AGIs over 200k)
Self-employed (Keogh) retirement plans: $22,290 (reported on 0.4% of returns)
43147:
$22,290
Ohio:
$24,898
(% of AGI for various income ranges: 23.9% for AGIs $100k-200k, 340.7% for AGIs over 200k)
Total itemized deductions: $27,832 (reported on 11.0% of returns)
Here:
$27,832
State:
$33,869
(% of AGI for various income ranges: 47.4% for AGIs below $25k, 123.9% for AGIs $25k-50k, 358.6% for AGIs $50k-75k, 601.9% for AGIs $75k-100k, 837.1% for AGIs $100k-200k, 3863.9% for AGIs over 200k)
Charity contributions: $9,468 (reported on 8.8% of returns)
Here:
$9,468
State:
$14,577
(% of AGI for various income ranges: 2.0% for AGIs below $25k, 15.2% for AGIs $25k-50k, 55.1% for AGIs $50k-75k, 105.2% for AGIs $75k-100k, 249.1% for AGIs $100k-200k, 1630.7% for AGIs over 200k)
Taxes paid: $8,275 (reported on 10.9% of returns)
43147:
$8,275
State:
$7,681
(% of AGI for various income ranges: 7.1% for AGIs below $25k, 27.2% for AGIs $25k-50k, 107.7% for AGIs $50k-75k, 202.9% for AGIs $75k-100k, 271.3% for AGIs $100k-200k, 980.7% for AGIs over 200k)
Earned income credit: $2,252 (reported on 9.6% of returns)
Here:
$2,252
State:
$2,304
(% of AGI for various income ranges: 67.6% for AGIs below $25k, 64.3% for AGIs $25k-50k, 1.1% for AGIs $50k-75k)
Percentage of individuals using paid preparers for their 2020 taxes: 93.4%
Here:
93%
State:
94%
(% for various income ranges: 92.4% for AGIs below $25k, 93.5% for AGIs $25k-50k, 94.2% for AGIs $50k-75k, 94.4% for AGIs $75k-100k, 93.2% for AGIs $100k-200k, 93.8% for AGIs over 200k)
Averages for the 2012 tax year for zip code 43147, filed in 2013:
Average Adjusted Gross Income (AGI) in 2012: $70,481 (Individual Income Tax Returns)
Here:
$70,481
State:
$54,926
Salary/wage: $62,270 (reported on 87.4% of returns)
Here:
$62,270
State:
$45,869
(% of AGI for various income ranges: 77.5% for AGIs below $25k, 75.8% for AGIs $25k-50k, 77.5% for AGIs $50k-75k, 81.3% for AGIs $75k-100k, 83.8% for AGIs $100k-200k, 61.5% for AGIs over 200k)
Taxable interest for individuals: $834 (reported on 35.1% of returns)
This zip code:
$834
Ohio:
$1,297
(% of AGI for various income ranges: 1.0% for AGIs below $25k, 0.6% for AGIs $25k-50k, 0.4% for AGIs $50k-75k, 0.3% for AGIs $75k-100k, 0.3% for AGIs $100k-200k, 0.6% for AGIs over 200k)
Ordinary dividends: $3,684 (reported on 23.6% of returns)
Here:
$3,684
State:
$5,821
(% of AGI for various income ranges: 1.7% for AGIs below $25k, 0.9% for AGIs $25k-50k, 0.8% for AGIs $50k-75k, 0.6% for AGIs $75k-100k, 0.9% for AGIs $100k-200k, 2.9% for AGIs over 200k)
Net capital gain/loss in AGI: +$5,364 (reported on 16.9% of returns)
Here:
+$5,364
State:
+$11,232
(% of AGI for various income ranges: 0.2% for AGIs $25k-50k, 0.2% for AGIs $50k-75k, 0.2% for AGIs $75k-100k, 0.6% for AGIs $100k-200k, 5.4% for AGIs over 200k)
Profit/loss from business: +$12,295 (reported on 15.9% of returns)
Here:
+$12,295
State:
+$12,773
(% of AGI for various income ranges: 6.8% for AGIs below $25k, 3.5% for AGIs $25k-50k, 2.4% for AGIs $50k-75k, 2.4% for AGIs $75k-100k, 2.1% for AGIs $100k-200k, 3.3% for AGIs over 200k)
Taxable individual retirement arrangement distribution: $14,887 (reported on 9.6% of returns)
43147:
$14,887
Ohio:
$14,511
(% of AGI for various income ranges: 2.7% for AGIs below $25k, 2.7% for AGIs $25k-50k, 2.4% for AGIs $50k-75k, 2.1% for AGIs $75k-100k, 2.0% for AGIs $100k-200k, 1.4% for AGIs over 200k)
Self-employment retirement plans: $18,492 (reported on 0.6% of returns)
43147:
$18,492
Ohio:
$20,257
(% of AGI for various income ranges: 0.2% for AGIs $50k-75k, 0.1% for AGIs $100k-200k, 0.5% for AGIs over 200k)
Total itemized deductions: $21,887 (20% of AGI, reported on 51.9% of returns)
Here:
$21,887
State:
$21,278
Here:
20.3% of AGI
State:
18.8% of AGI
(% of AGI for various income ranges: 10.9% for AGIs below $25k, 14.1% for AGIs $25k-50k, 16.9% for AGIs $50k-75k, 17.7% for AGIs $75k-100k, 17.7% for AGIs $100k-200k, 13.1% for AGIs over 200k)
Charity contributions: $3,242 (reported on 43.1% of returns)
Here:
$3,242
State:
$3,943
(% of AGI for various income ranges: 0.9% for AGIs below $25k, 1.6% for AGIs $25k-50k, 1.9% for AGIs $50k-75k, 2.0% for AGIs $75k-100k, 2.2% for AGIs $100k-200k, 2.0% for AGIs over 200k)
Taxes paid: $10,571 (reported on 51.7% of returns)
43147:
$10,571
State:
$9,568
(% of AGI for various income ranges: 2.7% for AGIs below $25k, 4.7% for AGIs $25k-50k, 6.9% for AGIs $50k-75k, 8.1% for AGIs $75k-100k, 9.1% for AGIs $100k-200k, 8.3% for AGIs over 200k)
Earned income credit: $2,125 (reported on 9.2% of returns)
Here:
$2,125
State:
$2,285
(% of AGI for various income ranges: 4.5% for AGIs below $25k, 0.9% for AGIs $25k-50k)
Percentage of individuals using paid preparers for their 2012 taxes: 44.9%
Here:
45%
State:
51%
(% for various income ranges: 36.9% for AGIs below $25k, 45.6% for AGIs $25k-50k, 51.7% for AGIs $50k-75k, 49.2% for AGIs $75k-100k, 43.9% for AGIs $100k-200k, 62.5% for AGIs over 200k)
Averages for the 2004 tax year for zip code 43147, filed in 2005:
Average Adjusted Gross Income (AGI) in 2004: $58,770 (Individual Income Tax Returns)
Here:
$58,770
State:
$44,480
Salary/wage: $54,670 (reported on 89.9% of returns)
Here:
$54,670
State:
$39,198
(% of AGI for various income ranges: 152.6% for AGIs below $10k, 74.5% for AGIs $10k-25k, 80.4% for AGIs $25k-50k, 84.6% for AGIs $50k-75k, 88.3% for AGIs $75k-100k, 81.2% for AGIs over 100k)
Taxable interest for individuals: $965 (reported on 53.1% of returns)
This zip code:
$965
Ohio:
$1,532
(% of AGI for various income ranges: 5.4% for AGIs below $10k, 2.4% for AGIs $10k-25k, 1.0% for AGIs $25k-50k, 0.8% for AGIs $50k-75k, 0.8% for AGIs $75k-100k, 0.7% for AGIs over 100k)
Taxable dividends: $1,735 (reported on 29.7% of returns)
Here:
$1,735
State:
$3,496
(% of AGI for various income ranges: 4.9% for AGIs below $10k, 1.5% for AGIs $10k-25k, 1.0% for AGIs $25k-50k, 0.7% for AGIs $50k-75k, 0.6% for AGIs $75k-100k, 0.9% for AGIs over 100k)
Net capital gain/loss: +$4,477 (reported on 23.0% of returns)
Here:
+$4,477
State:
+$8,582
(% of AGI for various income ranges: -1.7% for AGIs below $10k, 0.6% for AGIs $10k-25k, 0.3% for AGIs $25k-50k, 0.3% for AGIs $50k-75k, 0.7% for AGIs $75k-100k, 3.7% for AGIs over 100k)
Profit/loss from business: +$11,507 (reported on 15.7% of returns)
Here:
+$11,507
State:
+$10,813
(% of AGI for various income ranges: 0.6% for AGIs below $10k, 6.0% for AGIs $10k-25k, 3.0% for AGIs $25k-50k, 2.4% for AGIs $50k-75k, 2.1% for AGIs $75k-100k, 3.7% for AGIs over 100k)
IRA payment deduction: $3,102 (reported on 2.2% of returns)
43147:
$3,102
Ohio:
$2,794
(% of AGI for various income ranges: 0.5% for AGIs below $10k, 0.3% for AGIs $10k-25k, 0.2% for AGIs $25k-50k, 0.1% for AGIs $50k-75k, 0.1% for AGIs $75k-100k, 0.1% for AGIs over 100k)
Self-employed pension: $12,293 (reported on 0.9% of returns)
Here:
$12,293
Ohio:
$13,981
(% of AGI for various income ranges: 0.1% for AGIs $25k-50k, 0.1% for AGIs $50k-75k, 0.1% for AGIs $75k-100k, 0.3% for AGIs over 100k)
Total itemized deductions: $19,133 (23% of AGI, reported on 59.6% of returns)
Here:
$19,133
State:
$17,503
Here:
22.6% of AGI
State:
20.8% of AGI
(% of AGI for various income ranges: 12.6% for AGIs below $10k, 13.6% for AGIs $10k-25k, 19.3% for AGIs $25k-50k, 21.5% for AGIs $50k-75k, 21.7% for AGIs $75k-100k, 17.9% for AGIs over 100k)
Charity contributions deductions: $2,647 (3% of AGI, reported on 52.8% of returns)
Here:
$2,647
State:
$3,087
Here:
3.0% of AGI
State:
3.4% of AGI
(% of AGI for various income ranges: 0.7% for AGIs below $10k, 1.2% for AGIs $10k-25k, 2.2% for AGIs $25k-50k, 2.4% for AGIs $50k-75k, 2.4% for AGIs $75k-100k, 2.5% for AGIs over 100k)
Total tax: $7,975 (reported on 83.1% of returns)
43147:
$7,975
State:
$6,781
(% of AGI for various income ranges: 3.5% for AGIs below $10k, 4.9% for AGIs $10k-25k, 7.1% for AGIs $25k-50k, 8.5% for AGIs $50k-75k, 9.2% for AGIs $75k-100k, 15.9% for AGIs over 100k)
Earned income credit: $1,545 (reported on 5.5% of returns)
Here:
$1,545
State:
$1,696
Percentage of individuals using paid preparers for their 2004 taxes: 46.4%
Here:
46%
State:
55%
(% for various income ranges: 30.9% for AGIs below $10k, 44.6% for AGIs $10k-25k, 53.7% for AGIs $25k-50k, 52.0% for AGIs $50k-75k, 45.8% for AGIs $75k-100k, 48.6% for AGIs over 100k)
Likely homosexual households (counted as self-reported same-sex unmarried-partner households)
Lesbian couples: 0.6% of all households
Gay men: 0.0% of all households
Household received Food Stamps/SNAP in the past 12 months: 637 Household did not receive Food Stamps/SNAP in the past 12 months: 14,847
Women who had a birth in the past 12 months: 637 (473 now married, 167 unmarried) Women who did not have a birth in the past 12 months: 10,542 (5,613 now married, 4,923 unmarried)
Housing units in zip code 43147 with a mortgage: 9,689 (1,213 second mortgage, 89 home equity loan, 1,016 both second mortgage and home equity loan) Houses without a mortgage: 257
Median monthly owner costs for units with a mortgage: $1,783 Median monthly owner costs for units without a mortgage: $750
Residents with income below the poverty level in 2022:
This zip code:
5.3%
Whole state:
13.4%
Residents with income below 50% of the poverty level in 2022:
This zip code:
4.0%
Whole state:
7.0%
Median number of rooms in houses and condos:
Here:
8.0
State:
6.7
Median number of rooms in apartments:
Here:
5.0
State:
4.4
Notable locations in this zip code not listed on our city pages
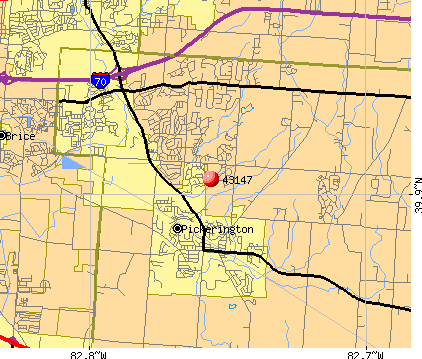
Notable locations in zip code 43147: Turnberry Golf Course (A), Violet Township Fire Department Station 591 (B), Violet Township Fire Department Station 592 (C), Pickerington City Hall (D). Display/hide their locations on the map
Churches in zip code 43147 include: Fairview Church (A), Trinity Church (B), Pickerington Freewill Baptist Church (C). Display/hide their locations on the map
Parks in zip code 43147 include: Stonebridge Park (1), Sycamore Creek Park (2), Hale Park (3), Simsbury Park (4), Victory Park (5). Display/hide their locations on the map
In group quarters: 154 (-1 institutionalized population)
Size of family households: 4,310 2-persons, 2,773 3-persons, 2,810 4-persons, 1,727 5-persons, 476 6-persons, 237 7-or-more-persons
Size of nonfamily households: 2,584 1-person, 396 2-persons, 51 3-persons
9,287 married couples with children.
3,060 single-parent households (824 men, 2,236 women).
91.5% of residents of 43147 zip code speak English at home.
1.9% of residents speak Spanish at home (73% very well, 5% well, 18% not well, 4% not at all).
3.3% of residents speak other Indo-European language at home (61% very well, 26% well, 5% not well, 8% not at all).
0.9% of residents speak Asian or Pacific Island language at home (72% very well, 26% well, 2% not well).
1.8% of residents speak other language at home (61% very well, 30% well, 2% not well, 8% not at all).
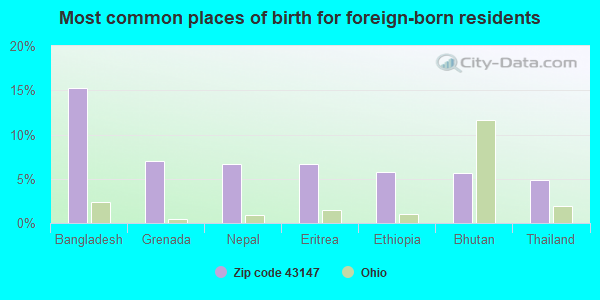
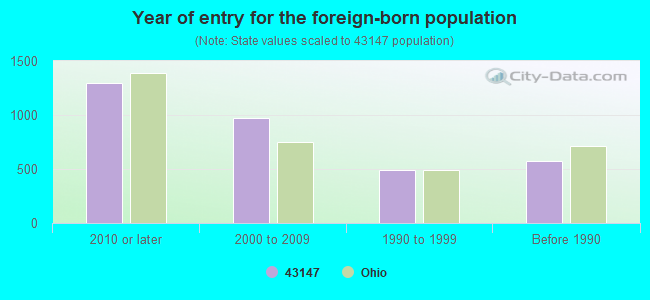
Foreign born population: 2,974 (6.5%) (70.8% of them are naturalized citizens)
This zip code:
6.5%
Whole state:
5.0%
15%Bangladesh
7%Grenada
7%Nepal
7%Eritrea
6%Ethiopia
6%Bhutan
5%Thailand
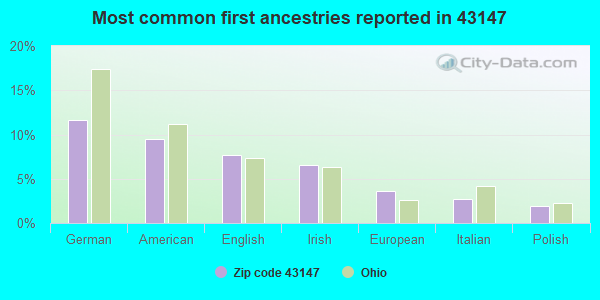
12%German
10%American
8%English
7%Irish
4%European
3%Italian
2%Polish
Year of entry for the foreign-born population
1,3002010 or later
9722000 to 2009
4901990 to 1999
578Before 1990
Facilities with environmental interests located in this zip code:
BP OIL CO (995 REFUGEE RD in PICKERINGTON, OH)
STATE MASTER (Ohio general info) - RCRA-OHD987013554, HAZARDOUS WASTE PROGRAM, AIR MAJOR, EPCRA Conditionally Exempt Small Quantity Generators, less than 100 kg/month of hazardous waste (Resource Conservation and Recovery Act (tracking hazardous waste)) - notification Organizations: BP OIL COMPANY (CONTACT/OWNER)
Alternative names: BP OIL CO #445
CHEMSERV ENVIRONMENTAL CO (11482 WEDGEWOOD DR NW in PICKERINGTON, OH)
(Resource Conservation and Recovery Act (tracking hazardous waste))
ACCU-CHECK INSTRUMENT SERVICE (8583 REFUGEE RD NW in PICKERINGTON, OH)
Conditionally Exempt Small Quantity Generators, less than 100 kg/month of hazardous waste (Resource Conservation and Recovery Act (tracking hazardous waste)) - notification Organizations: ROBERT VAUGHAN (CONTACT/OWNER)
Housing units lacking complete plumbing facilities: 0.1% Housing units lacking complete kitchen facilities: 2.4%
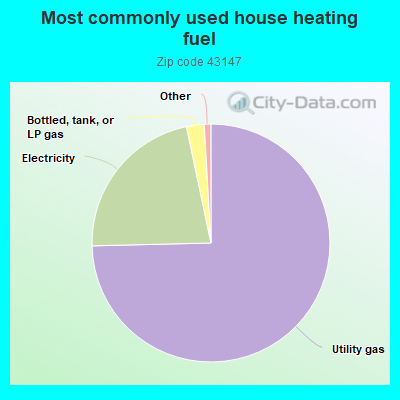
74.7%Utility gas
22.1%Electricity
2.4%Bottled, tank, or LP gas
Population in 1990: 18,424. Population change in the 1990s: +9,713 (+52.7%).
Place of birth for U.S.-born residents:
This state: 31,767
Northeast: 3,291
Midwest: 1,946
South: 4,325
West: 1,342
56% of the 43147 zip code residents lived in the same house 5 years ago. Out of people who lived in different houses, 26% lived in this county. Out of people who lived in different counties, 50% lived in Ohio.
92% of the 43147 zip code residents lived in the same house 1 year ago. Out of people who lived in different houses, 14% moved from this county. Out of people who lived in different houses, 78% moved from different county within same state. Out of people who lived in different houses, 14% moved from different state. Out of people who lived in different houses, 3% moved from abroad.
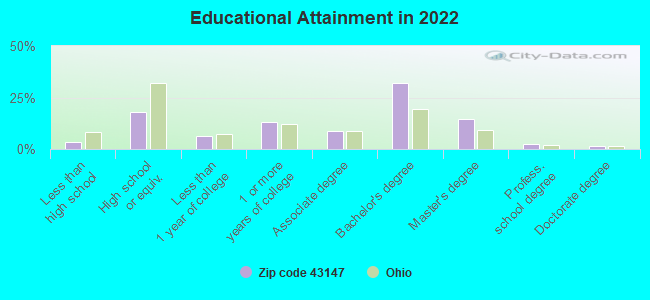
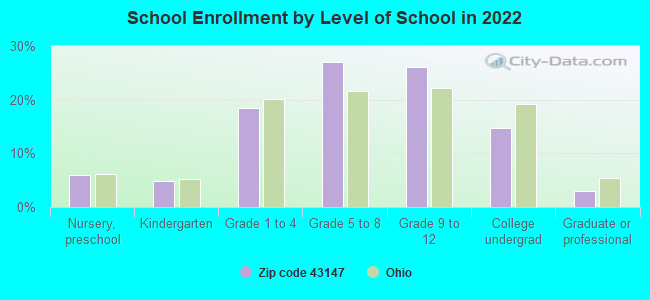
Private vs. public school enrollment:
Students in private schools in grades 1 to 8 (elementary and middle school): 558
Here:
9.0%
Ohio:
16.0%
Students in private schools in grades 9 to 12 (high school): 328
Here:
9.3%
Ohio:
13.1%
Students in private undergraduate colleges: 335
Here:
16.7%
Ohio:
22.3%
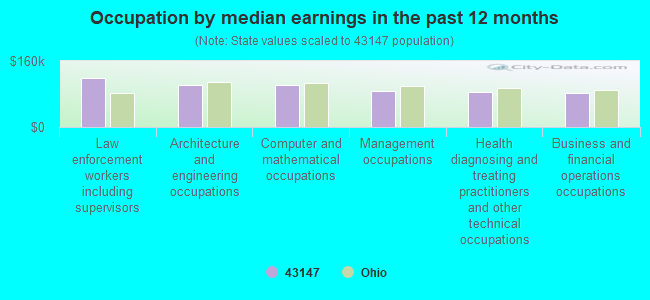
Occupation by median earnings in the past 12 months ($)
118,304Law enforcement workers including supervisors
101,561Architecture and engineering occupations
101,502Computer and mathematical occupations
87,868Management occupations
85,748Health diagnosing and treating practitioners and other technical occupations
82,579Business and financial operations occupations
Companies with federal contracts located in this zip code (PICKERINGTON, OH):
H L T INC (12948C STONECREEK DR NW; small business) : $119,207 in 3 contractsfrom 1999 to 2002
$50,700 with Defense Logistics Agency for Liquid and Gas Flow, Liquid Level, and Mechanical Motion Measuring Instruments. Signed on 1999-12-10. Completion date: 2000-02-18.
$36,510 with Defense Logistics Agency for Power and Hand Pumps. Signed on 2001-06-11. Completion date: 2002-01-07.
$31,997, same as above.Signed on 2002-03-14. Completion date: 2002-06-12.
SCHUBERT-KRAVITZ ASSOCIATES (7729 EAGLE CREEK DRIVE; small business) : $10,838 in 2 contractsfrom 2001 to 2002
$7,738 with U.S. Army Corps of Engineers - civil program financing only for Organization/Administrative/PersonneI Studies. Taking place in WV. Signed on 2001-11-14. Completion date: 2001-11-30.
$3,100 with Army for Other Education and Training Services. Taking place in WV. Signed on 2002-12-26. Completion date: 2003-01-16.
QUAYLE CONSULTING INC (8572 N SPRING CT; small business)
$10,440 with Army for ADP System Acquisition Support Services. Includes preparation of statement of work, benchmarks, specifications, etc.. Taking place in NJ. Signed on 2004-08-25. Completion date: 2004-09-24.
WINSTEADS GALLERY (6 LOCKVILLE RD; small business)
$6,182 with Army for Arts/Graphics Services. Signed on 2004-04-14. Completion date: 2004-05-13.
Top industries in this zip code by the number of employees in 2005:
Other Services (except Public Administration): Other Similar Organizations (except Business, Professional, Labor, and Political Organizations) (100-249: 1)
Other Services (except Public Administration): Religious Organizations (20-49: 2, 10-19: 3, 5-9: 3, 1-4: 12)
Health Care and Social Assistance: Offices of Dentists (10-19: 4, 5-9: 7, 1-4: 5)
Other Services (except Public Administration): Beauty Salons (10-19: 5, 5-9: 4, 1-4: 3)
People in group quarters in 2010:
172 people in nursing facilities/skilled-nursing facilities
People in group quarters in 2000:
180 people in nursing homes
2 people in religious group quarters
Fatal accident statistics in 2014:
Fatal accident count: 2
Vehicles involved in fatal accidents: 4
Fatal accidents caused by drunken drivers: 1
Fatalities: 2
Persons involved in fatal accidents: 6
Pedestrians involved in fatal accidents: 0
Fatal accident statistics in 2012:
Fatal accident count: 1
Vehicles involved in fatal accidents: 2
Fatal accidents caused by drunken drivers: 0
Fatalities: 2
Persons involved in fatal accidents: 4
Pedestrians involved in fatal accidents: 0
Home Mortgage Disclosure Act Aggregated Statistics For Year 2009 (Based on 3 full and 6 partial tracts)
A) FHA, FSA/RHS & VA Home Purchase Loans
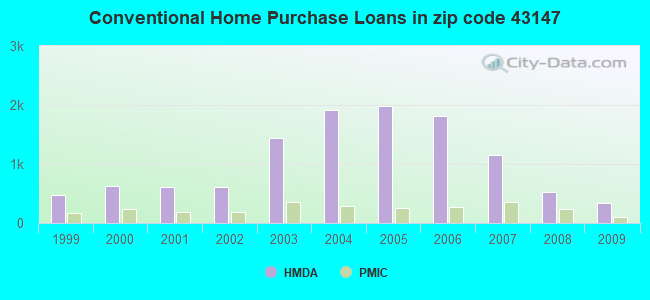
B) Conventional Home Purchase Loans
C) Refinancings
D) Home Improvement Loans
F) Non-occupant Loans on < 5 Family Dwellings (A B C & D)
G) Loans On Manufactured Home Dwelling (A B C & D)
Number
Average Value
Number
Average Value
Number
Average Value
Number
Average Value
Number
Average Value
Number
Average Value
LOANS ORIGINATED
623
$170,781
342
$182,223
1,958
$173,028
50
$26,033
55
$174,013
0
$0
APPLICATIONS APPROVED, NOT ACCEPTED
21
$181,974
26
$183,445
157
$175,078
11
$24,021
4
$112,348
0
$0
APPLICATIONS DENIED
81
$159,000
48
$129,205
562
$187,325
74
$36,548
25
$111,430
2
$114,885
APPLICATIONS WITHDRAWN
58
$173,142
45
$219,836
330
$193,386
18
$60,996
11
$349,121
0
$0
FILES CLOSED FOR INCOMPLETENESS
7
$192,309
6
$154,587
89
$187,512
0
$0
2
$184,890
0
$0
Aggregated Statistics For Year 2008 (Based on 3 full and 6 partial tracts)
A) FHA, FSA/RHS & VA Home Purchase Loans
B) Conventional Home Purchase Loans
C) Refinancings
D) Home Improvement Loans
E) Loans on Dwellings For 5+ Families
F) Non-occupant Loans on < 5 Family Dwellings (A B C & D)
G) Loans On Manufactured Home Dwelling (A B C & D)
Number
Average Value
Number
Average Value
Number
Average Value
Number
Average Value
Number
Average Value
Number
Average Value
Number
Average Value
LOANS ORIGINATED
446
$171,476
529
$180,678
764
$176,362
133
$25,157
2
$197,800
97
$140,639
0
$0
APPLICATIONS APPROVED, NOT ACCEPTED
41
$191,804
73
$196,465
152
$186,833
33
$24,377
0
$0
7
$278,474
0
$0
APPLICATIONS DENIED
54
$171,711
72
$181,688
658
$189,115
158
$33,869
0
$0
28
$220,425
8
$87,068
APPLICATIONS WITHDRAWN
29
$177,153
88
$164,267
256
$196,009
14
$72,798
0
$0
14
$101,695
2
$162,835
FILES CLOSED FOR INCOMPLETENESS
9
$160,806
17
$174,730
71
$174,448
11
$63,996
0
$0
5
$132,722
0
$0
Aggregated Statistics For Year 2007 (Based on 3 full and 6 partial tracts)
A) FHA, FSA/RHS & VA Home Purchase Loans
B) Conventional Home Purchase Loans
C) Refinancings
D) Home Improvement Loans
E) Loans on Dwellings For 5+ Families
F) Non-occupant Loans on < 5 Family Dwellings (A B C & D)
G) Loans On Manufactured Home Dwelling (A B C & D)
Number
Average Value
Number
Average Value
Number
Average Value
Number
Average Value
Number
Average Value
Number
Average Value
Number
Average Value
LOANS ORIGINATED
241
$182,459
1,147
$168,782
904
$149,942
166
$52,836
6
$2,792,872
97
$174,133
0
$0
APPLICATIONS APPROVED, NOT ACCEPTED
23
$199,869
139
$182,685
307
$163,132
39
$26,653
0
$0
12
$128,205
0
$0
APPLICATIONS DENIED
23
$167,357
236
$175,238
1,056
$174,204
148
$43,140
0
$0
46
$171,394
5
$30,468
APPLICATIONS WITHDRAWN
27
$192,908
114
$203,304
356
$170,151
36
$65,684
0
$0
14
$117,095
0
$0
FILES CLOSED FOR INCOMPLETENESS
2
$179,820
18
$151,176
143
$176,146
6
$132,922
0
$0
0
$0
0
$0
Aggregated Statistics For Year 2006 (Based on 3 full and 6 partial tracts)
A) FHA, FSA/RHS & VA Home Purchase Loans
B) Conventional Home Purchase Loans
C) Refinancings
D) Home Improvement Loans
E) Loans on Dwellings For 5+ Families
F) Non-occupant Loans on < 5 Family Dwellings (A B C & D)
G) Loans On Manufactured Home Dwelling (A B C & D)
Number
Average Value
Number
Average Value
Number
Average Value
Number
Average Value
Number
Average Value
Number
Average Value
Number
Average Value
LOANS ORIGINATED
201
$176,413
1,813
$150,843
1,218
$148,382
200
$48,429
3
$3,719,763
155
$147,259
6
$57,137
APPLICATIONS APPROVED, NOT ACCEPTED
17
$214,733
265
$151,876
298
$152,389
36
$85,746
0
$0
35
$138,898
2
$97,715
APPLICATIONS DENIED
39
$190,845
323
$150,728
995
$164,974
184
$52,849
2
$488,615
63
$122,237
5
$26,970
APPLICATIONS WITHDRAWN
30
$190,116
217
$152,085
475
$166,927
16
$76,454
0
$0
18
$100,885
3
$96,050
FILES CLOSED FOR INCOMPLETENESS
2
$227,770
41
$150,357
159
$198,632
2
$124,755
0
$0
1
$102,000
0
$0
Aggregated Statistics For Year 2005 (Based on 3 full and 6 partial tracts)
A) FHA, FSA/RHS & VA Home Purchase Loans
B) Conventional Home Purchase Loans
C) Refinancings
D) Home Improvement Loans
F) Non-occupant Loans on < 5 Family Dwellings (A B C & D)
G) Loans On Manufactured Home Dwelling (A B C & D)
Number
Average Value
Number
Average Value
Number
Average Value
Number
Average Value
Number
Average Value
Number
Average Value
LOANS ORIGINATED
227
$180,430
1,978
$154,210
1,572
$156,659
211
$52,265
177
$120,714
7
$39,593
APPLICATIONS APPROVED, NOT ACCEPTED
20
$188,572
318
$146,506
282
$151,496
40
$42,546
15
$127,751
1
$71,740
APPLICATIONS DENIED
35
$174,471
380
$145,796
1,015
$167,819
171
$43,501
41
$106,066
8
$21,265
APPLICATIONS WITHDRAWN
24
$181,264
234
$179,094
613
$181,381
73
$130,083
18
$170,845
0
$0
FILES CLOSED FOR INCOMPLETENESS
2
$99,235
56
$134,347
144
$176,907
12
$42,325
0
$0
0
$0
Aggregated Statistics For Year 2004 (Based on 3 full and 6 partial tracts)
A) FHA, FSA/RHS & VA Home Purchase Loans
B) Conventional Home Purchase Loans
C) Refinancings
D) Home Improvement Loans
E) Loans on Dwellings For 5+ Families
F) Non-occupant Loans on < 5 Family Dwellings (A B C & D)
G) Loans On Manufactured Home Dwelling (A B C & D)
Number
Average Value
Number
Average Value
Number
Average Value
Number
Average Value
Number
Average Value
Number
Average Value
Number
Average Value
LOANS ORIGINATED
306
$181,012
1,917
$159,720
2,005
$154,530
156
$59,938
0
$0
122
$132,444
0
$0
APPLICATIONS APPROVED, NOT ACCEPTED
46
$176,723
244
$180,589
303
$163,078
64
$33,296
2
$16,683,300
9
$157,858
1
$81,560
APPLICATIONS DENIED
53
$181,187
270
$164,604
942
$159,329
149
$35,026
0
$0
38
$120,128
4
$22,815
APPLICATIONS WITHDRAWN
38
$185,422
238
$178,864
536
$162,652
44
$44,548
0
$0
21
$179,751
2
$124,965
FILES CLOSED FOR INCOMPLETENESS
5
$172,588
78
$180,689
181
$181,764
16
$68,502
0
$0
9
$126,812
0
$0
Aggregated Statistics For Year 2003 (Based on 3 full and 6 partial tracts)
A) FHA, FSA/RHS & VA Home Purchase Loans
B) Conventional Home Purchase Loans
C) Refinancings
D) Home Improvement Loans
F) Non-occupant Loans on < 5 Family Dwellings (A B C & D)
Number
Average Value
Number
Average Value
Number
Average Value
Number
Average Value
Number
Average Value
LOANS ORIGINATED
544
$178,822
1,444
$173,080
5,096
$144,408
126
$28,862
160
$139,325
APPLICATIONS APPROVED, NOT ACCEPTED
32
$188,615
131
$164,741
654
$141,687
38
$38,676
12
$94,272
APPLICATIONS DENIED
47
$178,505
155
$173,089
1,017
$143,575
100
$23,312
36
$150,834
APPLICATIONS WITHDRAWN
47
$167,760
140
$197,629
592
$154,631
36
$49,568
17
$157,119
FILES CLOSED FOR INCOMPLETENESS
6
$182,793
31
$167,259
224
$165,935
8
$72,692
3
$98,270
Aggregated Statistics For Year 2002 (Based on 2 full tracts)
A) FHA, FSA/RHS & VA Home Purchase Loans
B) Conventional Home Purchase Loans
C) Refinancings
D) Home Improvement Loans
F) Non-occupant Loans on < 5 Family Dwellings (A B C & D)
Number
Average Value
Number
Average Value
Number
Average Value
Number
Average Value
Number
Average Value
LOANS ORIGINATED
348
$173,344
603
$158,803
1,708
$139,426
42
$27,116
40
$93,107
APPLICATIONS APPROVED, NOT ACCEPTED
12
$181,652
64
$223,932
194
$135,061
22
$17,619
4
$69,930
APPLICATIONS DENIED
28
$190,524
54
$158,471
354
$130,576
34
$13,869
2
$24,975
APPLICATIONS WITHDRAWN
44
$184,179
36
$162,116
218
$142,829
4
$86,412
2
$89,910
FILES CLOSED FOR INCOMPLETENESS
0
$0
6
$192,473
84
$150,778
2
$19,980
0
$0
Aggregated Statistics For Year 2001 (Based on 2 full tracts)
A) FHA, FSA/RHS & VA Home Purchase Loans
B) Conventional Home Purchase Loans
C) Refinancings
D) Home Improvement Loans
F) Non-occupant Loans on < 5 Family Dwellings (A B C & D)
Number
Average Value
Number
Average Value
Number
Average Value
Number
Average Value
Number
Average Value
LOANS ORIGINATED
262
$163,531
603
$141,898
1,401
$131,761
108
$23,255
36
$94,628
APPLICATIONS APPROVED, NOT ACCEPTED
14
$166,119
60
$130,403
220
$107,592
40
$24,875
4
$53,945
APPLICATIONS DENIED
12
$174,492
74
$129,168
396
$107,700
56
$15,449
10
$85,514
APPLICATIONS WITHDRAWN
26
$159,840
60
$164,735
198
$130,728
14
$33,824
4
$113,388
FILES CLOSED FOR INCOMPLETENESS
2
$103,895
12
$130,369
66
$133,987
2
$25,975
2
$91,910
Aggregated Statistics For Year 2000 (Based on 2 full tracts)
A) FHA, FSA/RHS & VA Home Purchase Loans
B) Conventional Home Purchase Loans
C) Refinancings
D) Home Improvement Loans
F) Non-occupant Loans on < 5 Family Dwellings (A B C & D)
Number
Average Value
Number
Average Value
Number
Average Value
Number
Average Value
Number
Average Value
LOANS ORIGINATED
296
$146,002
625
$143,661
342
$103,966
114
$20,874
24
$116,050
APPLICATIONS APPROVED, NOT ACCEPTED
12
$138,861
74
$140,859
60
$98,435
38
$11,988
4
$33,468
APPLICATIONS DENIED
30
$145,321
62
$142,406
240
$101,482
64
$17,264
6
$56,277
APPLICATIONS WITHDRAWN
24
$164,419
48
$153,555
88
$95,677
2
$60,940
4
$328,172
FILES CLOSED FOR INCOMPLETENESS
2
$118,880
12
$138,362
28
$91,266
4
$33,468
0
$0
Aggregated Statistics For Year 1999 (Based on 2 partial tracts)
A) FHA, FSA/RHS & VA Home Purchase Loans
B) Conventional Home Purchase Loans
C) Refinancings
D) Home Improvement Loans
E) Loans on Dwellings For 5+ Families
F) Non-occupant Loans on < 5 Family Dwellings (A B C & D)
2002 - 2018 National Fire Incident Reporting System (NFIRS) incidents
According to the data from the years 2002 - 2018 the average number of fires per year is 71. The highest number of fires - 102 took place in 2009, and the least - 52 in 2006. The data has a declining trend.
When looking into fire subcategories, the most reports belonged to: Structure Fires (43.6%), and Outside Fires (31.2%).
Fire incident types reported to NFIRS in Zip Code 43147


 Nearest zip codes: 43068, 43109, 43110, 43112, 43136, 43062.


 According to the data from the years 2002 - 2018 the average number of fires per year is 71. The highest number of fires - 102 took place in 2009, and the least - 52 in 2006. The data has a declining trend.
 When looking into fire subcategories, the most reports belonged to: Structure Fires (43.6%), and Outside Fires (31.2%).