Pickerington, Ohio Submit your own pictures of this city and show them to the world
OSM Map
General Map
Google Map
MSN Map
OSM Map
General Map
Google Map
MSN Map
OSM Map
General Map
Google Map
MSN Map
OSM Map
General Map
Google Map
MSN Map
Please wait while loading the map...
Population in 2022: 24,524 (100% urban, 0% rural). Population change since 2000: +150.4%Males: 12,149 Females: 12,375
March 2022 cost of living index in Pickerington: 96.2 (near average, U.S. average is 100) Percentage of residents living in poverty in 2022: 3.9%for White Non-Hispanic residents , 3.3% for Black residents , 2.5% for Hispanic or Latino residents , 4.1% for other race residents , 4.5% for two or more races residents )
Profiles of local businesses
Business Search - 14 Million verified businesses
Data:
Median household income ($)
Median household income (% change since 2000)
Household income diversity
Ratio of average income to average house value (%)
Ratio of average income to average rent
Median household income ($) - White
Median household income ($) - Black or African American
Median household income ($) - Asian
Median household income ($) - Hispanic or Latino
Median household income ($) - American Indian and Alaska Native
Median household income ($) - Multirace
Median household income ($) - Other Race
Median household income for houses/condos with a mortgage ($)
Median household income for apartments without a mortgage ($)
Races - White alone (%)
Races - White alone (% change since 2000)
Races - Black alone (%)
Races - Black alone (% change since 2000)
Races - American Indian alone (%)
Races - American Indian alone (% change since 2000)
Races - Asian alone (%)
Races - Asian alone (% change since 2000)
Races - Hispanic (%)
Races - Hispanic (% change since 2000)
Races - Native Hawaiian and Other Pacific Islander alone (%)
Races - Native Hawaiian and Other Pacific Islander alone (% change since 2000)
Races - Two or more races (%)
Races - Two or more races (% change since 2000)
Races - Other race alone (%)
Races - Other race alone (% change since 2000)
Racial diversity
Unemployment (%)
Unemployment (% change since 2000)
Unemployment (%) - White
Unemployment (%) - Black or African American
Unemployment (%) - Asian
Unemployment (%) - Hispanic or Latino
Unemployment (%) - American Indian and Alaska Native
Unemployment (%) - Multirace
Unemployment (%) - Other Race
Population density (people per square mile)
Population - Males (%)
Population - Females (%)
Population - Males (%) - White
Population - Males (%) - Black or African American
Population - Males (%) - Asian
Population - Males (%) - Hispanic or Latino
Population - Males (%) - American Indian and Alaska Native
Population - Males (%) - Multirace
Population - Males (%) - Other Race
Population - Females (%) - White
Population - Females (%) - Black or African American
Population - Females (%) - Asian
Population - Females (%) - Hispanic or Latino
Population - Females (%) - American Indian and Alaska Native
Population - Females (%) - Multirace
Population - Females (%) - Other Race
Coronavirus confirmed cases (May 10, 2024)
Deaths caused by coronavirus (May 10, 2024)
Coronavirus confirmed cases (per 100k population) (May 10, 2024)
Deaths caused by coronavirus (per 100k population) (May 10, 2024)
Daily increase in number of cases (May 10, 2024)
Weekly increase in number of cases (May 10, 2024)
Cases doubled (in days) (May 10, 2024)
Hospitalized patients (Apr 18, 2022)
Negative test results (Apr 18, 2022)
Total test results (Apr 18, 2022)
COVID Vaccine doses distributed (per 100k population) (Sep 19, 2023)
COVID Vaccine doses administered (per 100k population) (Sep 19, 2023)
COVID Vaccine doses distributed (Sep 19, 2023)
COVID Vaccine doses administered (Sep 19, 2023)
Likely homosexual households (%)
Likely homosexual households (% change since 2000)
Likely homosexual households - Lesbian couples (%)
Likely homosexual households - Lesbian couples (% change since 2000)
Likely homosexual households - Gay men (%)
Likely homosexual households - Gay men (% change since 2000)
Cost of living index
Median gross rent ($)
Median contract rent ($)
Median monthly housing costs ($)
Median house or condo value ($)
Median house or condo value ($ change since 2000)
Mean house or condo value by units in structure - 1, detached ($)
Mean house or condo value by units in structure - 1, attached ($)
Mean house or condo value by units in structure - 2 ($)
Mean house or condo value by units in structure by units in structure - 3 or 4 ($)
Mean house or condo value by units in structure - 5 or more ($)
Mean house or condo value by units in structure - Boat, RV, van, etc. ($)
Mean house or condo value by units in structure - Mobile home ($)
Median house or condo value ($) - White
Median house or condo value ($) - Black or African American
Median house or condo value ($) - Asian
Median house or condo value ($) - Hispanic or Latino
Median house or condo value ($) - American Indian and Alaska Native
Median house or condo value ($) - Multirace
Median house or condo value ($) - Other Race
Median resident age
Resident age diversity
Median resident age - Males
Median resident age - Females
Median resident age - White
Median resident age - Black or African American
Median resident age - Asian
Median resident age - Hispanic or Latino
Median resident age - American Indian and Alaska Native
Median resident age - Multirace
Median resident age - Other Race
Median resident age - Males - White
Median resident age - Males - Black or African American
Median resident age - Males - Asian
Median resident age - Males - Hispanic or Latino
Median resident age - Males - American Indian and Alaska Native
Median resident age - Males - Multirace
Median resident age - Males - Other Race
Median resident age - Females - White
Median resident age - Females - Black or African American
Median resident age - Females - Asian
Median resident age - Females - Hispanic or Latino
Median resident age - Females - American Indian and Alaska Native
Median resident age - Females - Multirace
Median resident age - Females - Other Race
Commute - mean travel time to work (minutes)
Travel time to work - Less than 5 minutes (%)
Travel time to work - Less than 5 minutes (% change since 2000)
Travel time to work - 5 to 9 minutes (%)
Travel time to work - 5 to 9 minutes (% change since 2000)
Travel time to work - 10 to 19 minutes (%)
Travel time to work - 10 to 19 minutes (% change since 2000)
Travel time to work - 20 to 29 minutes (%)
Travel time to work - 20 to 29 minutes (% change since 2000)
Travel time to work - 30 to 39 minutes (%)
Travel time to work - 30 to 39 minutes (% change since 2000)
Travel time to work - 40 to 59 minutes (%)
Travel time to work - 40 to 59 minutes (% change since 2000)
Travel time to work - 60 to 89 minutes (%)
Travel time to work - 60 to 89 minutes (% change since 2000)
Travel time to work - 90 or more minutes (%)
Travel time to work - 90 or more minutes (% change since 2000)
Marital status - Never married (%)
Marital status - Now married (%)
Marital status - Separated (%)
Marital status - Widowed (%)
Marital status - Divorced (%)
Median family income ($)
Median family income (% change since 2000)
Median non-family income ($)
Median non-family income (% change since 2000)
Median per capita income ($)
Median per capita income (% change since 2000)
Median family income ($) - White
Median family income ($) - Black or African American
Median family income ($) - Asian
Median family income ($) - Hispanic or Latino
Median family income ($) - American Indian and Alaska Native
Median family income ($) - Multirace
Median family income ($) - Other Race
Median year house/condo built
Median year apartment built
Year house built - Built 2005 or later (%)
Year house built - Built 2000 to 2004 (%)
Year house built - Built 1990 to 1999 (%)
Year house built - Built 1980 to 1989 (%)
Year house built - Built 1970 to 1979 (%)
Year house built - Built 1960 to 1969 (%)
Year house built - Built 1950 to 1959 (%)
Year house built - Built 1940 to 1949 (%)
Year house built - Built 1939 or earlier (%)
Average household size
Household density (households per square mile)
Average household size - White
Average household size - Black or African American
Average household size - Asian
Average household size - Hispanic or Latino
Average household size - American Indian and Alaska Native
Average household size - Multirace
Average household size - Other Race
Occupied housing units (%)
Vacant housing units (%)
Owner occupied housing units (%)
Renter occupied housing units (%)
Vacancy status - For rent (%)
Vacancy status - For sale only (%)
Vacancy status - Rented or sold, not occupied (%)
Vacancy status - For seasonal, recreational, or occasional use (%)
Vacancy status - For migrant workers (%)
Vacancy status - Other vacant (%)
Residents with income below the poverty level (%)
Residents with income below 50% of the poverty level (%)
Children below poverty level (%)
Poor families by family type - Married-couple family (%)
Poor families by family type - Male, no wife present (%)
Poor families by family type - Female, no husband present (%)
Poverty status for native-born residents (%)
Poverty status for foreign-born residents (%)
Poverty among high school graduates not in families (%)
Poverty among people who did not graduate high school not in families (%)
Residents with income below the poverty level (%) - White
Residents with income below the poverty level (%) - Black or African American
Residents with income below the poverty level (%) - Asian
Residents with income below the poverty level (%) - Hispanic or Latino
Residents with income below the poverty level (%) - American Indian and Alaska Native
Residents with income below the poverty level (%) - Multirace
Residents with income below the poverty level (%) - Other Race
Air pollution - Air Quality Index (AQI)
Air pollution - CO
Air pollution - NO2
Air pollution - SO2
Air pollution - Ozone
Air pollution - PM10
Air pollution - PM25
Air pollution - Pb
Crime - Murders per 100,000 population
Crime - Rapes per 100,000 population
Crime - Robberies per 100,000 population
Crime - Assaults per 100,000 population
Crime - Burglaries per 100,000 population
Crime - Thefts per 100,000 population
Crime - Auto thefts per 100,000 population
Crime - Arson per 100,000 population
Crime - City-data.com crime index
Crime - Violent crime index
Crime - Property crime index
Crime - Murders per 100,000 population (5 year average)
Crime - Rapes per 100,000 population (5 year average)
Crime - Robberies per 100,000 population (5 year average)
Crime - Assaults per 100,000 population (5 year average)
Crime - Burglaries per 100,000 population (5 year average)
Crime - Thefts per 100,000 population (5 year average)
Crime - Auto thefts per 100,000 population (5 year average)
Crime - Arson per 100,000 population (5 year average)
Crime - City-data.com crime index (5 year average)
Crime - Violent crime index (5 year average)
Crime - Property crime index (5 year average)
1996 Presidential Elections Results (%) - Democratic Party (Clinton)
1996 Presidential Elections Results (%) - Republican Party (Dole)
1996 Presidential Elections Results (%) - Other
2000 Presidential Elections Results (%) - Democratic Party (Gore)
2000 Presidential Elections Results (%) - Republican Party (Bush)
2000 Presidential Elections Results (%) - Other
2004 Presidential Elections Results (%) - Democratic Party (Kerry)
2004 Presidential Elections Results (%) - Republican Party (Bush)
2004 Presidential Elections Results (%) - Other
2008 Presidential Elections Results (%) - Democratic Party (Obama)
2008 Presidential Elections Results (%) - Republican Party (McCain)
2008 Presidential Elections Results (%) - Other
2012 Presidential Elections Results (%) - Democratic Party (Obama)
2012 Presidential Elections Results (%) - Republican Party (Romney)
2012 Presidential Elections Results (%) - Other
2016 Presidential Elections Results (%) - Democratic Party (Clinton)
2016 Presidential Elections Results (%) - Republican Party (Trump)
2016 Presidential Elections Results (%) - Other
2020 Presidential Elections Results (%) - Democratic Party (Biden)
2020 Presidential Elections Results (%) - Republican Party (Trump)
2020 Presidential Elections Results (%) - Other
Ancestries Reported - Arab (%)
Ancestries Reported - Czech (%)
Ancestries Reported - Danish (%)
Ancestries Reported - Dutch (%)
Ancestries Reported - English (%)
Ancestries Reported - French (%)
Ancestries Reported - French Canadian (%)
Ancestries Reported - German (%)
Ancestries Reported - Greek (%)
Ancestries Reported - Hungarian (%)
Ancestries Reported - Irish (%)
Ancestries Reported - Italian (%)
Ancestries Reported - Lithuanian (%)
Ancestries Reported - Norwegian (%)
Ancestries Reported - Polish (%)
Ancestries Reported - Portuguese (%)
Ancestries Reported - Russian (%)
Ancestries Reported - Scotch-Irish (%)
Ancestries Reported - Scottish (%)
Ancestries Reported - Slovak (%)
Ancestries Reported - Subsaharan African (%)
Ancestries Reported - Swedish (%)
Ancestries Reported - Swiss (%)
Ancestries Reported - Ukrainian (%)
Ancestries Reported - United States (%)
Ancestries Reported - Welsh (%)
Ancestries Reported - West Indian (%)
Ancestries Reported - Other (%)
Educational Attainment - No schooling completed (%)
Educational Attainment - Less than high school (%)
Educational Attainment - High school or equivalent (%)
Educational Attainment - Less than 1 year of college (%)
Educational Attainment - 1 or more years of college (%)
Educational Attainment - Associate degree (%)
Educational Attainment - Bachelor's degree (%)
Educational Attainment - Master's degree (%)
Educational Attainment - Professional school degree (%)
Educational Attainment - Doctorate degree (%)
School Enrollment - Nursery, preschool (%)
School Enrollment - Kindergarten (%)
School Enrollment - Grade 1 to 4 (%)
School Enrollment - Grade 5 to 8 (%)
School Enrollment - Grade 9 to 12 (%)
School Enrollment - College undergrad (%)
School Enrollment - Graduate or professional (%)
School Enrollment - Not enrolled in school (%)
School enrollment - Public schools (%)
School enrollment - Private schools (%)
School enrollment - Not enrolled (%)
Median number of rooms in houses and condos
Median number of rooms in apartments
Housing units lacking complete plumbing facilities (%)
Housing units lacking complete kitchen facilities (%)
Density of houses
Urban houses (%)
Rural houses (%)
Households with people 60 years and over (%)
Households with people 65 years and over (%)
Households with people 75 years and over (%)
Households with one or more nonrelatives (%)
Households with no nonrelatives (%)
Population in households (%)
Family households (%)
Nonfamily households (%)
Population in families (%)
Family households with own children (%)
Median number of bedrooms in owner occupied houses
Mean number of bedrooms in owner occupied houses
Median number of bedrooms in renter occupied houses
Mean number of bedrooms in renter occupied houses
Median number of vehichles in owner occupied houses
Mean number of vehichles in owner occupied houses
Median number of vehichles in renter occupied houses
Mean number of vehichles in renter occupied houses
Mortgage status - with mortgage (%)
Mortgage status - with second mortgage (%)
Mortgage status - with home equity loan (%)
Mortgage status - with both second mortgage and home equity loan (%)
Mortgage status - without a mortgage (%)
Average family size
Average family size - White
Average family size - Black or African American
Average family size - Asian
Average family size - Hispanic or Latino
Average family size - American Indian and Alaska Native
Average family size - Multirace
Average family size - Other Race
Geographical mobility - Same house 1 year ago (%)
Geographical mobility - Moved within same county (%)
Geographical mobility - Moved from different county within same state (%)
Geographical mobility - Moved from different state (%)
Geographical mobility - Moved from abroad (%)
Place of birth - Born in state of residence (%)
Place of birth - Born in other state (%)
Place of birth - Native, outside of US (%)
Place of birth - Foreign born (%)
Housing units in structures - 1, detached (%)
Housing units in structures - 1, attached (%)
Housing units in structures - 2 (%)
Housing units in structures - 3 or 4 (%)
Housing units in structures - 5 to 9 (%)
Housing units in structures - 10 to 19 (%)
Housing units in structures - 20 to 49 (%)
Housing units in structures - 50 or more (%)
Housing units in structures - Mobile home (%)
Housing units in structures - Boat, RV, van, etc. (%)
House/condo owner moved in on average (years ago)
Renter moved in on average (years ago)
Year householder moved into unit - Moved in 1999 to March 2000 (%)
Year householder moved into unit - Moved in 1995 to 1998 (%)
Year householder moved into unit - Moved in 1990 to 1994 (%)
Year householder moved into unit - Moved in 1980 to 1989 (%)
Year householder moved into unit - Moved in 1970 to 1979 (%)
Year householder moved into unit - Moved in 1969 or earlier (%)
Means of transportation to work - Drove car alone (%)
Means of transportation to work - Carpooled (%)
Means of transportation to work - Public transportation (%)
Means of transportation to work - Bus or trolley bus (%)
Means of transportation to work - Streetcar or trolley car (%)
Means of transportation to work - Subway or elevated (%)
Means of transportation to work - Railroad (%)
Means of transportation to work - Ferryboat (%)
Means of transportation to work - Taxicab (%)
Means of transportation to work - Motorcycle (%)
Means of transportation to work - Bicycle (%)
Means of transportation to work - Walked (%)
Means of transportation to work - Other means (%)
Working at home (%)
Industry diversity
Most Common Industries - Agriculture, forestry, fishing and hunting, and mining (%)
Most Common Industries - Agriculture, forestry, fishing and hunting (%)
Most Common Industries - Mining, quarrying, and oil and gas extraction (%)
Most Common Industries - Construction (%)
Most Common Industries - Manufacturing (%)
Most Common Industries - Wholesale trade (%)
Most Common Industries - Retail trade (%)
Most Common Industries - Transportation and warehousing, and utilities (%)
Most Common Industries - Transportation and warehousing (%)
Most Common Industries - Utilities (%)
Most Common Industries - Information (%)
Most Common Industries - Finance and insurance, and real estate and rental and leasing (%)
Most Common Industries - Finance and insurance (%)
Most Common Industries - Real estate and rental and leasing (%)
Most Common Industries - Professional, scientific, and management, and administrative and waste management services (%)
Most Common Industries - Professional, scientific, and technical services (%)
Most Common Industries - Management of companies and enterprises (%)
Most Common Industries - Administrative and support and waste management services (%)
Most Common Industries - Educational services, and health care and social assistance (%)
Most Common Industries - Educational services (%)
Most Common Industries - Health care and social assistance (%)
Most Common Industries - Arts, entertainment, and recreation, and accommodation and food services (%)
Most Common Industries - Arts, entertainment, and recreation (%)
Most Common Industries - Accommodation and food services (%)
Most Common Industries - Other services, except public administration (%)
Most Common Industries - Public administration (%)
Occupation diversity
Most Common Occupations - Management, business, science, and arts occupations (%)
Most Common Occupations - Management, business, and financial occupations (%)
Most Common Occupations - Management occupations (%)
Most Common Occupations - Business and financial operations occupations (%)
Most Common Occupations - Computer, engineering, and science occupations (%)
Most Common Occupations - Computer and mathematical occupations (%)
Most Common Occupations - Architecture and engineering occupations (%)
Most Common Occupations - Life, physical, and social science occupations (%)
Most Common Occupations - Education, legal, community service, arts, and media occupations (%)
Most Common Occupations - Community and social service occupations (%)
Most Common Occupations - Legal occupations (%)
Most Common Occupations - Education, training, and library occupations (%)
Most Common Occupations - Arts, design, entertainment, sports, and media occupations (%)
Most Common Occupations - Healthcare practitioners and technical occupations (%)
Most Common Occupations - Health diagnosing and treating practitioners and other technical occupations (%)
Most Common Occupations - Health technologists and technicians (%)
Most Common Occupations - Service occupations (%)
Most Common Occupations - Healthcare support occupations (%)
Most Common Occupations - Protective service occupations (%)
Most Common Occupations - Fire fighting and prevention, and other protective service workers including supervisors (%)
Most Common Occupations - Law enforcement workers including supervisors (%)
Most Common Occupations - Food preparation and serving related occupations (%)
Most Common Occupations - Building and grounds cleaning and maintenance occupations (%)
Most Common Occupations - Personal care and service occupations (%)
Most Common Occupations - Sales and office occupations (%)
Most Common Occupations - Sales and related occupations (%)
Most Common Occupations - Office and administrative support occupations (%)
Most Common Occupations - Natural resources, construction, and maintenance occupations (%)
Most Common Occupations - Farming, fishing, and forestry occupations (%)
Most Common Occupations - Construction and extraction occupations (%)
Most Common Occupations - Installation, maintenance, and repair occupations (%)
Most Common Occupations - Production, transportation, and material moving occupations (%)
Most Common Occupations - Production occupations (%)
Most Common Occupations - Transportation occupations (%)
Most Common Occupations - Material moving occupations (%)
People in Group quarters - Institutionalized population (%)
People in Group quarters - Correctional institutions (%)
People in Group quarters - Federal prisons and detention centers (%)
People in Group quarters - Halfway houses (%)
People in Group quarters - Local jails and other confinement facilities (including police lockups) (%)
People in Group quarters - Military disciplinary barracks (%)
People in Group quarters - State prisons (%)
People in Group quarters - Other types of correctional institutions (%)
People in Group quarters - Nursing homes (%)
People in Group quarters - Hospitals/wards, hospices, and schools for the handicapped (%)
People in Group quarters - Hospitals/wards and hospices for chronically ill (%)
People in Group quarters - Hospices or homes for chronically ill (%)
People in Group quarters - Military hospitals or wards for chronically ill (%)
People in Group quarters - Other hospitals or wards for chronically ill (%)
People in Group quarters - Hospitals or wards for drug/alcohol abuse (%)
People in Group quarters - Mental (Psychiatric) hospitals or wards (%)
People in Group quarters - Schools, hospitals, or wards for the mentally retarded (%)
People in Group quarters - Schools, hospitals, or wards for the physically handicapped (%)
People in Group quarters - Institutions for the deaf (%)
People in Group quarters - Institutions for the blind (%)
People in Group quarters - Orthopedic wards and institutions for the physically handicapped (%)
People in Group quarters - Wards in general hospitals for patients who have no usual home elsewhere (%)
People in Group quarters - Wards in military hospitals for patients who have no usual home elsewhere (%)
People in Group quarters - Juvenile institutions (%)
People in Group quarters - Long-term care (%)
People in Group quarters - Homes for abused, dependent, and neglected children (%)
People in Group quarters - Residential treatment centers for emotionally disturbed children (%)
People in Group quarters - Training schools for juvenile delinquents (%)
People in Group quarters - Short-term care, detention or diagnostic centers for delinquent children (%)
People in Group quarters - Type of juvenile institution unknown (%)
People in Group quarters - Noninstitutionalized population (%)
People in Group quarters - College dormitories (includes college quarters off campus) (%)
People in Group quarters - Military quarters (%)
People in Group quarters - On base (%)
People in Group quarters - Barracks, unaccompanied personnel housing (UPH), (Enlisted/Officer), ;and similar group living quarters for military personnel (%)
People in Group quarters - Transient quarters for temporary residents (%)
People in Group quarters - Military ships (%)
People in Group quarters - Group homes (%)
People in Group quarters - Homes or halfway houses for drug/alcohol abuse (%)
People in Group quarters - Homes for the mentally ill (%)
People in Group quarters - Homes for the mentally retarded (%)
People in Group quarters - Homes for the physically handicapped (%)
People in Group quarters - Other group homes (%)
People in Group quarters - Religious group quarters (%)
People in Group quarters - Dormitories (%)
People in Group quarters - Agriculture workers' dormitories on farms (%)
People in Group quarters - Job Corps and vocational training facilities (%)
People in Group quarters - Other workers' dormitories (%)
People in Group quarters - Crews of maritime vessels (%)
People in Group quarters - Other nonhousehold living situations (%)
People in Group quarters - Other noninstitutional group quarters (%)
Residents speaking English at home (%)
Residents speaking English at home - Born in the United States (%)
Residents speaking English at home - Native, born elsewhere (%)
Residents speaking English at home - Foreign born (%)
Residents speaking Spanish at home (%)
Residents speaking Spanish at home - Born in the United States (%)
Residents speaking Spanish at home - Native, born elsewhere (%)
Residents speaking Spanish at home - Foreign born (%)
Residents speaking other language at home (%)
Residents speaking other language at home - Born in the United States (%)
Residents speaking other language at home - Native, born elsewhere (%)
Residents speaking other language at home - Foreign born (%)
Class of Workers - Employee of private company (%)
Class of Workers - Self-employed in own incorporated business (%)
Class of Workers - Private not-for-profit wage and salary workers (%)
Class of Workers - Local government workers (%)
Class of Workers - State government workers (%)
Class of Workers - Federal government workers (%)
Class of Workers - Self-employed workers in own not incorporated business and Unpaid family workers (%)
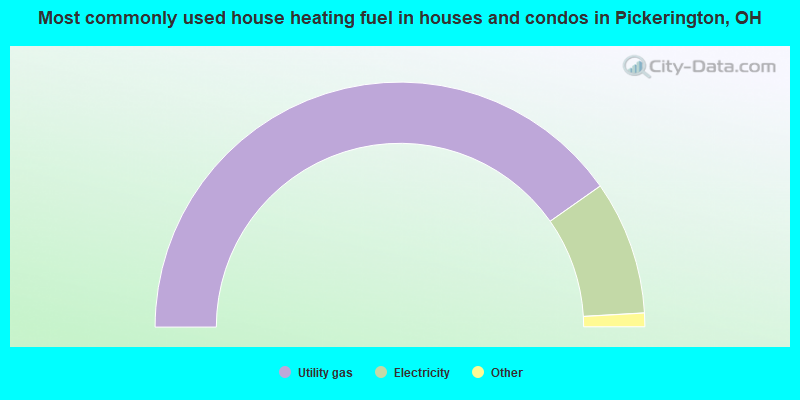
House heating fuel used in houses and condos - Utility gas (%)
House heating fuel used in houses and condos - Bottled, tank, or LP gas (%)
House heating fuel used in houses and condos - Electricity (%)
House heating fuel used in houses and condos - Fuel oil, kerosene, etc. (%)
House heating fuel used in houses and condos - Coal or coke (%)
House heating fuel used in houses and condos - Wood (%)
House heating fuel used in houses and condos - Solar energy (%)
House heating fuel used in houses and condos - Other fuel (%)
House heating fuel used in houses and condos - No fuel used (%)
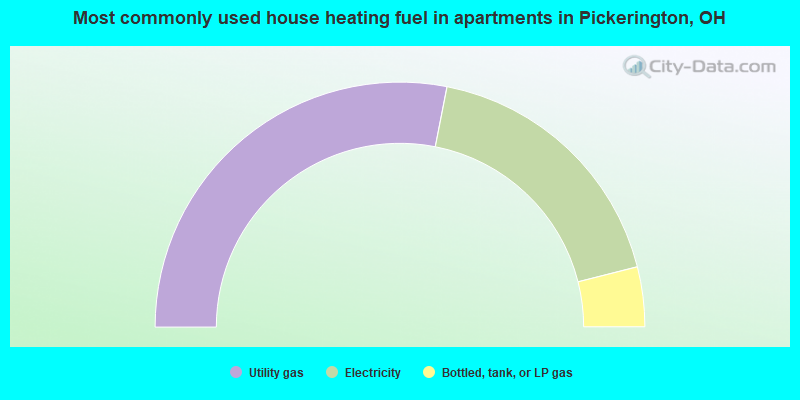
House heating fuel used in apartments - Utility gas (%)
House heating fuel used in apartments - Bottled, tank, or LP gas (%)
House heating fuel used in apartments - Electricity (%)
House heating fuel used in apartments - Fuel oil, kerosene, etc. (%)
House heating fuel used in apartments - Coal or coke (%)
House heating fuel used in apartments - Wood (%)
House heating fuel used in apartments - Solar energy (%)
House heating fuel used in apartments - Other fuel (%)
House heating fuel used in apartments - No fuel used (%)
Armed forces status - In Armed Forces (%)
Armed forces status - Civilian (%)
Armed forces status - Civilian - Veteran (%)
Armed forces status - Civilian - Nonveteran (%)
Fatal accidents locations in years 2005-2021
Fatal accidents locations in 2005
Fatal accidents locations in 2006
Fatal accidents locations in 2007
Fatal accidents locations in 2008
Fatal accidents locations in 2009
Fatal accidents locations in 2010
Fatal accidents locations in 2011
Fatal accidents locations in 2012
Fatal accidents locations in 2013
Fatal accidents locations in 2014
Fatal accidents locations in 2015
Fatal accidents locations in 2016
Fatal accidents locations in 2017
Fatal accidents locations in 2018
Fatal accidents locations in 2019
Fatal accidents locations in 2020
Fatal accidents locations in 2021
Alcohol use - People drinking some alcohol every month (%)
Alcohol use - People not drinking at all (%)
Alcohol use - Average days/month drinking alcohol
Alcohol use - Average drinks/week
Alcohol use - Average days/year people drink much
Audiometry - Average condition of hearing (%)
Audiometry - People that can hear a whisper from across a quiet room (%)
Audiometry - People that can hear normal voice from across a quiet room (%)
Audiometry - Ears ringing, roaring, buzzing (%)
Audiometry - Had a job exposure to loud noise (%)
Audiometry - Had off-work exposure to loud noise (%)
Blood Pressure & Cholesterol - Has high blood pressure (%)
Blood Pressure & Cholesterol - Checking blood pressure at home (%)
Blood Pressure & Cholesterol - Frequently checking blood cholesterol (%)
Blood Pressure & Cholesterol - Has high cholesterol level (%)
Consumer Behavior - Money monthly spent on food at supermarket/grocery store
Consumer Behavior - Money monthly spent on food at other stores
Consumer Behavior - Money monthly spent on eating out
Consumer Behavior - Money monthly spent on carryout/delivered foods
Consumer Behavior - Income spent on food at supermarket/grocery store (%)
Consumer Behavior - Income spent on food at other stores (%)
Consumer Behavior - Income spent on eating out (%)
Consumer Behavior - Income spent on carryout/delivered foods (%)
Current Health Status - General health condition (%)
Current Health Status - Blood donors (%)
Current Health Status - Has blood ever tested for HIV virus (%)
Current Health Status - Left-handed people (%)
Dermatology - People using sunscreen (%)
Diabetes - Diabetics (%)
Diabetes - Had a blood test for high blood sugar (%)
Diabetes - People taking insulin (%)
Diet Behavior & Nutrition - Diet health (%)
Diet Behavior & Nutrition - Milk product consumption (# of products/month)
Diet Behavior & Nutrition - Meals not home prepared (#/week)
Diet Behavior & Nutrition - Meals from fast food or pizza place (#/week)
Diet Behavior & Nutrition - Ready-to-eat foods (#/month)
Diet Behavior & Nutrition - Frozen meals/pizza (#/month)
Drug Use - People that ever used marijuana or hashish (%)
Drug Use - Ever used hard drugs (%)
Drug Use - Ever used any form of cocaine (%)
Drug Use - Ever used heroin (%)
Drug Use - Ever used methamphetamine (%)
Health Insurance - People covered by health insurance (%)
Kidney Conditions-Urology - Avg. # of times urinating at night
Medical Conditions - People with asthma (%)
Medical Conditions - People with anemia (%)
Medical Conditions - People with psoriasis (%)
Medical Conditions - People with overweight (%)
Medical Conditions - Elderly people having difficulties in thinking or remembering (%)
Medical Conditions - People who ever received blood transfusion (%)
Medical Conditions - People having trouble seeing even with glass/contacts (%)
Medical Conditions - People with arthritis (%)
Medical Conditions - People with gout (%)
Medical Conditions - People with congestive heart failure (%)
Medical Conditions - People with coronary heart disease (%)
Medical Conditions - People with angina pectoris (%)
Medical Conditions - People who ever had heart attack (%)
Medical Conditions - People who ever had stroke (%)
Medical Conditions - People with emphysema (%)
Medical Conditions - People with thyroid problem (%)
Medical Conditions - People with chronic bronchitis (%)
Medical Conditions - People with any liver condition (%)
Medical Conditions - People who ever had cancer or malignancy (%)
Mental Health - People who have little interest in doing things (%)
Mental Health - People feeling down, depressed, or hopeless (%)
Mental Health - People who have trouble sleeping or sleeping too much (%)
Mental Health - People feeling tired or having little energy (%)
Mental Health - People with poor appetite or overeating (%)
Mental Health - People feeling bad about themself (%)
Mental Health - People who have trouble concentrating on things (%)
Mental Health - People moving or speaking slowly or too fast (%)
Mental Health - People having thoughts they would be better off dead (%)
Oral Health - Average years since last visit a dentist
Oral Health - People embarrassed because of mouth (%)
Oral Health - People with gum disease (%)
Oral Health - General health of teeth and gums (%)
Oral Health - Average days a week using dental floss/device
Oral Health - Average days a week using mouthwash for dental problem
Oral Health - Average number of teeth
Pesticide Use - Households using pesticides to control insects (%)
Pesticide Use - Households using pesticides to kill weeds (%)
Physical Activity - People doing vigorous-intensity work activities (%)
Physical Activity - People doing moderate-intensity work activities (%)
Physical Activity - People walking or bicycling (%)
Physical Activity - People doing vigorous-intensity recreational activities (%)
Physical Activity - People doing moderate-intensity recreational activities (%)
Physical Activity - Average hours a day doing sedentary activities
Physical Activity - Average hours a day watching TV or videos
Physical Activity - Average hours a day using computer
Physical Functioning - People having limitations keeping them from working (%)
Physical Functioning - People limited in amount of work they can do (%)
Physical Functioning - People that need special equipment to walk (%)
Physical Functioning - People experiencing confusion/memory problems (%)
Physical Functioning - People requiring special healthcare equipment (%)
Prescription Medications - Average number of prescription medicines taking
Preventive Aspirin Use - Adults 40+ taking low-dose aspirin (%)
Reproductive Health - Vaginal deliveries (%)
Reproductive Health - Cesarean deliveries (%)
Reproductive Health - Deliveries resulted in a live birth (%)
Reproductive Health - Pregnancies resulted in a delivery (%)
Reproductive Health - Women breastfeeding newborns (%)
Reproductive Health - Women that had a hysterectomy (%)
Reproductive Health - Women that had both ovaries removed (%)
Reproductive Health - Women that have ever taken birth control pills (%)
Reproductive Health - Women taking birth control pills (%)
Reproductive Health - Women that have ever used Depo-Provera or injectables (%)
Reproductive Health - Women that have ever used female hormones (%)
Sexual Behavior - People 18+ that ever had sex (vaginal, anal, or oral) (%)
Sexual Behavior - Males 18+ that ever had vaginal sex with a woman (%)
Sexual Behavior - Males 18+ that ever performed oral sex on a woman (%)
Sexual Behavior - Males 18+ that ever had anal sex with a woman (%)
Sexual Behavior - Males 18+ that ever had any sex with a man (%)
Sexual Behavior - Females 18+ that ever had vaginal sex with a man (%)
Sexual Behavior - Females 18+ that ever performed oral sex on a man (%)
Sexual Behavior - Females 18+ that ever had anal sex with a man (%)
Sexual Behavior - Females 18+ that ever had any kind of sex with a woman (%)
Sexual Behavior - Average age people first had sex
Sexual Behavior - Average number of female sex partners in lifetime (males 18+)
Sexual Behavior - Average number of female vaginal sex partners in lifetime (males 18+)
Sexual Behavior - Average age people first performed oral sex on a woman (18+)
Sexual Behavior - Average number of woman performed oral sex on in lifetime (18+)
Sexual Behavior - Average number of male sex partners in lifetime (males 18+)
Sexual Behavior - Average number of male anal sex partners in lifetime (males 18+)
Sexual Behavior - Average age people first performed oral sex on a man (18+)
Sexual Behavior - Average number of male oral sex partners in lifetime (18+)
Sexual Behavior - People using protection when performing oral sex (%)
Sexual Behavior - Average number of times people have vaginal or anal sex a year
Sexual Behavior - People having sex without condom (%)
Sexual Behavior - Average number of male sex partners in lifetime (females 18+)
Sexual Behavior - Average number of male vaginal sex partners in lifetime (females 18+)
Sexual Behavior - Average number of female sex partners in lifetime (females 18+)
Sexual Behavior - Circumcised males 18+ (%)
Sleep Disorders - Average hours sleeping at night
Sleep Disorders - People that has trouble sleeping (%)
Smoking-Cigarette Use - People smoking cigarettes (%)
Taste & Smell - People 40+ having problems with smell (%)
Taste & Smell - People 40+ having problems with taste (%)
Taste & Smell - People 40+ that ever had wisdom teeth removed (%)
Taste & Smell - People 40+ that ever had tonsils teeth removed (%)
Taste & Smell - People 40+ that ever had a loss of consciousness because of a head injury (%)
Taste & Smell - People 40+ that ever had a broken nose or other serious injury to face or skull (%)
Taste & Smell - People 40+ that ever had two or more sinus infections (%)
Weight - Average height (inches)
Weight - Average weight (pounds)
Weight - Average BMI
Weight - People that are obese (%)
Weight - People that ever were obese (%)
Weight - People trying to lose weight (%)
According to our research of Ohio and other state lists, there were 18 registered sex offenders living in Pickerington, Ohio as of May 10, 2024 . The ratio of all residents to sex offenders in Pickerington is 1,079 to 1.The ratio of registered sex offenders to all residents in this city is lower than the state average.
Officers per 1,000 residents here:
1.44Ohio average:
2.45
Latest news from Pickerington, OH collected exclusively by city-data.com from local newspapers, TV, and radio stations
Ancestries: German (9.8%), Irish (8.5%), American (7.6%), English (6.5%), European (4.7%), Italian (2.1%).
Current Local Time:
Land area: 7.43 square miles.
Population density: 3,299 people per square mile (average).
1,460 residents are foreign born (4.0% Asia , 1.0% Africa ).
Median real estate property taxes paid for housing units with mortgages in 2022: $4,335 (1.4%)Median real estate property taxes paid for housing units with no mortgage in 2022: $4,580 (1.4%)
Nearest city with pop. 50,000+: Columbus, OH
Nearest city with pop. 1,000,000+: Chicago, IL
Nearest cities:
Brice, OH (2.0 miles),
Latitude: 39.89 N, Longitude: 82.76 W
Nickname or alias (official or unofficial): Violet Capital of Ohio
Daytime population change due to commuting: -4,309 (-18.1%)Workers who live and work in this city: 2,828 (22.6%)
Area code commonly used in this area: 614
Single-family new house construction building permits:
2022: 225 buildings , average cost: $336,2002021: 261 buildings , average cost: $306,0002020: 261 buildings , average cost: $286,8002019: 196 buildings , average cost: $248,8002018: 253 buildings , average cost: $231,9002017: 131 buildings , average cost: $285,7002016: 85 buildings , average cost: $276,6002015: 105 buildings , average cost: $249,2002014: 109 buildings , average cost: $238,2002013: 104 buildings , average cost: $209,3002012: 98 buildings , average cost: $207,6002011: 53 buildings , average cost: $197,7002010: 65 buildings , average cost: $211,1002009: 66 buildings , average cost: $205,5002008: 52 buildings , average cost: $199,8002007: 126 buildings , average cost: $186,3002006: 225 buildings , average cost: $203,2002005: 277 buildings , average cost: $196,2002004: 301 buildings , average cost: $184,2002003: 760 buildings , average cost: $145,7002002: 345 buildings , average cost: $173,6002001: 261 buildings , average cost: $178,8002000: 163 buildings , average cost: $184,8001999: 168 buildings , average cost: $154,7001998: 92 buildings , average cost: $148,1001997: 51 buildings , average cost: $145,700Unemployment in December 2023: Population change in the 1990s: +3,997 (+69.0%).
Most common occupations in Pickerington, OH (%)
Both Males Females
Other management occupations, except farmers and farm managers (5.7%)
Computer specialists (5.4%)
Sales representatives, services, wholesale and manufacturing (4.4%)
Other sales and related occupations, including supervisors (4.3%)
Retail sales workers, except cashiers (4.0%)
Other office and administrative support workers, including supervisors (4.0%)
Secretaries and administrative assistants (3.5%)
Computer specialists (8.6%)
Sales representatives, services, wholesale and manufacturing (6.4%)
Other sales and related occupations, including supervisors (5.8%)
Top executives (5.3%)
Other management occupations, except farmers and farm managers (5.1%)
Retail sales workers, except cashiers (4.8%)
Operations specialties managers, except financial managers (3.9%)
Other office and administrative support workers, including supervisors (8.0%)
Registered nurses (7.4%)
Secretaries and administrative assistants (7.2%)
Other management occupations, except farmers and farm managers (6.3%)
Waiters and waitresses (5.1%)
Preschool, kindergarten, elementary, and middle school teachers (3.8%)
Customer service representatives (3.6%)
Tornado activity:
Pickerington-area historical tornado activity is near Ohio state average. It is 9% greater than the overall U.S. average.
On 4/3/1974, a category F5 (max. wind speeds 261-318 mph) tornado 44.4 miles away from the Pickerington city center killed 36 people and injured 1150 people and caused between $50,000,000 and $500,000,000 in damages.
On 2/22/1971, a category F3 (max. wind speeds 158-206 mph) tornado 10.2 miles away from the city center injured 7 people and caused between $500,000 and $5,000,000 in damages.
Earthquake activity:
Pickerington-area historical earthquake activity is significantly above Ohio state average. It is 6% smaller than the overall U.S. average. On 7/27/1980 at 18:52:21, a magnitude 5.2 (5.1 MB, 4.7 MS, 5.0 UK, 5.2 UK, Class: Moderate, Intensity: VI - VII) earthquake occurred 132.8 miles away from Pickerington center On 9/25/1998 at 19:52:52, a magnitude 5.2 (4.8 MB, 4.3 MS, 5.2 LG, 4.5 MW, Depth: 3.1 mi) earthquake occurred 166.3 miles away from Pickerington center On 8/23/2011 at 17:51:04, a magnitude 5.8 (5.8 MW, Depth: 3.7 mi) earthquake occurred 293.8 miles away from Pickerington center On 1/31/1986 at 16:46:43, a magnitude 5.0 (5.0 MB) earthquake occurred 145.1 miles away from the city center On 7/12/1986 at 08:19:37, a magnitude 4.5 (4.5 MB, Class: Light, Intensity: IV - V) earthquake occurred 95.9 miles away from the city center On 9/7/1988 at 02:28:09, a magnitude 4.6 (4.5 MB, 4.6 LG) earthquake occurred 135.0 miles away from the city center Magnitude types: regional Lg-wave magnitude (LG), body-wave magnitude (MB), surface-wave magnitude (MS), moment magnitude (MW) Natural disasters: The number of natural disasters in Fairfield County (10) is smaller than the US average (15).Major Disasters (Presidential) Declared: 6Emergencies Declared: 3Floods: 4, Storms: 4, Tornadoes: 2, Winds: 2, Blizzard: 1, Heavy Rain: 1, Hurricane: 1, Mudslide: 1, Snow: 1, Snowstorm: 1, Tropical Depression: 1, Winter Storm: 1, Other: 1 (Note: some incidents may be assigned to more than one category). Main business address for: BARRY R G CORP /OH/ FOOTWEAR, (NO RUBBER) ).
Hospitals and medical centers in Pickerington: ECHO MANOR EXTENDED CARE CTR (10270 BLACKLICK EASTERN ROAD NW)
KINDRED TRANSITIONAL CARE AND REHAB-PICKERINGTONI (1300 HILL ROAD NORTH)
Other hospitals and medical centers near Pickerington: DILEY RIDGE MEDICAL CENTER (about 4 miles away; CANAL WINCHESTER, OH)
TENDER NURSING CARE, INC (Home Health Center, about 4 miles away; REYNOLDSBURG, OH)
KINDRED TRANSITIONAL CARE AND REHAB-WINCHESTER PLACE (Nursing Home, about 4 miles away; CANAL WINCHESTER, OH)
WINCHESTER PLACE (Nursing Home, about 4 miles away; CANAL WINCHESTER, OH)
SIGNATURE CARE, INC (Home Health Center, about 4 miles away; REYNOLDSBURG, OH)
GOOD NURSING CARE (Home Health Center, about 5 miles away; CANAL WINCHESTER, OH)
ADD GRAHAM ROAD (Hospital, about 5 miles away; REYNOLDSBURG, OH)
Amtrak station near Pickerington: 14 miles: COLUMBUS (111 EAST TOWN ST.) - Bus Station Services: enclosed waiting area, public restrooms, public payphones.
Colleges/universities with over 2000 students nearest to Pickerington:
DeVry University-Ohio (about 10 miles; Columbus, OH ; Full-time enrollment: 3,896)
Capital University (about 11 miles; Columbus, OH ; FT enrollment: 3,029)
Ohio Dominican University (about 12 miles; Columbus, OH ; FT enrollment: 2,045)
Franklin University (about 13 miles; Columbus, OH ; FT enrollment: 3,736)
Columbus State Community College (about 14 miles; Columbus, OH ; FT enrollment: 24,488)
Ohio State University-Main Campus (about 15 miles; Columbus, OH ; FT enrollment: 50,395)
Denison University (about 18 miles; Granville, OH ; FT enrollment: 2,268)
Public high schools in Pickerington: PICKERINGTON HIGH SCHOOL NORTH Students: 1,824, Location: 7800 REFUGEE RD, Grades: 9-12)PICKERINGTON HIGH SCHOOL CENTRAL Students: 1,629, Location: 300 OPPORTUNITY WAY, Grades: 9-12)PICKERINGTON RIDGEVIEW JUNIOR HIGH SCHOOL Students: 797, Location: 130 HILL RD S, Grades: 7-9)PICKERINGTON COMMUNITY SCHOOL Location: 7800 REFUGEE RD, Grades: 9-12, Charter school )
Biggest public elementary/middle schools in Pickerington: PICKERINGTON LAKEVIEW JUNIOR HIGH Students: 836, Location: 12445 AULT RD, Grades: 7-8)HARMON MIDDLE SCHOOL Students: 602, Location: 12410 HARMON RD, Grades: 5-7)DILEY MIDDLE SCHOOL Students: 571, Location: 750 PRESTON TRAILS DR, Grades: PK-7)PICKERINGTON ELEMENTARY SCHOOL Students: 507, Location: 775 LONG RD, Grades: KG-5)FAIRFIELD ELEMENTARY SCHOOL Students: 505, Location: 13000 COVENTRY AVE, Grades: KG-5)VIOLET ELEMENTARY SCHOOL Students: 368, Location: 8855 EDUCATION DR, Grades: PK-4)HERITAGE ELEMENTARY SCHOOL Location: 100 N EAST ST, Grades: KG-4)
TOLL GATE ELEMENTARY Location: 12183 TOLLGATE RD, Grades: KG-4)
SYCAMORE CREEK ELEMENTARY SCHOOL Location: 500 SYCAMORE CREEK ST, Grades: KG-4)
TOLL GATE MIDDLE SCHOOL Location: 12089 TOLLGATE RD, Grades: 4-7)
Private elementary/middle school in Pickerington: EAGLE PREPARATORY & KINGDOM EXPRESS Students: 53, Location: 6810 BLACKLICK EASTERN RD, Grades: UG-5)
See full list of schools located in Pickerington Library in Pickerington: PICKERINGTON PUBLIC LIBRARY Operating income: $1,163,429; Location: 201 OPPORTUNITY WAY; 126,728 books ; 3,678 e-books ; 14,022 audio materials ; 10,300 video materials ; 3 local licensed databases ; 266 state licensed databases ; 5 other licensed databases ; 243 print serial subscriptions ; 1 electronic serial subscriptions )
Notable locations in Pickerington: (A) , Pickerington City Hall (B) . Display/hide their locations on the map
Shopping Center: (1) . Display/hide its location on the map
Church in Pickerington: (A) . Display/hide its location on the map
Cemetery: (1) . Display/hide its location on the map
Parks in Pickerington include: (1) , Simsbury Park (2) , Victory Park (3) . Display/hide their locations on the map
Tourist attractions:
Hotels:
Birthplace of: Chris Leitch - Soccer player, A. J. Trapasso - Football player, Earl Moore - Baseball player, LaToya Turner - WNBA player (Phoenix Mercury, born : Dec 2, 1980), Ryan Manalac - Football player.
Fairfield County has a predicted average indoor radon screening level greater than 4 pCi/L (pico curies per liter) - Highest Potential Average household size: This city:
2.9 peopleOhio:
2.4 people
Percentage of family households: This city:
78.2%Whole state:
65.0%
Percentage of households with unmarried partners: This city:
5.3%Whole state:
6.8%
Likely homosexual households (counted as self-reported same-sex unmarried-partner households)
Lesbian couples: 0.4% of all households Gay men: 0.2% of all households
82 people in nursing facilities/skilled-nursing facilities in 2010people in religious group quarters in 2000
Banks with most branches in Pickerington (2011 data):
JPMorgan Chase Bank, National Association: Pickerington North Banking Ctr. Bran at 7915 Refugee Road, N.W., branch established on 2005/12/21; Pickerington Branch at 1785 Hill Road North, branch established on 1989/12/26. Info updated 2011/11/10: Bank assets: $1,811,678.0 mil, Deposits: $1,190,738.0 mil, headquarters in Columbus, OH, positive income , International Specialization, 5577 total offices , Holding Company: Jpmorgan Chase & Co.
The Park National Bank: 0624 Pickerington East - $ Mkt - Bra at 7833 Refugee Road Nw, branch established on 2005/06/30; 0618 Pickerington Super Money Mkt Br at 1045 Hill Road North, branch established on 1992/08/10. Info updated 2008/09/29: Bank assets: $6,281.7 mil, Deposits: $4,611.6 mil, headquarters in Newark, OH, positive income , Commercial Lending Specialization, 123 total offices , Holding Company: Park National Corporation
KeyBank National Association: Pickerington Branch at 126 Postage Drive, branch established on 2009/09/28. Info updated 2008/03/03: Bank assets: $86,198.8 mil, Deposits: $64,214.8 mil, headquarters in Cleveland, OH, positive income , Commercial Lending Specialization, 1067 total offices , Holding Company: Keycorp
Fifth Third Bank: Pickerington Branch at 1010 Old Diley Road, branch established on 1990/12/01. Info updated 2009/10/05: Bank assets: $114,540.4 mil, Deposits: $89,689.1 mil, headquarters in Cincinnati, OH, positive income , Commercial Lending Specialization, 1378 total offices , Holding Company: Fifth Third Bancorp
Fairfield Federal Savings and Loan Association of Lancaster: Crosscreeks Blvd Branch at 1515 Cross Creeks Blvd, branch established on 1999/04/01. Info updated 2011/07/21: Bank assets: $268.8 mil, Deposits: $234.7 mil, headquarters in Lancaster, OH, positive income , Mortgage Lending Specialization, 3 total offices
The Huntington National Bank: Pickerington Square Branch at 125 Postage Dr, branch established on 1990/09/24. Info updated 2012/04/02: Bank assets: $54,183.4 mil, Deposits: $44,300.3 mil, headquarters in Columbus, OH, positive income , Commercial Lending Specialization, 878 total offices , Holding Company: Huntington Bancshares Incorporated
U.S. Bank National Association: Pickerington Branch at 13000 Stonecreek Drive, Northwest, branch established on 1907/01/01. Info updated 2012/01/30: Bank assets: $330,470.8 mil, Deposits: $236,091.5 mil, headquarters in Cincinnati, OH, positive income , 3121 total offices , Holding Company: U.S. Bancorp
Firstmerit Bank, National Association: Pickerington Giant Eagle #6514 Branc at 873 Refugee Road, branch established on 2006/09/12. Info updated 2010/05/17: Bank assets: $14,420.6 mil, Deposits: $11,497.6 mil, headquarters in Akron, OH, positive income , Commercial Lending Specialization, 213 total offices , Holding Company: Firstmerit Corporation
PNC Bank, National Association: Pickerington Branch at 839 Refugee Road, branch established on 1975/10/20. Info updated 2012/03/20: Bank assets: $263,309.6 mil, Deposits: $197,343.0 mil, headquarters in Wilmington, DE, positive income , Commercial Lending Specialization, 3085 total offices , Holding Company: Pnc Financial Services Group, Inc., The
For population 15 years and over in Pickerington:
Never married: 26.7%Now married: 58.3%Separated: 2.5%Widowed: 3.8%Divorced: 8.6% For population 25 years and over in Pickerington:
High school or higher: 96.1%Bachelor's degree or higher: 50.9%Graduate or professional degree: 18.2%Unemployed: 1.9%Mean travel time to work (commute): 22.0 minutes
Education Gini index (Inequality in education) Here:
10.2Ohio average:
11.0
Religion statistics for Pickerington, OH (based on Fairfield County data)
Religion Adherents Congregations Evangelical Protestant 20,742 83 Catholic 17,500 6 Mainline Protestant 17,001 64 Other 1,916 10 None 88,997 -
Source: Clifford Grammich, Kirk Hadaway, Richard Houseal, Dale E.Jones, Alexei Krindatch, Richie Stanley and Richard H.Taylor. 2012. 2010 U.S.Religion Census: Religious Congregations & Membership Study. Association of Statisticians of American Religious Bodies. Jones, Dale E., et al. 2002. Congregations and Membership in the United States 2000. Nashville, TN: Glenmary Research Center. Graphs represent county-level data
Food Environment Statistics: Number of grocery stores : 15This county :
1.06 / 10,000 pop.Ohio :
1.89 / 10,000 pop.
Number of supercenters and club stores : 3This county :
0.21 / 10,000 pop.Ohio :
0.13 / 10,000 pop.
Number of convenience stores (no gas) : 11Fairfield County :
0.78 / 10,000 pop.Ohio :
1.25 / 10,000 pop.
Number of convenience stores (with gas) : 33Here :
2.34 / 10,000 pop.State :
2.93 / 10,000 pop.
Number of full-service restaurants : 73Fairfield County :
5.18 / 10,000 pop.Ohio :
6.25 / 10,000 pop.
Adult diabetes rate : This county :
9.6%Ohio :
10.3%
Adult obesity rate : Fairfield County :
30.4%Ohio :
29.1%
Low-income preschool obesity rate : Fairfield County :
9.9%Ohio :
11.9%
Health and Nutrition: Healthy diet rate : This city:
51.6%Ohio:
50.4%
Average overall health of teeth and gums : People feeling badly about themselves : This city:
21.6%Ohio:
20.6%
People not drinking alcohol at all : This city:
8.3%State:
10.4%
Average hours sleeping at night : Overweight people : Pickerington:
33.6%Ohio:
34.3%
General health condition : Pickerington:
60.0%State:
57.0%
Average condition of hearing : Pickerington:
81.7%Ohio:
79.1%
More about Health and Nutrition of Pickerington, OH Residents
Local government employment and payroll (March 2022)
Function
Full-time employees
Monthly full-time payroll
Average yearly full-time wage
Part-time employees
Monthly part-time payroll
Police Protection - Officers
35 $269,205 $92,299 0 $0 Other Government Administration
11 $76,110 $83,029 9 $11,233 Streets and Highways
11 $63,568 $69,347 1 $1,702 Police - Other
10 $62,303 $74,764 0 $0 Financial Administration
10 $57,581 $69,097 1 $1,308 Water Supply
5 $27,495 $65,988 0 $0 Housing and Community Development (Local)
3 $16,650 $66,600 0 $0 Other and Unallocable
3 $16,542 $66,168 0 $0 Sewerage
3 $18,949 $75,796 0 $0 Parks and Recreation
2 $11,998 $71,988 0 $0 Judicial and Legal
1 $6,764 $81,168 0 $0
Totals for Government
94 $627,166 $80,064 11 $14,242
Pickerington government finances - Expenditure in 2021 (per resident):
Construction - Parks and Recreation: $460,000 ($18.76)
Police Protection: $365,000 ($14.88)Sewerage: $216,000 ($8.81)Water Utilities: $185,000 ($7.54)Regular Highways: $64,000 ($2.61)Current Operations - Police Protection: $5,511,000 ($224.72)
Central Staff Services: $4,209,000 ($171.63)Regular Highways: $2,145,000 ($87.47)Sewerage: $2,046,000 ($83.43)Water Utilities: $1,790,000 ($72.99)Parks and Recreation: $822,000 ($33.52)Financial Administration: $471,000 ($19.21)General Public Buildings: $361,000 ($14.72)Judicial and Legal Services: $145,000 ($5.91)General - Interest on Debt: $556,000 ($22.67)
Total Salaries and Wages: $6,688,000 ($272.71)
Water Utilities - Interest on Debt: $66,000 ($2.69)
Pickerington government finances - Revenue in 2021 (per resident):
Charges - Sewerage: $3,648,000 ($148.75)
Parks and Recreation: $376,000 ($15.33)Miscellaneous Commercial Activities: $347,000 ($14.15)Local Intergovernmental - General Local Government Support: $202,000 ($8.24)
Highways: $158,000 ($6.44)Miscellaneous - Interest Earnings: $565,000 ($23.04)
General Revenue - Other: $397,000 ($16.19)Fines and Forfeits: $289,000 ($11.78)Sale of Property: $16,000 ($0.65)Revenue - Water Utilities: $2,473,000 ($100.84)
State Intergovernmental - Highways: $1,867,000 ($76.13)
General Local Government Support: $620,000 ($25.28)Tax - Individual Income: $6,710,000 ($273.61)
Property: $2,756,000 ($112.38)Corporation Net Income: $421,000 ($17.17)Public Utilities Sales: $221,000 ($9.01)Other Selective Sales: $137,000 ($5.59)Alcoholic Beverage License: $38,000 ($1.55)
Pickerington government finances - Debt in 2021 (per resident):
Long Term Debt - Beginning Outstanding - Unspecified Public Purpose: $10,097,000 ($411.72)
Retired Unspecified Public Purpose: $5,049,000 ($205.88)Outstanding Unspecified Public Purpose: $5,048,000 ($205.84)
Pickerington government finances - Cash and Securities in 2021 (per resident):
Other Funds - Cash and Securities: $27,902,000 ($1137.74)
Businesses in Pickerington, OH
Name Count Name Count
AT&T 1 KFC 1 Advance Auto Parts 1 Kohl's 1 Arby's 1 Kroger 2 AutoZone 1 Little Caesars Pizza 1 Barnes & Noble 1 Long John Silver's 1 Bed Bath & Beyond 1 McDonald's 1 Best Western 1 New Balance 1 Blockbuster 1 Nike 2 Burger King 1 Pizza Hut 1 CVS 1 SONIC Drive-In 1 Circle K 1 Sears 1 Cold Stone Creamery 1 Sprint Nextel 1 Comfort Inn 1 Starbucks 1 Cracker Barrel 1 Steak 'n Shake 1 Dairy Queen 1 Subway 2 Domino's Pizza 1 Taco Bell 1 FedEx 3 Tim Hortons 1 Firestone Complete Auto Care 1 U-Haul 1 GNC 1 UPS 9 H&R Block 1 Walgreens 1 Hilton 1 Wendy's 3 Holiday Inn 1
Strongest AM radio stations in Pickerington:
WTVN (610 AM; 50 kW; COLUMBUS, OH; Owner: CITICASTERS LICENSES, L.P.)
WRFD (880 AM; daytime; 23 kW; COLUMBUS-WORTHINGTON, OH; Owner: SALEM MEDIA OF OHIO, INC.)
WBNS (1460 AM; 5 kW; COLUMBUS, OH; Owner: RADIOHIO, INCORPORATED)
WOSU (820 AM; 5 kW; COLUMBUS, OH; Owner: THE OHIO STATE UNIVERSITY)
WLW (700 AM; 50 kW; CINCINNATI, OH; Owner: JACOR BROADCASTING CORPORATION)
WLOH (1320 AM; 1 kW; LANCASTER, OH)
WMNI (920 AM; 1 kW; COLUMBUS, OH; Owner: NORTH AMERICAN BROADCASTING CO.)
WKNR (850 AM; 50 kW; CLEVELAND, OH; Owner: CARON BROADCASTING, INC.)
WWVA (1170 AM; 53 kW; WHEELING, WV; Owner: CAPSTAR TX LIMITED PARTNERSHIP)
WCOL (1230 AM; 1 kW; COLUMBUS, OH; Owner: CITICASTERS LICENSES, L.P.)
WTAM (1100 AM; 50 kW; CLEVELAND, OH; Owner: JACOR BROADCASTING CORPORATION)
WHTH (790 AM; 1 kW; HEATH, OH; Owner: RUNNYMEDE, INC.)
WHK (1220 AM; 50 kW; CLEVELAND, OH; Owner: CARON BROADCASTING, INC.)
Strongest FM radio stations in Pickerington:
W201AK (88.1 FM; COLUMBUS, OH; Owner: THE CEDARVILLE UNIVERSITY)
WOSU-FM (89.7 FM; COLUMBUS, OH; Owner: THE OHIO STATE UNIVERSITY)
WUFM (88.7 FM; COLUMBUS, OH; Owner: SPIRIT COMMUNICATIONS, INC)
WBZX (99.7 FM; COLUMBUS, OH; Owner: NORTH AMERICAN BROADCASTING CO., INC)
WBNS-FM (97.1 FM; COLUMBUS, OH; Owner: RADIO OHIO, INC.)
WCOL-FM (92.3 FM; COLUMBUS, OH; Owner: CITICASTERS LICENSES, L.P.)
WXMG (98.9 FM; UPPER ARLINGTON, OH; Owner: BLUE CHIP BROADCASTING LICENSES, LTD)
WLVQ (96.3 FM; COLUMBUS, OH; Owner: INFINITY RADIO OPERATIONS INC.)
WHOK-FM (95.5 FM; LANCASTER, OH; Owner: INFINITY RADIO SUBSIDIARY OPERATIONS INC.)
WNCI (97.9 FM; COLUMBUS, OH; Owner: CITICASTERS LICENSES, L.P.)
WCBE (90.5 FM; COLUMBUS, OH; Owner: BD.OF EDUC.,CITY SCH.DIST.,COLUMBUS)
WFJX (105.7 FM; HILLIARD, OH; Owner: CITICASTERS LICENSES, L.P.)
WFCB (93.3 FM; CHILLICOTHE, OH; Owner: CLEAR CHANNEL BROADCASTING LICENSES, INC.)
WSNY (94.7 FM; COLUMBUS, OH; Owner: FRANKLIN COMMUNICATIONS, INC.)
WCKX (107.5 FM; COLUMBUS, OH; Owner: BLUE CHIP BROADCASTING LICENSES, LTD)
WCVO (104.9 FM; GAHANNA, OH; Owner: CHRISTIAN VOICE OF CENTRAL OHIO)
WJZA (103.5 FM; LANCASTER, OH; Owner: SKYWAY BROADCASTING COMPANY, INC.)
WRVT (88.7 FM; RUTLAND, VT; Owner: VERMONT PUBLIC RADIO)
WNKO (101.7 FM; NEWARK, OH; Owner: RUNNYMEDE, INC.)
WWCD (101.1 FM; GROVE CITY, OH; Owner: FUN WITH RADIO, LLC)
TV broadcast stations around Pickerington:
WSYX (Channel 6; COLUMBUS, OH; Owner: WSYX LICENSEE, INC.)
WTTE (Channel 28; COLUMBUS, OH; Owner: COLUMBUS (WTTE-TV) LICENSEE, INC.)
WBNS-TV (Channel 10; COLUMBUS, OH; Owner: WBNS-TV, INC.)
WCMH-TV (Channel 4; COLUMBUS, OH; Owner: OUTLET BROADCASTING, INC.)
WINJ-LP (Channel 8; COLUMBUS, OH; Owner: THE NEW LIFE FELLOWSHIP OF CHURCHES)
WOSU-TV (Channel 34; COLUMBUS, OH; Owner: THE OHIO STATE UNIVERSITY)
WCLL-LP (Channel 19; COLUMBUS, OH; Owner: JONATHAN W. OWENS)
WDEM-LP (Channel 17; COLUMBUS, OH; Owner: TRIPLETT & ASSOCIATES, INC.)
W23BZ (Channel 23; COLUMBUS, OH; Owner: NATIONAL MINORITY T.V., INC.)
WWHO (Channel 53; CHILLICOTHE, OH; Owner: UPN STATIONS GROUP INC.)
W43BZ (Channel 43; COLUMBUS, OH; Owner: VENTANA TELEVISION, INC.)
WCPX-LP (Channel 48; COLUMBUS, OH; Owner: PAXSON COMMUNICATIONS LICENSE COMPANY, LLC)
WSFJ-TV (Channel 51; NEWARK, OH; Owner: GUARDIAN VISION INTERNATIONAL, INC.)
National Bridge Inventory (NBI) Statistics 28 Number of bridges180ft / 54.9m Total length $5,000 Total costs169,203 Total average daily traffic15,001 Total average daily truck traffic
New bridges - historical statistics
2 1900-1909 1 1910-1919 1 1930-1939 3 1960-1969 6 1970-1979 2 1980-1989 5 1990-1999 5 2000-2009 1 2010-2019 2 2020-2022
See full National Bridge Inventory statistics for Pickerington, OH
FCC Registered Antenna Towers: 7
Douglas I Brandon, 122 S. Hill Road (Lat: 39.883056 Lon: -82.755833), Type: 57.9, Overall height: 57.9 m, Registrant: At&t Wireless Services, Inc., Esther.Hilliard@attws.Com, , Washi-ngton, Phone: (202) 223-9222 Douglas I Brandon, 122 S. Hill Road (Lat: 39.883056 Lon: -82.755833), Type: 57.9, Overall height: 57.9 m, Registrant: At&t Wireless Services, Inc., Esther.Hilliard@attws.Com, , Washi-ngton, Phone: (202) 223-9222 Shannan L Schmidt, 671 Windmiller Drive (Hv506 - Pickerington) (Lat: 39.905250 Lon: -82.777944), Type: 61.0, Overall height: 58 m, Registrant: Horvath Towers, LLC, Sschmidt@horvathcommunications.Com, , South- Bend, Phone: (574) 237-0464 Lottie L Thompson, 7953 Refugee Road Nw (Lat: 39.906083 Lon: -82.736917), Type: 70.7, Structure height: 39045 m, Overall height: 69.2 m, Registrant: Spectrasite Communications, LLC. Through American Towers, LLC., Atcfaa-Fccmidwest@americantower.Com, , Schau-mburg, Phone: (847) 240-1508 Lottie L Thompson, 7953 Refugee Road Nw (Lat: 39.906083 Lon: -82.736917), Type: 70.7, Structure height: 39045 m, Overall height: 69.2 m, Registrant: Spectrasite Communications, LLC. Through American Towers, LLC., Atcfaa-Fccmidwest@americantower.Com, , Schau-mburg, Phone: (847) 240-1508 Bridget Carter, 7953 Refugee Road Nw (Lat: 39.906083 Lon: -82.736917), Type: 70.7, Structure height: 39045 m, Overall height: 69.2 m, Licensee ID: L, Registrant: Spectrasite Communications, LLC. Through American Towers, LLC., Faa-Fcc@americantower.Com, , Wobur-n, Phone: (678) 265-6770 Jennifer Sirovica, 671 Windmiller Drive (Hv506 - Pickerington) (Lat: 39.905250 Lon: -82.777944), Type: 61.0, Structure height: 39045 m, Overall height: 58 m, Registrant: Horvath Towers, LLC, Sschmidt@horvathcommunications.Com, , South- Bend, Phone: (574) 237-0464 FCC Registered Broadcast Land Mobile Towers: 14 (
See the full list of FCC Registered Broadcast Land Mobile Towers in Pickerington, OH )
FCC Registered Microwave Towers: 3
Various Locations (Lat: 39.883389 Lon: -82.749889), Overall height: 6.1 m, Call Sign: WPJA858, Assigned Frequencies: 956.393 MHz, Grant Date: 09/17/2020, Expiration Date: 10/11/2030, Registrant: Vasu Communications, Inc, Avon, OH 44011, Phone: (440) 934-5268, Fax: (440) 934-4679, Email:
23837, Lat: 39.857222 Lon: -82.700000, Type: Building, Structure height: 5 m, Call Sign: WQJC938, Assigned Frequencies: 3675.00 MHz, Grant Date: 07/25/2018, Expiration Date: 10/17/2020, Cancellation Date: 12/19/2020, Certifier: Chad Wachter, Registrant: Lerman Senter Pllc, 2001 L Street, Nw Suite 400, Washington, DC 20036, Phone: (202) 416-6744, Email:
13687 Taylor Rd (Lat: 39.933667 Lon: -82.774333), Structure height: 27.4 m, Call Sign: WGZ569, Assigned Frequencies: 6875.00 MHz, Grant Date: 06/20/1988, Expiration Date: 10/01/2029, Registrant: Tegna Inc., 8350 Broad Street, Suite 2000, Tysons, VA 22102, Phone: (703) 873-6606, Email:
FCC Registered Amateur Radio Licenses: 258 (
See the full list of FCC Registered Amateur Radio Licenses in Pickerington )
FAA Registered Aircraft: 26 (
See the full list of FAA Registered Aircraft in Pickerington )
Home Mortgage Disclosure Act Aggregated Statistics For Year 2009(Based on 2 partial tracts) A) FHA, FSA/RHS & VA B) Conventional C) Refinancings D) Home Improvement Loans F) Non-occupant Loans on Number Average Value Number Average Value Number Average Value Number Average Value Number Average Value
LOANS ORIGINATED 107 $166,253 45 $150,600 259 $154,011 9 $27,861 8 $192,891 APPLICATIONS APPROVED, NOT ACCEPTED 4 $171,855 4 $128,162 23 $155,116 2 $28,990 1 $75,480 APPLICATIONS DENIED 14 $152,739 9 $128,732 82 $165,661 13 $34,399 4 $104,068 APPLICATIONS WITHDRAWN 10 $158,414 8 $187,792 51 $168,651 1 $13,230 2 $275,620 FILES CLOSED FOR INCOMPLETENESS 1 $209,340 0 $0 12 $151,958 0 $0 0 $0
Aggregated Statistics For Year 2008(Based on 2 partial tracts) A) FHA, FSA/RHS & VA B) Conventional C) Refinancings D) Home Improvement Loans F) Non-occupant Loans on G) Loans On Manufactured Number Average Value Number Average Value Number Average Value Number Average Value Number Average Value Number Average Value
LOANS ORIGINATED 82 $169,804 75 $150,833 99 $152,980 19 $26,039 19 $134,943 0 $0 APPLICATIONS APPROVED, NOT ACCEPTED 7 $194,513 11 $174,664 22 $159,785 5 $10,984 1 $115,560 0 $0 APPLICATIONS DENIED 9 $171,444 14 $151,030 101 $172,859 28 $28,129 6 $204,355 2 $85,495 APPLICATIONS WITHDRAWN 4 $180,282 14 $154,378 38 $179,876 2 $37,055 3 $102,150 0 $0 FILES CLOSED FOR INCOMPLETENESS 1 $200,700 3 $170,747 12 $156,140 1 $106,320 1 $153,960 0 $0
Aggregated Statistics For Year 2007(Based on 2 partial tracts) A) FHA, FSA/RHS & VA B) Conventional C) Refinancings D) Home Improvement Loans E) Loans on Dwellings For 5+ Families F) Non-occupant Loans on G) Loans On Manufactured Number Average Value Number Average Value Number Average Value Number Average Value Number Average Value Number Average Value Number Average Value
LOANS ORIGINATED 44 $182,317 174 $150,583 127 $130,070 23 $44,604 1 $2,858,350 18 $171,147 0 $0 APPLICATIONS APPROVED, NOT ACCEPTED 4 $188,075 22 $158,744 49 $161,503 8 $23,491 0 $0 2 $157,240 0 $0 APPLICATIONS DENIED 4 $177,288 36 $159,626 166 $154,499 26 $37,502 0 $0 8 $159,326 1 $26,720 APPLICATIONS WITHDRAWN 5 $176,504 20 $174,990 54 $158,105 6 $44,310 0 $0 3 $113,597 0 $0 FILES CLOSED FOR INCOMPLETENESS 0 $0 3 $115,120 23 $160,630 0 $0 0 $0 0 $0 0 $0
Aggregated Statistics For Year 2006(Based on 2 partial tracts) A) FHA, FSA/RHS & VA B) Conventional C) Refinancings D) Home Improvement Loans E) Loans on Dwellings For 5+ Families F) Non-occupant Loans on G) Loans On Manufactured Number Average Value Number Average Value Number Average Value Number Average Value Number Average Value Number Average Value Number Average Value
LOANS ORIGINATED 35 $174,848 258 $133,757 183 $134,569 25 $42,466 1 $1,818,530 25 $139,958 1 $29,120 APPLICATIONS APPROVED, NOT ACCEPTED 3 $201,740 41 $141,922 43 $124,657 6 $85,128 0 $0 5 $116,390 0 $0 APPLICATIONS DENIED 8 $205,570 47 $145,293 152 $160,892 28 $42,007 0 $0 13 $121,439 1 $24,610 APPLICATIONS WITHDRAWN 5 $197,312 34 $147,393 74 $162,103 3 $86,387 0 $0 2 $130,320 1 $69,260 FILES CLOSED FOR INCOMPLETENESS 0 $0 8 $163,900 21 $190,063 0 $0 0 $0 0 $0 0 $0
Aggregated Statistics For Year 2005(Based on 2 partial tracts) A) FHA, FSA/RHS & VA B) Conventional C) Refinancings D) Home Improvement Loans F) Non-occupant Loans on G) Loans On Manufactured Number Average Value Number Average Value Number Average Value Number Average Value Number Average Value Number Average Value
LOANS ORIGINATED 38 $182,456 254 $141,545 222 $146,651 28 $39,080 27 $114,362 1 $37,440 APPLICATIONS APPROVED, NOT ACCEPTED 2 $212,175 42 $143,164 44 $146,032 4 $24,412 1 $128,410 0 $0 APPLICATIONS DENIED 4 $176,402 54 $140,837 151 $159,615 23 $38,395 7 $101,996 1 $21,640 APPLICATIONS WITHDRAWN 5 $176,396 32 $161,802 88 $167,410 13 $139,068 3 $170,420 0 $0 FILES CLOSED FOR INCOMPLETENESS 0 $0 8 $143,394 24 $157,569 2 $27,000 0 $0 0 $0
Aggregated Statistics For Year 2004(Based on 2 partial tracts) A) FHA, FSA/RHS & VA B) Conventional C) Refinancings D) Home Improvement Loans F) Non-occupant Loans on G) Loans On Manufactured Number Average Value Number Average Value Number Average Value Number Average Value Number Average Value Number Average Value
LOANS ORIGINATED 42 $177,812 249 $141,498 273 $143,639 25 $64,717 18 $120,261 0 $0 APPLICATIONS APPROVED, NOT ACCEPTED 9 $169,522 35 $157,355 45 $157,838 7 $26,586 2 $157,700 0 $0 APPLICATIONS DENIED 7 $184,943 33 $164,359 146 $149,979 20 $30,956 5 $112,716 1 $15,670 APPLICATIONS WITHDRAWN 6 $192,380 31 $161,266 78 $164,062 7 $44,779 3 $231,263 0 $0 FILES CLOSED FOR INCOMPLETENESS 1 $94,800 8 $165,098 28 $174,979 1 $46,760 2 $106,260 0 $0
Aggregated Statistics For Year 2003(Based on 2 partial tracts) A) FHA, FSA/RHS & VA B) Conventional C) Refinancings D) Home Improvement Loans F) Non-occupant Loans on Number Average Value Number Average Value Number Average Value Number Average Value Number Average Value
LOANS ORIGINATED 90 $177,167 187 $159,019 667 $133,009 17 $18,511 25 $123,482 APPLICATIONS APPROVED, NOT ACCEPTED 6 $196,712 19 $166,209 94 $135,075 5 $49,488 2 $109,940 APPLICATIONS DENIED 9 $173,410 24 $159,477 151 $135,434 16 $20,744 6 $146,600 APPLICATIONS WITHDRAWN 8 $181,895 23 $179,635 87 $144,396 7 $42,856 1 $294,330 FILES CLOSED FOR INCOMPLETENESS 1 $111,750 6 $147,007 32 $155,582 0 $0 0 $0
Aggregated Statistics For Year 2002(Based on 1 partial tract) A) FHA, FSA/RHS & VA B) Conventional C) Refinancings D) Home Improvement Loans F) Non-occupant Loans on Number Average Value Number Average Value Number Average Value Number Average Value Number Average Value
LOANS ORIGINATED 86 $173,253 149 $158,738 422 $139,383 10 $28,130 10 $91,988 APPLICATIONS APPROVED, NOT ACCEPTED 3 $179,470 16 $221,242 48 $134,828 5 $19,148 1 $69,090 APPLICATIONS DENIED 7 $188,236 13 $162,589 87 $131,231 8 $14,559 0 $0 APPLICATIONS WITHDRAWN 11 $181,967 9 $160,168 54 $142,420 1 $85,380 0 $0 FILES CLOSED FOR INCOMPLETENESS 0 $0 1 $285,240 21 $148,967 0 $0 0 $0
Aggregated Statistics For Year 2001(Based on 1 partial tract) A) FHA, FSA/RHS & VA B) Conventional C) Refinancings D) Home Improvement Loans F) Non-occupant Loans on Number Average Value Number Average Value Number Average Value Number Average Value Number Average Value
LOANS ORIGINATED 65 $162,809 149 $141,840 346 $131,777 27 $22,975 9 $93,491 APPLICATIONS APPROVED, NOT ACCEPTED 3 $191,477 15 $128,837 54 $108,268 10 $24,576 1 $53,300 APPLICATIONS DENIED 3 $172,397 18 $131,161 98 $107,492 14 $15,264 2 $105,610 APPLICATIONS WITHDRAWN 6 $171,080 15 $162,756 49 $130,475 3 $38,987 1 $112,020 FILES CLOSED FOR INCOMPLETENESS 0 $0 3 $128,803 16 $136,514 0 $0 0 $0
Aggregated Statistics For Year 2000(Based on 1 partial tract) A) FHA, FSA/RHS & VA B) Conventional C) Refinancings D) Home Improvement Loans F) Non-occupant Loans on Number Average Value Number Average Value Number Average Value Number Average Value Number Average Value
LOANS ORIGINATED 73 $146,225 154 $144,009 84 $104,552 28 $20,991 6 $114,657 APPLICATIONS APPROVED, NOT ACCEPTED 3 $137,193 18 $143,033 15 $97,253 9 $12,502 1 $33,060 APPLICATIONS DENIED 7 $153,831 15 $145,385 59 $101,962 16 $17,057 1 $83,400 APPLICATIONS WITHDRAWN 6 $162,443 12 $151,710 22 $94,528 0 $0 1 $324,230 FILES CLOSED FOR INCOMPLETENESS 0 $0 3 $136,700 7 $90,170 1 $33,060 0 $0
Aggregated Statistics For Year 1999(Based on 1 partial tract) A) FHA, FSA/RHS & VA B) Conventional C) Refinancings D) Home Improvement Loans F) Non-occupant Loans on Number Average Value Number Average Value Number Average Value Number Average Value Number Average Value
LOANS ORIGINATED 24 $133,811 69 $144,168 82 $108,617 16 $18,199 4 $95,638 APPLICATIONS APPROVED, NOT ACCEPTED 0 $0 3 $92,493 19 $108,339 3 $15,490 0 $0 APPLICATIONS DENIED 2 $164,785 8 $119,799 29 $102,488 9 $8,906 0 $0 APPLICATIONS WITHDRAWN 2 $135,935 5 $112,070 17 $97,658 1 $17,960 0 $0 FILES CLOSED FOR INCOMPLETENESS 0 $0 1 $119,430 5 $98,556 0 $0 0 $0
Detailed HMDA statistics for the following Tracts:
0306.00
, 0327.00
Private Mortgage Insurance Companies Aggregated Statistics For Year 2009(Based on 2 partial tracts) A) Conventional B) Refinancings Number Average Value Number Average Value
LOANS ORIGINATED 14 $172,384 15 $165,603 APPLICATIONS APPROVED, NOT ACCEPTED 5 $151,326 2 $177,150 APPLICATIONS DENIED 4 $147,812 2 $198,320 APPLICATIONS WITHDRAWN 1 $184,080 2 $113,395 FILES CLOSED FOR INCOMPLETENESS 0 $0 0 $0
Aggregated Statistics For Year 2008(Based on 2 partial tracts) A) Conventional B) Refinancings C) Non-occupant Loans on Number Average Value Number Average Value Number Average Value
LOANS ORIGINATED 36 $167,461 13 $208,665 5 $159,236 APPLICATIONS APPROVED, NOT ACCEPTED 13 $152,485 14 $199,357 2 $141,360 APPLICATIONS DENIED 1 $219,320 2 $177,985 0 $0 APPLICATIONS WITHDRAWN 1 $158,910 1 $127,160 0 $0 FILES CLOSED FOR INCOMPLETENESS 1 $240,330 0 $0 0 $0
Aggregated Statistics For Year 2007(Based on 2 partial tracts) A) Conventional B) Refinancings C) Non-occupant Loans on Number Average Value Number Average Value Number Average Value
LOANS ORIGINATED 64 $175,389 20 $169,103 4 $162,962 APPLICATIONS APPROVED, NOT ACCEPTED 6 $161,452 8 $187,644 1 $243,300 APPLICATIONS DENIED 3 $237,617 1 $211,710 0 $0 APPLICATIONS WITHDRAWN 4 $140,272 2 $202,310 0 $0 FILES CLOSED FOR INCOMPLETENESS 0 $0 0 $0 0 $0
Aggregated Statistics For Year 2006(Based on 2 partial tracts) A) Conventional B) Refinancings C) Non-occupant Loans on Number Average Value Number Average Value Number Average Value
LOANS ORIGINATED 46 $192,612 14 $179,693 3 $186,147 APPLICATIONS APPROVED, NOT ACCEPTED 5 $169,850 8 $200,922 0 $0 APPLICATIONS DENIED 0 $0 1 $256,930 0 $0 APPLICATIONS WITHDRAWN 0 $0 1 $97,750 0 $0 FILES CLOSED FOR INCOMPLETENESS 0 $0 0 $0 0 $0
Aggregated Statistics For Year 2005(Based on 2 partial tracts) A) Conventional B) Refinancings C) Non-occupant Loans on Number Average Value Number Average Value Number Average Value
LOANS ORIGINATED 36 $173,063 23 $177,803 3 $112,393 APPLICATIONS APPROVED, NOT ACCEPTED 5 $191,544 11 $209,890 1 $150,520 APPLICATIONS DENIED 0 $0 0 $0 0 $0 APPLICATIONS WITHDRAWN 1 $258,100 0 $0 0 $0 FILES CLOSED FOR INCOMPLETENESS 0 $0 0 $0 0 $0
Aggregated Statistics For Year 2004(Based on 2 partial tracts) A) Conventional B) Refinancings C) Non-occupant Loans on Number Average Value Number Average Value Number Average Value
LOANS ORIGINATED 39 $185,705 36 $165,404 2 $175,230 APPLICATIONS APPROVED, NOT ACCEPTED 5 $190,370 12 $161,912 1 $82,960 APPLICATIONS DENIED 1 $131,390 0 $0 0 $0 APPLICATIONS WITHDRAWN 2 $182,625 3 $141,787 0 $0 FILES CLOSED FOR INCOMPLETENESS 0 $0 0 $0 0 $0
Aggregated Statistics For Year 2003(Based on 2 partial tracts) A) Conventional B) Refinancings C) Non-occupant Loans on Number Average Value Number Average Value Number Average Value
LOANS ORIGINATED 51 $185,472 85 $163,521 1 $227,950 APPLICATIONS APPROVED, NOT ACCEPTED 5 $195,850 31 $161,753 1 $35,370 APPLICATIONS DENIED 0 $0 2 $147,655 0 $0 APPLICATIONS WITHDRAWN 2 $153,085 7 $178,997 1 $131,460 FILES CLOSED FOR INCOMPLETENESS 0 $0 1 $149,260 0 $0
Aggregated Statistics For Year 2002(Based on 1 partial tract) A) Conventional B) Refinancings Number Average Value Number Average Value
LOANS ORIGINATED 45 $181,751 49 $169,653 APPLICATIONS APPROVED, NOT ACCEPTED 5 $169,962 13 $162,589 APPLICATIONS DENIED 0 $0 0 $0 APPLICATIONS WITHDRAWN 2 $298,320 3 $183,583 FILES CLOSED FOR INCOMPLETENESS 0 $0 0 $0
Aggregated Statistics For Year 2001(Based on 1 partial tract) A) Conventional B) Refinancings C) Non-occupant Loans on Number Average Value Number Average Value Number Average Value
LOANS ORIGINATED 44 $163,752 54 $153,405 0 $0 APPLICATIONS APPROVED, NOT ACCEPTED 7 $173,289 9 $163,239 1 $170,750 APPLICATIONS DENIED 0 $0 1 $164,340 0 $0 APPLICATIONS WITHDRAWN 2 $193,450 3 $173,220 0 $0 FILES CLOSED FOR INCOMPLETENESS 0 $0 0 $0 0 $0
Aggregated Statistics For Year 2000(Based on 1 partial tract) A) Conventional B) Refinancings C) Non-occupant Loans on Number Average Value Number Average Value Number Average Value
LOANS ORIGINATED 57 $163,885 6 $141,882 2 $148,050 APPLICATIONS APPROVED, NOT ACCEPTED 4 $189,258 2 $127,815 0 $0 APPLICATIONS DENIED 2 $179,880 0 $0 0 $0 APPLICATIONS WITHDRAWN 1 $258,100 0 $0 0 $0 FILES CLOSED FOR INCOMPLETENESS 0 $0 0 $0 0 $0
Aggregated Statistics For Year 1999(Based on 1 partial tract) A) Conventional B) Refinancings Number Average Value Number Average Value
LOANS ORIGINATED 27 $144,570 14 $132,776 APPLICATIONS APPROVED, NOT ACCEPTED 3 $149,217 3 $111,577 APPLICATIONS DENIED 1 $86,880 1 $86,430 APPLICATIONS WITHDRAWN 0 $0 0 $0 FILES CLOSED FOR INCOMPLETENESS 0 $0 0 $0
Detailed PMIC statistics for the following Tracts:
0306.00
, 0327.00 Fire-safe hotels and motels in Pickerington, Ohio:
Hampton Inn Columbus East, 1890 Winderly Ln, Pickerington, Ohio 43147 Phone: (614) 864-8383, Fax: (614) 864-4884
Holiday Innexpress And Suites, 13300 Reynoldsburg Baltimore, Pickerington, Ohio 43147 Phone: (614) 575-9900, Fax: (614) 575-9909
Comfort Inn Pickerington, 1800 Hl Road N, Pickerington, Ohio 43147 Phone: (614) 575-9900, Fax: (614) 575-9909
Best Western Executive Suites Columbus East, 1899 Winderly Ln, Pickerington, Ohio 43147 Phone: (614) 860-9804, Fax: (614) 864-9002
All 4 fire-safe hotels and motels in Pickerington, Ohio
Most common first names in Pickerington, OH among deceased individuals Name Count Lived (average)
Mary 86 80.4 years Robert 70 69.9 years William 59 73.1 years John 48 76.7 years James 43 72.9 years Helen 43 84.3 years Charles 35 73.7 years Dorothy 34 81.6 years Ruth 30 81.7 years Richard 29 69.1 years
Most common last names in Pickerington, OH among deceased individuals Last name Count Lived (average)
Smith 31 80.3 years Jones 19 70.8 years Phillips 16 77.2 years Miller 15 72.9 years Weaver 14 85.3 years Brown 13 81.8 years Moore 13 75.5 years Johnson 11 80.5 years Davis 10 76.8 years Lewis 10 80.7 years
Pickerington compared to Ohio state average:
Median household income above state average. Median house value above state average. Unemployed percentage significantly below state average. Black race population percentage significantly above state average. Median age below state average. Foreign-born population percentage significantly above state average. Number of rooms per house above state average. House age significantly below state average. Percentage of population with a bachelor's degree or higher significantly above state average. Pickerington on our top lists :
#55 on the list of "Top 101 cities with largest percentage of females in industries: management of companies and enterprises (population 5,000+)"
#70 on the list of "Top 100 high-educated but low-earning cities (pop. 5,000+)"
#19 on the list of "Top 101 counties with the lowest percentage of residents relocating to foreign countries in 2011"
Top Patent Applicants
Anthony L. Rockwell (24)
Mark E. Koenig (19)
Brian C Auman (17)
Christopher Dennis Simone (15)
Leonard J. Adzima (13)
Jay F. Perkins (8)
Jacob Chacko (6)
Christopher Paul Weil (5)
Keith A. Garleb (4)
Greg Haggy (4)
Total of 227 patent applications in 2008-2024.
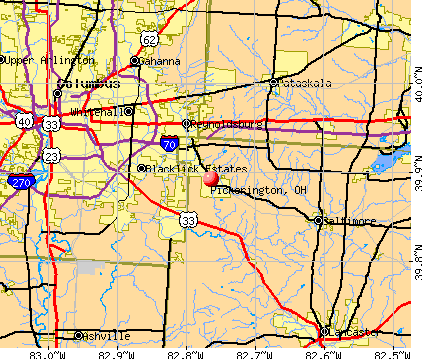


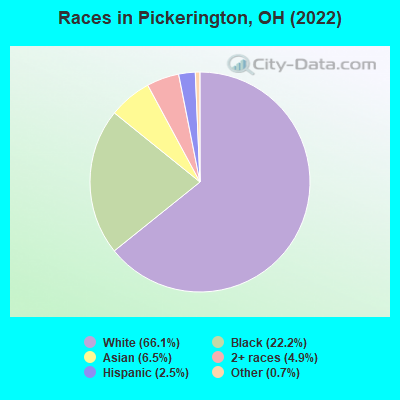
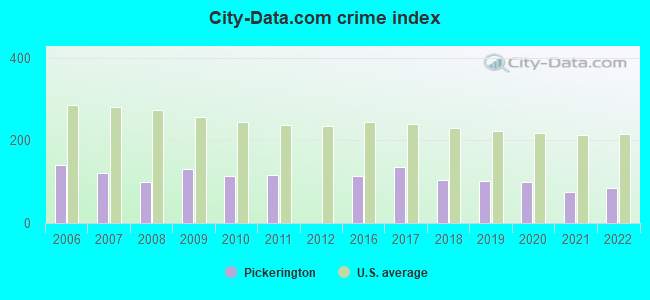
 Recent articles from our blog. Our writers, many of them Ph.D. graduates or candidates, create easy-to-read articles on a wide variety of topics.

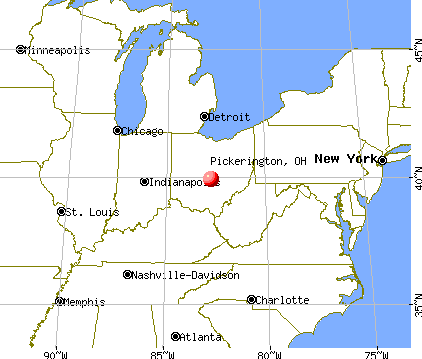
 (13.8 miles
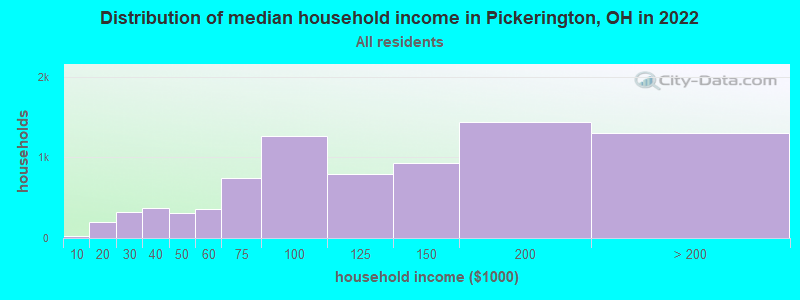
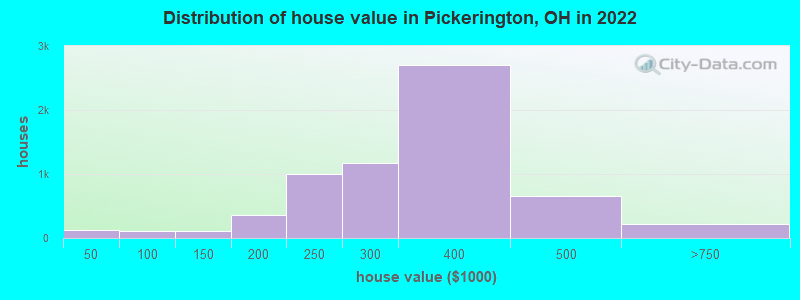
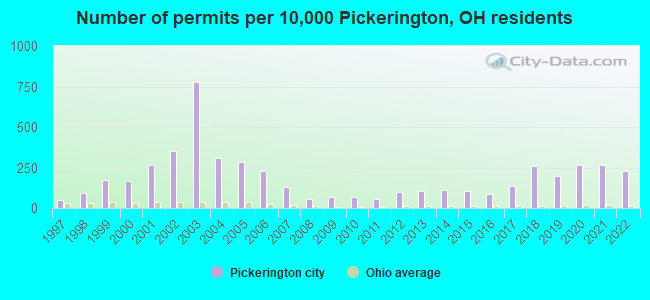
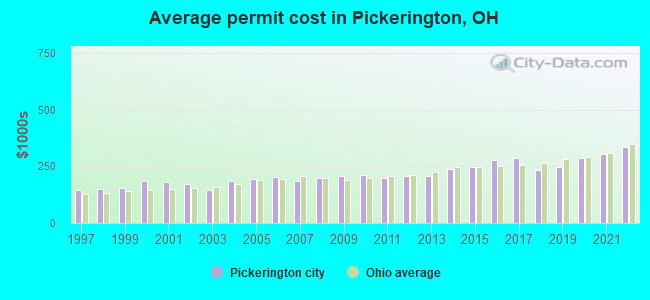
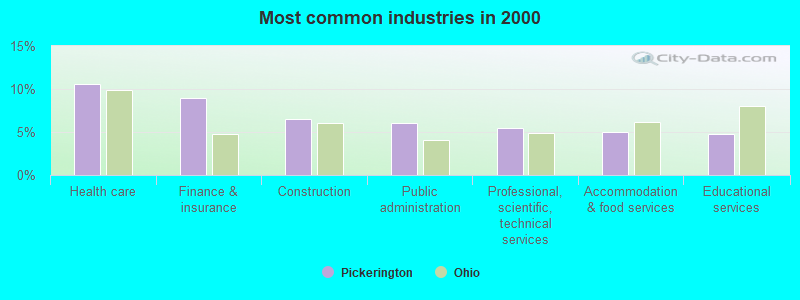
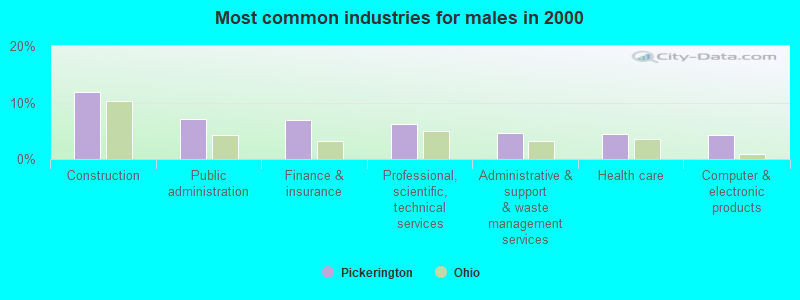
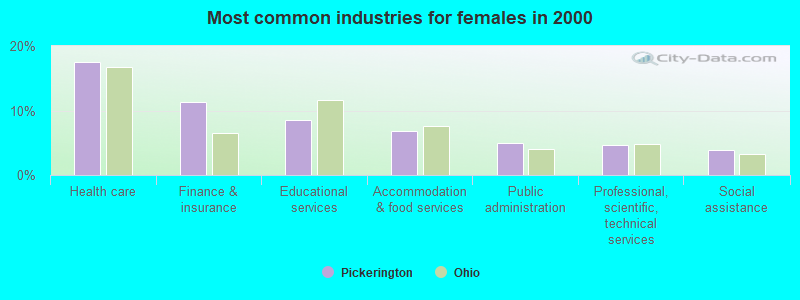
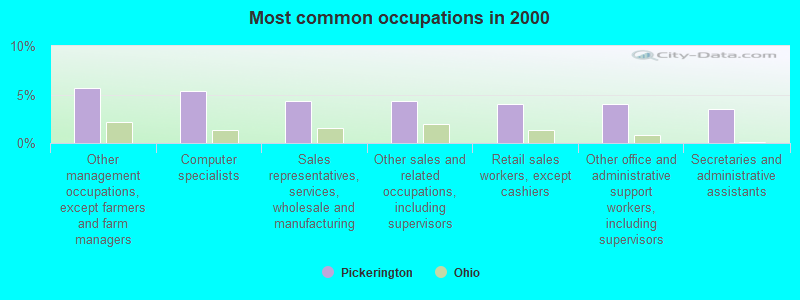
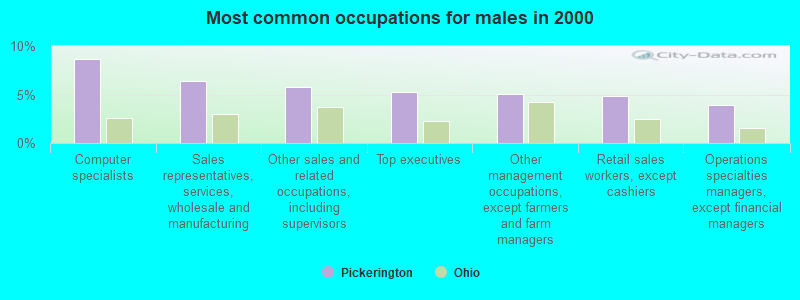
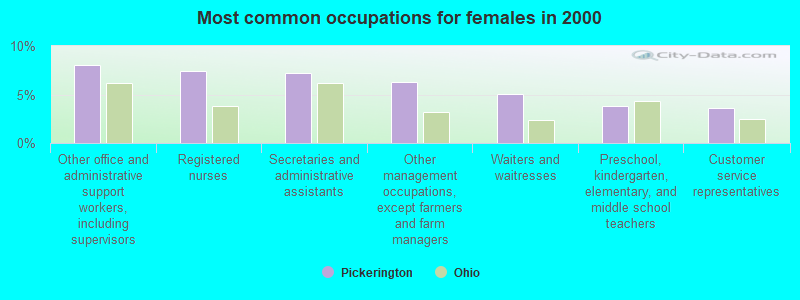
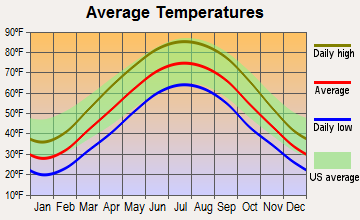
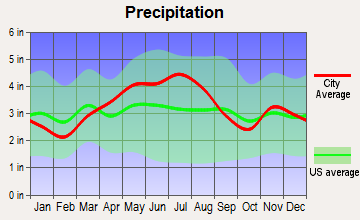
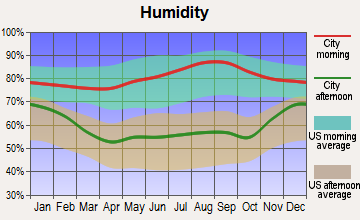
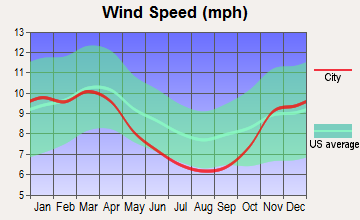
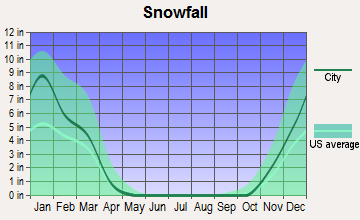
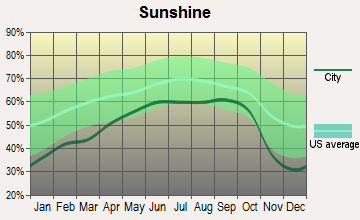
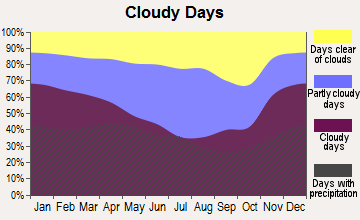
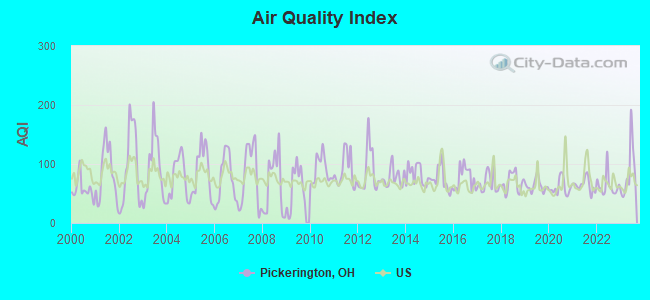
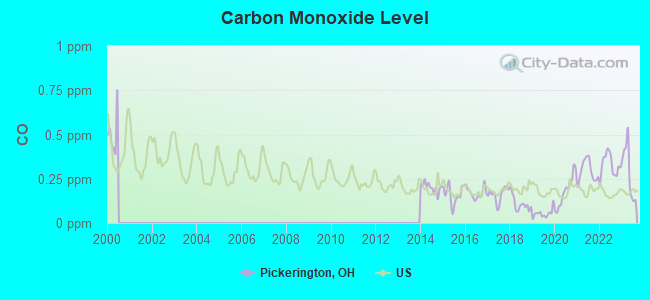
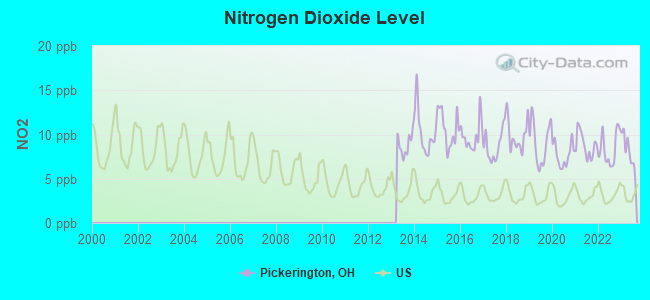
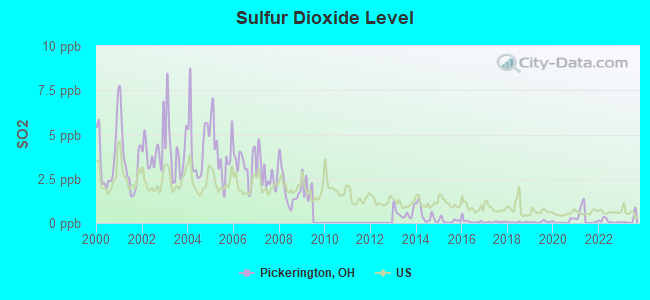
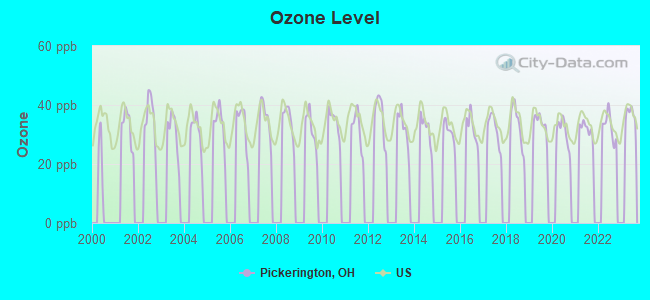
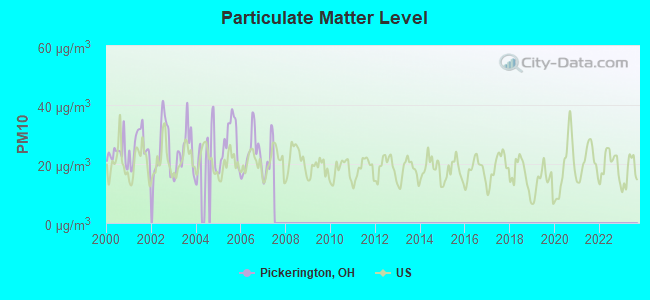
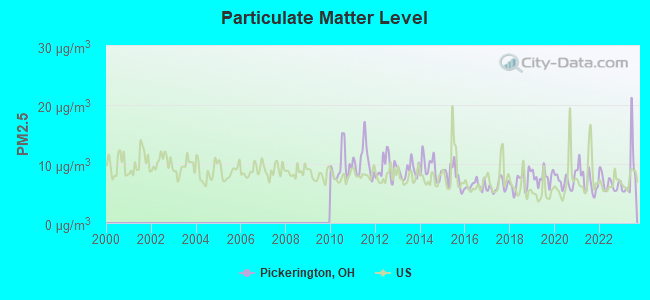

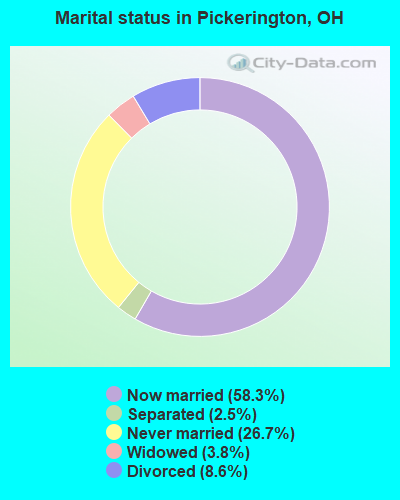
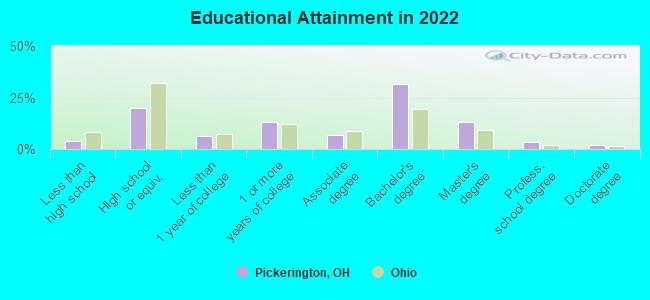
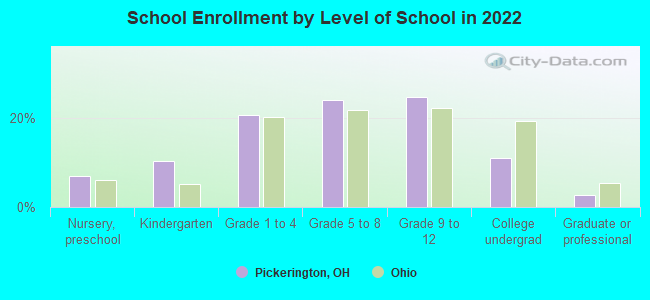
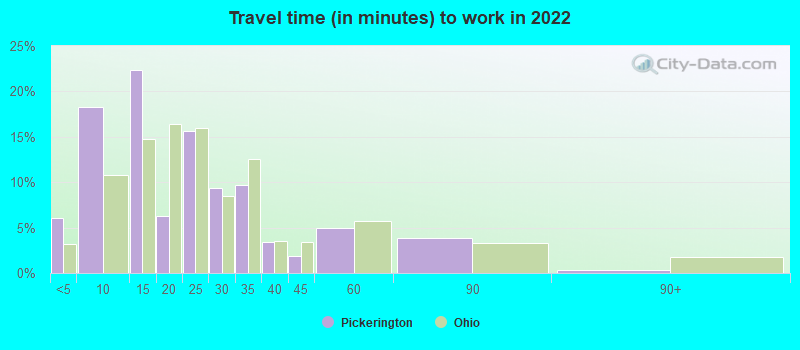
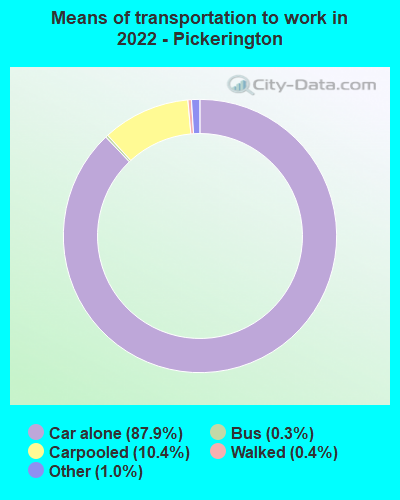
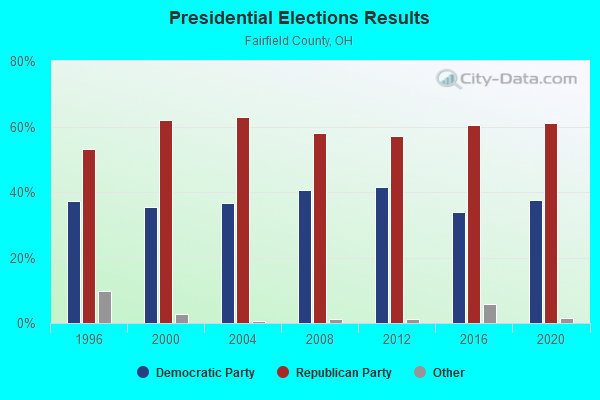
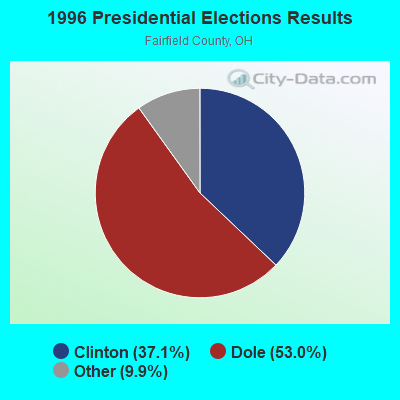
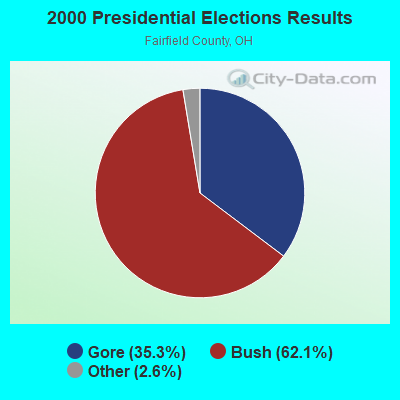
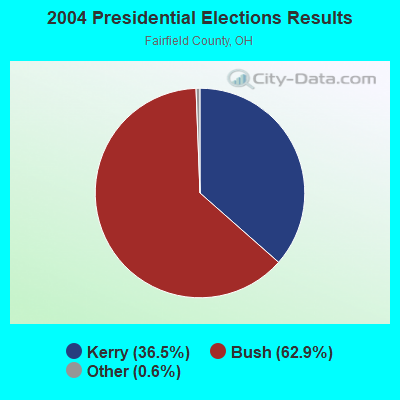
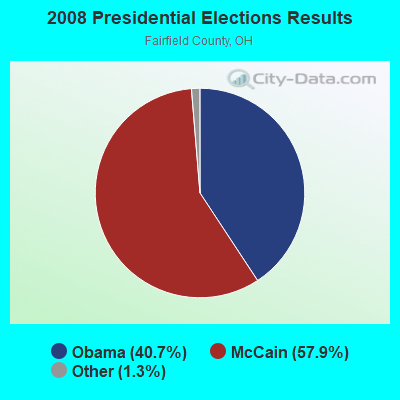
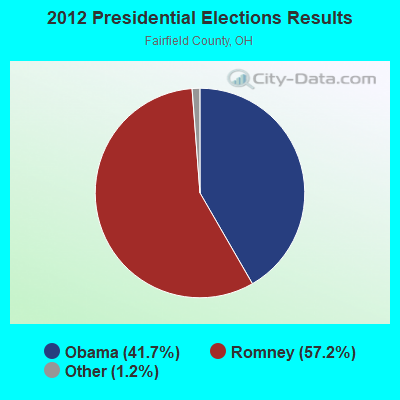
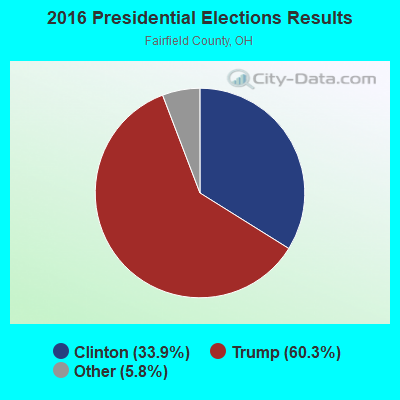
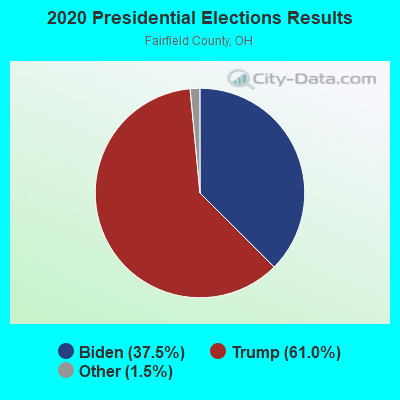
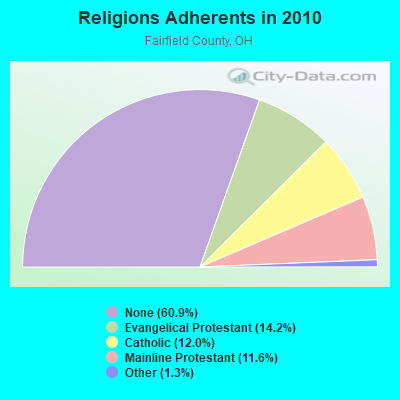
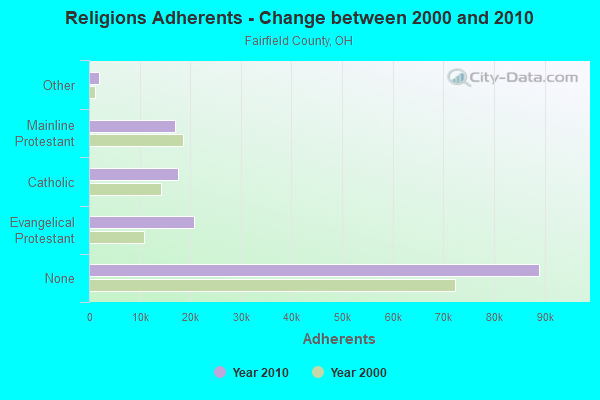
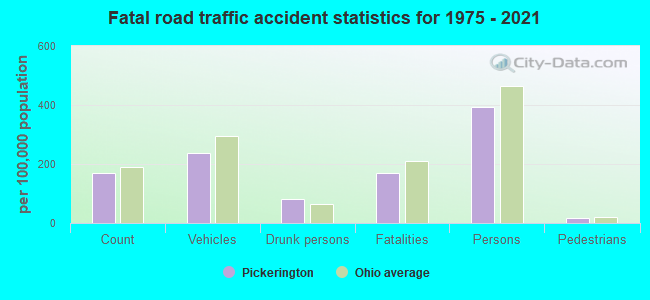
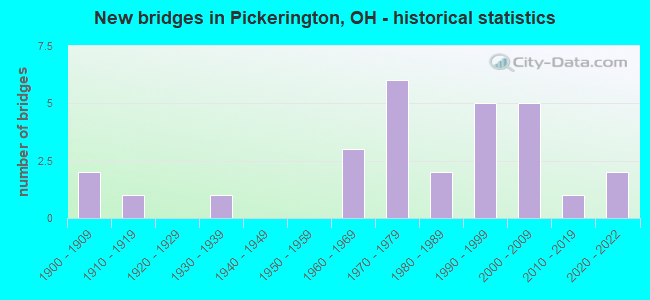
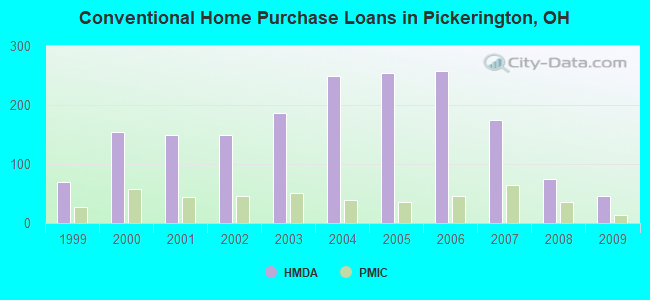
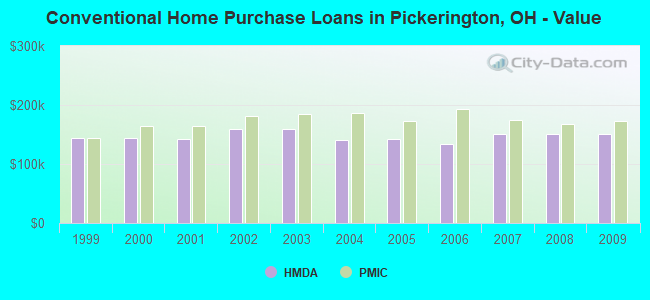
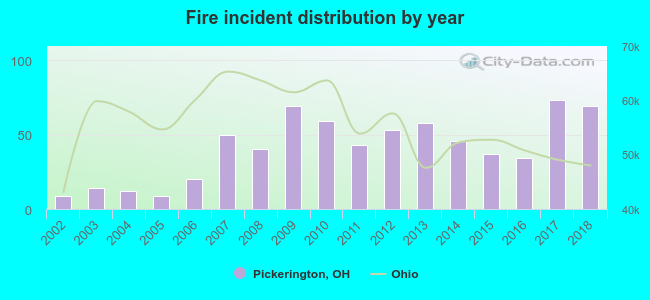 According to the data from the years 2002 - 2018 the average number of fires per year is 41. The highest number of reported fires - 73 took place in 2017, and the least - 9 in 2002. The data has a growing trend.
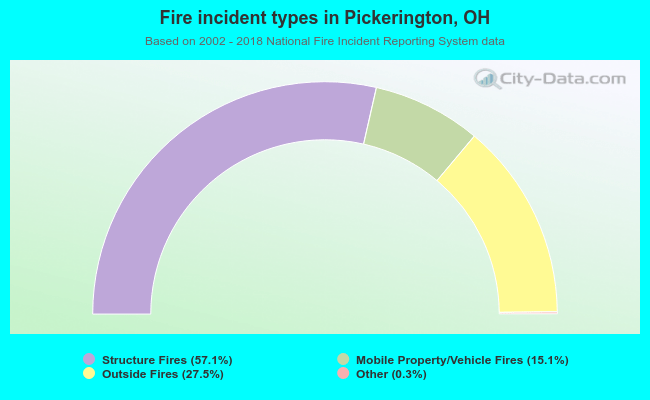 When looking into fire subcategories, the most incidents belonged to: Structure Fires (57.1%), and Outside Fires (27.5%).