Estimated zip code population in 2022: 29,308 Zip code population in 2010: 24,989 Zip code population in 2000: 24,114
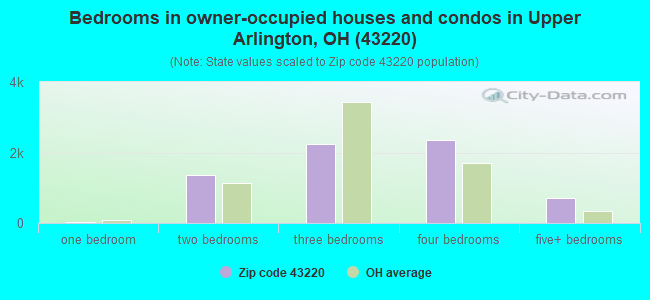
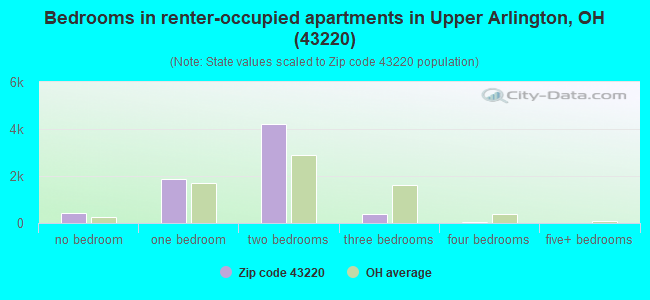
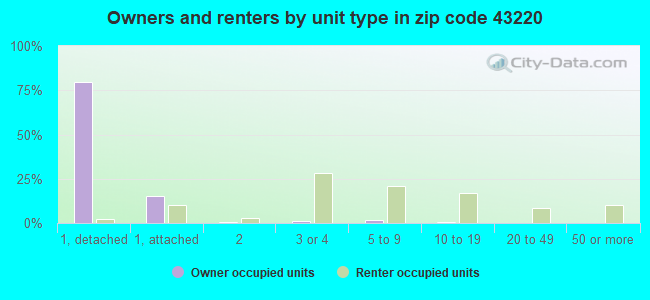
Houses and condos: 14,098 Renter-occupied apartments: 6,846
% of renters here:
51%
State:
33%
March 2022 cost of living index in zip code 43220: 98.5 (near average, U.S. average is 100)
Land area: 6.8 sq. mi. Water area: 0.1 sq. mi.
Population density: 4,309 people per square mile
(average).
OSM Map
General Map
Google Map
MSN Map
OSM Map
General Map
Google Map
MSN Map
OSM Map
General Map
Google Map
MSN Map
OSM Map
General Map
Google Map
MSN Map
Please wait while loading the map...
Real estate property taxes paid for housing units in 2022:
This zip code:
1.6% ($7,765)
Ohio:
1.3% ($2,639)
Median real estate property taxes paid for housing units with mortgages in 2022: $7,961 (1.5%) Median real estate property taxes paid for housing units with no mortgage in 2022: $7,448 (1.7%)
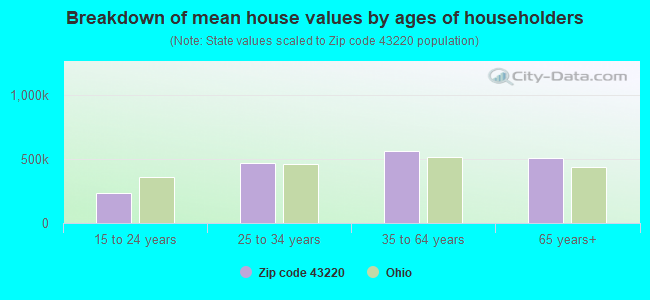
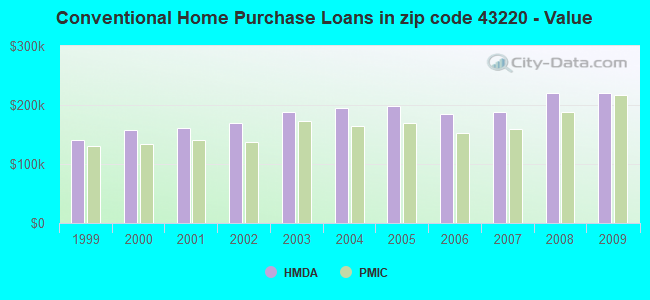
Estimated median house/condo value in 2022: $494,717
43220:
$494,717
Ohio:
$204,100
According to our research of Ohio and other state lists, there were 12 registered sex offenders living in 43220 zip code as of April 27, 2024. The ratio of all residents to sex offenders in zip code 43220 is 2,282 to 1. The ratio of registered sex offenders to all residents in this zip code is much lower than the state average.
Median resident age:
This zip code:
36.4 years
Ohio median age:
39.9 years
Average household size:
This zip code:
2.1 people
Ohio:
2.4 people
Averages for the 2020 tax year for zip code 43220, filed in 2021:
Average Adjusted Gross Income (AGI) in 2020: $113,802 (Individual Income Tax Returns)
Here:
$113,802
State:
$67,288
Salary/wage: $80,832 (reported on 81.2% of returns)
Here:
$80,832
State:
$55,628
(% of AGI for various income ranges: 1309.7% for AGIs below $25k, 3855.3% for AGIs $25k-50k, 6608.9% for AGIs $50k-75k, 9705.1% for AGIs $75k-100k, 18912.9% for AGIs $100k-200k, 98986.0% for AGIs over 200k)
Taxable interest for individuals: $3,297 (reported on 38.3% of returns)
This zip code:
$3,297
Ohio:
$1,518
(% of AGI for various income ranges: 18.3% for AGIs below $25k, 24.1% for AGIs $25k-50k, 41.2% for AGIs $50k-75k, 84.8% for AGIs $75k-100k, 213.9% for AGIs $100k-200k, 3070.0% for AGIs over 200k)
Ordinary dividends: $14,971 (reported on 34.2% of returns)
Here:
$14,971
State:
$7,167
(% of AGI for various income ranges: 52.3% for AGIs below $25k, 70.5% for AGIs $25k-50k, 155.5% for AGIs $50k-75k, 345.1% for AGIs $75k-100k, 1102.2% for AGIs $100k-200k, 12182.0% for AGIs over 200k)
Net capital gain/loss in AGI: +$40,518 (reported on 31.4% of returns)
Here:
+$40,518
State:
+$18,919
(% of AGI for various income ranges: 19.5% for AGIs below $25k, 54.8% for AGIs $25k-50k, 129.2% for AGIs $50k-75k, 299.5% for AGIs $75k-100k, 1277.3% for AGIs $100k-200k, 37178.0% for AGIs over 200k)
Profit/loss from business: +$21,850 (reported on 17.9% of returns)
Here:
+$21,850
State:
+$13,744
(% of AGI for various income ranges: 140.2% for AGIs below $25k, 166.0% for AGIs $25k-50k, 239.0% for AGIs $50k-75k, 476.6% for AGIs $75k-100k, 1075.9% for AGIs $100k-200k, 6732.7% for AGIs over 200k)
Taxable individual retirement arrangement distribution: $26,135 (reported on 11.1% of returns)
43220:
$26,135
Ohio:
$18,876
(% of AGI for various income ranges: 57.6% for AGIs below $25k, 106.7% for AGIs $25k-50k, 218.7% for AGIs $50k-75k, 565.0% for AGIs $75k-100k, 1213.1% for AGIs $100k-200k, 3722.0% for AGIs over 200k)
Self-employed (Keogh) retirement plans: $26,362 (reported on 1.8% of returns)
43220:
$26,362
Ohio:
$24,898
(% of AGI for various income ranges: 8.5% for AGIs $25k-50k, 76.5% for AGIs $100k-200k, 1276.2% for AGIs over 200k)
Total itemized deductions: $50,351 (reported on 12.2% of returns)
Here:
$50,351
State:
$33,869
(% of AGI for various income ranges: 53.2% for AGIs below $25k, 99.1% for AGIs $25k-50k, 266.5% for AGIs $50k-75k, 590.1% for AGIs $75k-100k, 1366.0% for AGIs $100k-200k, 13925.1% for AGIs over 200k)
Charity contributions: $30,219 (reported on 10.5% of returns)
Here:
$30,219
State:
$14,577
(% of AGI for various income ranges: 4.2% for AGIs below $25k, 11.3% for AGIs $25k-50k, 39.9% for AGIs $50k-75k, 108.7% for AGIs $75k-100k, 304.3% for AGIs $100k-200k, 9275.8% for AGIs over 200k)
Taxes paid: $8,859 (reported on 12.1% of returns)
43220:
$8,859
State:
$7,681
(% of AGI for various income ranges: 11.2% for AGIs below $25k, 24.8% for AGIs $25k-50k, 79.9% for AGIs $50k-75k, 189.9% for AGIs $75k-100k, 408.9% for AGIs $100k-200k, 1682.0% for AGIs over 200k)
Earned income credit: $1,921 (reported on 9.0% of returns)
Here:
$1,921
State:
$2,304
(% of AGI for various income ranges: 61.0% for AGIs below $25k, 36.5% for AGIs $25k-50k)
Percentage of individuals using paid preparers for their 2020 taxes: 92.6%
Here:
93%
State:
94%
(% for various income ranges: 91.6% for AGIs below $25k, 93.8% for AGIs $25k-50k, 92.2% for AGIs $50k-75k, 92.4% for AGIs $75k-100k, 92.1% for AGIs $100k-200k, 93.7% for AGIs over 200k)
Averages for the 2012 tax year for zip code 43220, filed in 2013:
Average Adjusted Gross Income (AGI) in 2012: $93,474 (Individual Income Tax Returns)
Here:
$93,474
State:
$54,926
Salary/wage: $65,849 (reported on 81.8% of returns)
Here:
$65,849
State:
$45,869
(% of AGI for various income ranges: 80.1% for AGIs below $25k, 80.9% for AGIs $25k-50k, 71.5% for AGIs $50k-75k, 67.2% for AGIs $75k-100k, 65.9% for AGIs $100k-200k, 43.7% for AGIs over 200k)
Taxable interest for individuals: $2,905 (reported on 43.6% of returns)
This zip code:
$2,905
Ohio:
$1,297
(% of AGI for various income ranges: 1.4% for AGIs below $25k, 0.8% for AGIs $25k-50k, 0.7% for AGIs $50k-75k, 1.2% for AGIs $75k-100k, 1.0% for AGIs $100k-200k, 1.8% for AGIs over 200k)
Ordinary dividends: $12,549 (reported on 34.7% of returns)
Here:
$12,549
State:
$5,821
(% of AGI for various income ranges: 3.5% for AGIs below $25k, 1.7% for AGIs $25k-50k, 2.6% for AGIs $50k-75k, 3.1% for AGIs $75k-100k, 3.5% for AGIs $100k-200k, 6.5% for AGIs over 200k)
Net capital gain/loss in AGI: +$28,431 (reported on 28.5% of returns)
Here:
+$28,431
State:
+$11,232
(% of AGI for various income ranges: 0.8% for AGIs $25k-50k, 0.9% for AGIs $50k-75k, 1.3% for AGIs $75k-100k, 2.2% for AGIs $100k-200k, 16.4% for AGIs over 200k)
Profit/loss from business: +$24,750 (reported on 16.3% of returns)
Here:
+$24,750
State:
+$12,773
(% of AGI for various income ranges: 5.9% for AGIs below $25k, 3.0% for AGIs $25k-50k, 3.8% for AGIs $50k-75k, 3.4% for AGIs $75k-100k, 4.5% for AGIs $100k-200k, 4.6% for AGIs over 200k)
Taxable individual retirement arrangement distribution: $24,850 (reported on 14.2% of returns)
43220:
$24,850
Ohio:
$14,511
(% of AGI for various income ranges: 3.7% for AGIs below $25k, 2.6% for AGIs $25k-50k, 3.4% for AGIs $50k-75k, 4.6% for AGIs $75k-100k, 4.9% for AGIs $100k-200k, 3.4% for AGIs over 200k)
Self-employment retirement plans: $22,076 (reported on 2.1% of returns)
43220:
$22,076
Ohio:
$20,257
(% of AGI for various income ranges: 0.2% for AGIs $25k-50k, 0.3% for AGIs $75k-100k, 0.4% for AGIs $100k-200k, 0.7% for AGIs over 200k)
Total itemized deductions: $31,601 (17% of AGI, reported on 41.6% of returns)
Here:
$31,601
State:
$21,278
Here:
17.5% of AGI
State:
18.8% of AGI
(% of AGI for various income ranges: 12.2% for AGIs below $25k, 8.2% for AGIs $25k-50k, 13.5% for AGIs $50k-75k, 16.4% for AGIs $75k-100k, 17.2% for AGIs $100k-200k, 13.6% for AGIs over 200k)
Charity contributions: $6,575 (reported on 36.1% of returns)
Here:
$6,575
State:
$3,943
(% of AGI for various income ranges: 0.8% for AGIs below $25k, 0.9% for AGIs $25k-50k, 1.5% for AGIs $50k-75k, 2.0% for AGIs $75k-100k, 2.4% for AGIs $100k-200k, 3.3% for AGIs over 200k)
Taxes paid: $16,673 (reported on 41.5% of returns)
43220:
$16,673
State:
$9,568
(% of AGI for various income ranges: 3.7% for AGIs below $25k, 2.9% for AGIs $25k-50k, 5.6% for AGIs $50k-75k, 7.4% for AGIs $75k-100k, 9.3% for AGIs $100k-200k, 8.0% for AGIs over 200k)
Earned income credit: $1,673 (reported on 8.4% of returns)
Here:
$1,673
State:
$2,285
(% of AGI for various income ranges: 2.8% for AGIs below $25k, 0.4% for AGIs $25k-50k)
Percentage of individuals using paid preparers for their 2012 taxes: 47.7%
Here:
48%
State:
51%
(% for various income ranges: 40.0% for AGIs below $25k, 39.1% for AGIs $25k-50k, 51.9% for AGIs $50k-75k, 53.3% for AGIs $75k-100k, 55.3% for AGIs $100k-200k, 75.7% for AGIs over 200k)
Averages for the 2004 tax year for zip code 43220, filed in 2005:
Average Adjusted Gross Income (AGI) in 2004: $73,191 (Individual Income Tax Returns)
Here:
$73,191
State:
$44,480
Salary/wage: $55,743 (reported on 79.2% of returns)
Here:
$55,743
State:
$39,198
(% of AGI for various income ranges: 134.9% for AGIs below $10k, 74.4% for AGIs $10k-25k, 76.5% for AGIs $25k-50k, 68.8% for AGIs $50k-75k, 67.1% for AGIs $75k-100k, 53.1% for AGIs over 100k)
Taxable interest for individuals: $3,028 (reported on 58.1% of returns)
This zip code:
$3,028
Ohio:
$1,532
(% of AGI for various income ranges: 9.7% for AGIs below $10k, 3.1% for AGIs $10k-25k, 2.3% for AGIs $25k-50k, 2.1% for AGIs $50k-75k, 2.0% for AGIs $75k-100k, 2.4% for AGIs over 100k)
Taxable dividends: $6,742 (reported on 42.5% of returns)
Here:
$6,742
State:
$3,496
(% of AGI for various income ranges: 10.2% for AGIs below $10k, 3.3% for AGIs $10k-25k, 2.6% for AGIs $25k-50k, 3.1% for AGIs $50k-75k, 2.9% for AGIs $75k-100k, 4.4% for AGIs over 100k)
Net capital gain/loss: +$13,156 (reported on 36.1% of returns)
Here:
+$13,156
State:
+$8,582
(% of AGI for various income ranges: 10.1% for AGIs below $10k, 1.3% for AGIs $10k-25k, 1.0% for AGIs $25k-50k, 1.6% for AGIs $50k-75k, 2.1% for AGIs $75k-100k, 9.3% for AGIs over 100k)
Profit/loss from business: +$23,306 (reported on 16.1% of returns)
Here:
+$23,306
State:
+$10,813
(% of AGI for various income ranges: 7.1% for AGIs below $10k, 5.2% for AGIs $10k-25k, 3.1% for AGIs $25k-50k, 3.0% for AGIs $50k-75k, 5.5% for AGIs $75k-100k, 5.8% for AGIs over 100k)
Profit/loss from farming: +$4,423 (reported on 0.2% of returns)
Here:
+$4,423
State:
-$3,706
IRA payment deduction: $3,039 (reported on 2.4% of returns)
43220:
$3,039
Ohio:
$2,794
(% of AGI for various income ranges: 0.8% for AGIs below $10k, 0.2% for AGIs $10k-25k, 0.2% for AGIs $25k-50k, 0.2% for AGIs $50k-75k, 0.1% for AGIs $75k-100k, 0.0% for AGIs over 100k)
Self-employed pension: $17,449 (reported on 2.5% of returns)
Here:
$17,449
Ohio:
$13,981
(% of AGI for various income ranges: 0.1% for AGIs $10k-25k, 0.1% for AGIs $25k-50k, 0.2% for AGIs $50k-75k, 0.4% for AGIs $75k-100k, 0.8% for AGIs over 100k)
Total itemized deductions: $26,366 (19% of AGI, reported on 43.9% of returns)
Here:
$26,366
State:
$17,503
Here:
19.3% of AGI
State:
20.8% of AGI
(% of AGI for various income ranges: 26.2% for AGIs below $10k, 11.1% for AGIs $10k-25k, 12.5% for AGIs $25k-50k, 17.0% for AGIs $50k-75k, 19.3% for AGIs $75k-100k, 15.9% for AGIs over 100k)
Charity contributions deductions: $4,868 (3% of AGI, reported on 39.2% of returns)
Here:
$4,868
State:
$3,087
Here:
3.3% of AGI
State:
3.4% of AGI
(% of AGI for various income ranges: 0.9% for AGIs below $10k, 1.1% for AGIs $10k-25k, 1.5% for AGIs $25k-50k, 2.3% for AGIs $50k-75k, 2.7% for AGIs $75k-100k, 3.0% for AGIs over 100k)
Total tax: $15,216 (reported on 81.8% of returns)
43220:
$15,216
State:
$6,781
(% of AGI for various income ranges: 4.1% for AGIs below $10k, 5.2% for AGIs $10k-25k, 8.7% for AGIs $25k-50k, 10.9% for AGIs $50k-75k, 11.5% for AGIs $75k-100k, 21.4% for AGIs over 100k)
Earned income credit: $1,225 (reported on 5.5% of returns)
Here:
$1,225
State:
$1,696
Percentage of individuals using paid preparers for their 2004 taxes: 48.6%
Here:
49%
State:
55%
(% for various income ranges: 42.5% for AGIs below $10k, 41.1% for AGIs $10k-25k, 43.8% for AGIs $25k-50k, 52.6% for AGIs $50k-75k, 53.2% for AGIs $75k-100k, 66.0% for AGIs over 100k)
Likely homosexual households (counted as self-reported same-sex unmarried-partner households)
Lesbian couples: 0.6% of all households
Gay men: 0.1% of all households
Household received Food Stamps/SNAP in the past 12 months: 788 Household did not receive Food Stamps/SNAP in the past 12 months: 12,748
Women who had a birth in the past 12 months: 413 (398 now married, 23 unmarried) Women who did not have a birth in the past 12 months: 6,475 (3,047 now married, 3,426 unmarried)
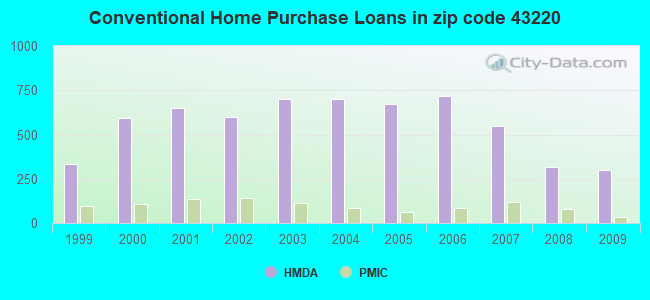
Housing units in zip code 43220 with a mortgage: 4,511 (657 second mortgage, 8 home equity loan, 636 both second mortgage and home equity loan) Houses without a mortgage: 151
Median monthly owner costs for units with a mortgage: $2,383 Median monthly owner costs for units without a mortgage: $1,009
Residents with income below the poverty level in 2022:
This zip code:
9.9%
Whole state:
13.4%
Residents with income below 50% of the poverty level in 2022:
This zip code:
5.4%
Whole state:
7.0%
Median number of rooms in houses and condos:
Here:
7.6
State:
6.7
Median number of rooms in apartments:
Here:
4.0
State:
4.4
Notable locations in this zip code not listed on our city pages
Notable locations in zip code 43220: Bethel Road Office Park (A), Upper Arlington Fire Division Station 72 (B), Upper Arlington Fire Division Station 73 (C). Display/hide their locations on the map
Shopping Centers: Greentree Centre Shopping Center (1), Northwest Shopping Center (2), Kenny Centre Shopping Center (3), Arlington Square Shopping Center (4), Carriage Place Shopping Center (5). Display/hide their locations on the map
Churches in zip code 43220 include: Saint Timothy Roman Catholic Church (A), Mountview Baptist Church (B), Northwest United Methodist Church (C), Upper Arlington Church of Christ (D), Upper Arlington Lutheran Church (E), Bethel United Methodist Church (F), Bethel Presbyterian Church (G), Atonement Lutheran Church (H), Advent Evangelical Lutheran Church (I). Display/hide their locations on the map
Parks in zip code 43220 include: Northcrest Park (1), Lane Road Park (2), Northwest Park (3), Bill Moose Memorial (4), Wyandotte Park (5), Wyandote Park (6), Langston Park (7), Reed Road Park (8). Display/hide their locations on the map
Tourist attractions (not listed on the city page) : AAA Travel Agency - Northwest (Tours & Charters; 4701 Reed Road), Great Ohio Bicycle Adventure (Tours & Charters; 1525 Bethel Road), Astro Tours (Tours & Charters; 4143 Reedbury Lane).
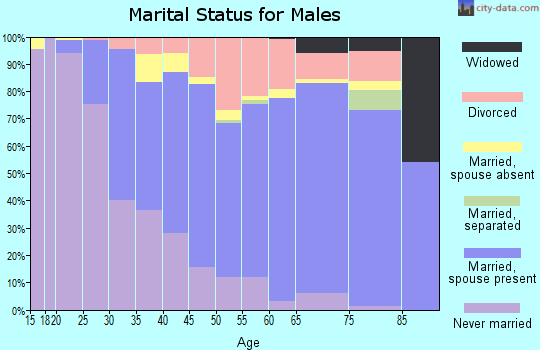
5,045 married couples with children.
1,058 single-parent households (297 men, 761 women).
83.0% of residents of 43220 zip code speak English at home.
3.9% of residents speak Spanish at home (81% very well, 11% well, 2% not well, 5% not at all).
4.5% of residents speak other Indo-European language at home (69% very well, 25% well, 6% not well).
6.6% of residents speak Asian or Pacific Island language at home (55% very well, 31% well, 9% not well, 5% not at all).
1.3% of residents speak other language at home (73% very well, 23% well, 3% not well).
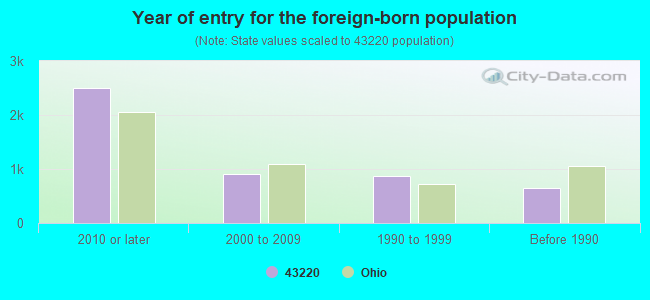
Foreign born population: 4,427 (15.1%) (41.3% of them are naturalized citizens)
Facilities with environmental interests located in this zip code:
ALBANY INTERNATIONAL CHEMICALS DIV (4692 KENNY RD in COLUMBUS, OH)
STATE MASTER (Ohio general info) - RCRA-OHD000721811, HAZARDOUS WASTE PROGRAM (Resource Conservation and Recovery Act (tracking hazardous waste)) Organizations: ALBANY INTERNATIONAL CORPORATION (CONTACT/OWNER)
BP OIL CO (1770 W HENDERSON RD in COLUMBUS, OH)
STATE MASTER (Ohio general info) - RCRA-OHD987012937, HAZARDOUS WASTE PROGRAM, -25-5541-168-47, EPCRA, -0125043084, AIR MAJOR Conditionally Exempt Small Quantity Generators, less than 100 kg/month of hazardous waste (Resource Conservation and Recovery Act (tracking hazardous waste)) - notification Business SIC classification: GASOLINE SERVICE STATIONS Organizations: BP OIL COMPANY (CONTACT/OWNER)
BP OIL CO NO 08184 (1927 W HENDERSON RD in COLUMBUS, OH)
STATE MASTER (Ohio general info) - PCS-OH0120952, National Pollutant Discharge Elimination System Permit, AIR MAJOR, -25-5541-168-43, EPCRA Conditionally Exempt Small Quantity Generators, less than 100 kg/month of hazardous waste (Resource Conservation and Recovery Act (tracking hazardous waste)) - notification Organizations: BP OIL COMPANY (CONTACT/OWNER)
Alternative names: BP OIL CO SITE 08184
CENTENNIAL HIGH SCHOOL (1441 BETHEL RD in COLUMBUS, OH)
(Geographic Names Information System) (National Center for Education Statistics) - STATE ID-068536 Organizations: COLUMBUS CITY SD (SCHOOL DISTRICT)
CHARTERS CLEANERS (4519 KENNY RD in COLUMBUS, OH)
(Resource Conservation and Recovery Act (tracking hazardous waste)) Organizations: BURNS DON AND BARBARA (CONTACT/OWNER)
BP OIL CO (1123 W HENDERSON RD in COLUMBUS, OH)
(Resource Conservation and Recovery Act (tracking hazardous waste)) Organizations: BP OIL COMPANY (CONTACT/OWNER)
BP FACILITY #22307 (2827 BETHEL RD in COLUMBUS, OH)
Small Quantity Generators, between 100 kg and 1000 kg of hazardous waste/month (Resource Conservation and Recovery Act (tracking hazardous waste)) Organizations: BP PRODUCTS NORTH AMERICA INC (CONTACT/OPERATOR)
Housing units lacking complete kitchen facilities: 0.1%
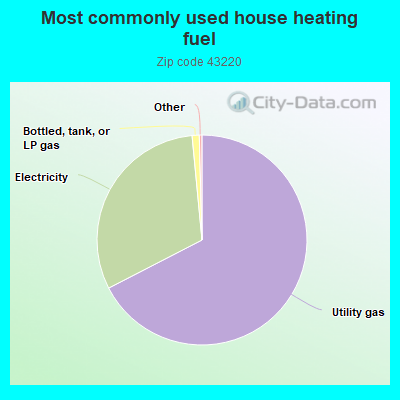
67.5%Utility gas
31.1%Electricity
1.1%Bottled, tank, or LP gas
Population in 1990: 24,378.
Place of birth for U.S.-born residents:
This state: 17,446
Northeast: 1,778
Midwest: 1,768
South: 2,188
West: 1,417
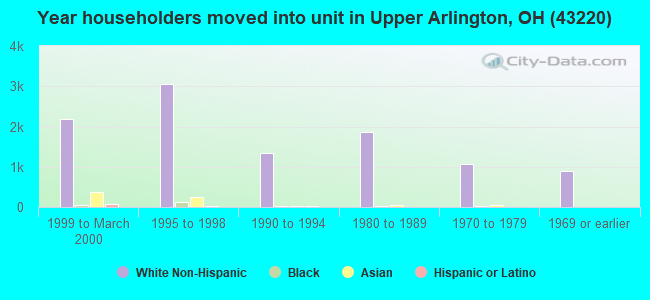
54% of the 43220 zip code residents lived in the same house 5 years ago. Out of people who lived in different houses, 62% lived in this county. Out of people who lived in different counties, 50% lived in Ohio.
84% of the 43220 zip code residents lived in the same house 1 year ago. Out of people who lived in different houses, 63% moved from this county. Out of people who lived in different houses, 15% moved from different county within same state. Out of people who lived in different houses, 16% moved from different state. Out of people who lived in different houses, 2% moved from abroad.
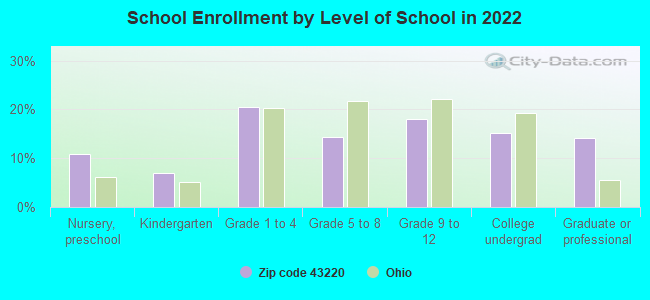
Private vs. public school enrollment:
Students in private schools in grades 1 to 8 (elementary and middle school): 358
Here:
14.8%
Ohio:
16.0%
Students in private schools in grades 9 to 12 (high school): 299
Here:
23.8%
Ohio:
13.1%
Students in private undergraduate colleges: 139
Here:
13.2%
Ohio:
22.3%
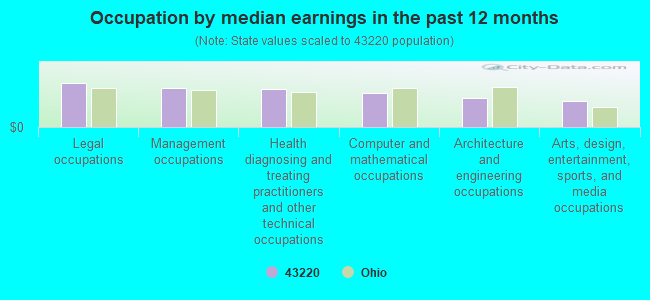
Occupation by median earnings in the past 12 months ($)
118,576Legal occupations
104,864Management occupations
103,140Health diagnosing and treating practitioners and other technical occupations
91,434Computer and mathematical occupations
77,538Architecture and engineering occupations
70,222Arts, design, entertainment, sports, and media occupations
Companies with federal contracts located in this zip code (COLUMBUS, OH):
PRIME ENGINEERING & ARCHITECTU (1565 BETHEL ROAD; small business) : $8,186,408 in 139 contractsfrom 2001 to 2006
Contracts for Architect - Engineer Services (including landscaping, interior layout, and designing), Other Architect and Engineering Services, Administrative and Service Buildings, Construction of Structures and Facilities -- Office Buildings, and moreby Army, Air Force, Navy Signed by year:2000: $0; 2001: $136,396; 2002: $1,184,555; 2003: $1,734,602; 2004: $2,918,048; 2005: $1,383,076; 2006: $829,731.
Biggest contracts:
$768,733 with Army for Architect - Engineer Services (including landscaping, interior layout, and designing). Taking place in UT. Signed on 2004-02-06. Completion date: 2004-09-17.
$533,259 with Army for Other Architect and Engineering Services. Signed on 2006-04-28. Completion date: 2007-02-23.
$494,177 with Air Force for Architect - Engineer Services (including landscaping, interior layout, and designing). Signed on 2005-09-27. Completion date: 2005-11-30.
$397,340 with Army for Architect - Engineer Services (including landscaping, interior layout, and designing). Taking place in WI. Signed on 2002-01-18. Completion date: 2002-08-27.
TEAMWORK SOLUTIONS, INC (1880 MACKENZIE DR STE 201) : $345,800 in 3 contractsfrom 2003 to 2004
$124,500 with Virginia Contracting Activity for Other ADP and Telecommunications Services (includes data storage on tapes, compact disks, etc.). Signed on 2004-03-03. Completion date: 2005-03-03.
$121,500 with Department of Defense for ADP Support Equipment. Taking place in DC. Signed on 2003-08-08. Completion date: 2004-08-08.
$99,800 with Defense Intelligence Agency for Other ADP and Telecommunications Services (includes data storage on tapes, compact disks, etc.). Taking place in DC. Signed on 2004-12-12. Completion date: 2005-09-09.
PROGRESSIVE SYSTEMS INC (2000 W HENDERSON RD)
$71,000 with Army for ADPE System Configuration. Taking place in VA. Signed on 2000-04-01. Completion date: 2001-07-31.
COMPUSERVE INCORPORATED (5000 ARLINGTON CENTRE BLV; small business) : $57,909 in 5 contractsfrom 2000 to 2002
Contracts for ADP Software, Miscellaneous Service and Trade Equipment by Army, National Highway Traffic Safety Administration, U.S. Army Corps of Engineers - civil program financing only Signed by year:2000: $20,000; 2001: $2,600; 2002: $35,309; 2003: $0; 2004: $0; 2005: $0; 2006: $0.
Biggest contracts:
$35,309 with Army for ADP Software. Taking place in FL. Signed on 2002-09-18. Completion date: 2002-09-30.
$20,000 with National Highway Traffic Safety Administration for ADP Software. Taking place in FL. Signed on 2000-08-15. Completion date: 2001-05-15.
$2,600 with U.S. Army Corps of Engineers - civil program financing only for Miscellaneous Service and Trade Equipment. Taking place in WV. Signed on 2001-11-06. Completion date: 2001-09-04.
$0 with Army for ADP Software. Taking place in FL. Signed on 2002-09-18. Completion date: 2002-09-30.
STAR CONSULTANTS INC (1910 BETHEL RD; small business)
$43,586 with Army for Architect - Engineer Services (including landscaping, interior layout, and designing). Signed on 2005-08-08. Completion date: 2005-10-13.
DIGITAL DESIGN, INC (4650 KENNY RD; small business)
$32,498 with U.S. Army Corps of Engineers - civil program financing only for Telephone and Telegraph Equipment. Signed on 2003-04-01. Completion date: 2003-04-30.
NATIONAL SAFETY COUNCIL, CENTR (1515 BETHEL RD STE 110)
$4,890 with Army for Education Services. Signed on 2006-03-14. Completion date: 2006-07-09.
BETA ELECTRONIC, INC (4480 SUMMIT RIDGE RD; small business)
$4,230 with Defense Logistics Agency for Advertising Services. Signed on 2005-03-01. Completion date: 2006-02-28.
DAMON'S INTERNATIONAL INC (4645 EXECUTIVE DR)
$1,162 with Navy for Training Aids. Taking place in MD. Signed on 2004-04-03. Completion date: 2004-04-27.
Top industries in this zip code by the number of employees in 2005:
2002 - 2018 National Fire Incident Reporting System (NFIRS) incidents
According to the data from the years 2002 - 2018 the average number of fires per year is 56. The highest number of fires - 79 took place in 2003, and the least - 29 in 2013. The data has a decreasing trend.
When looking into fire subcategories, the most incidents belonged to: Structure Fires (60.1%), and Outside Fires (26.1%).
Fire incident types reported to NFIRS in Zip Code 43220


+$4,423
-$3,706
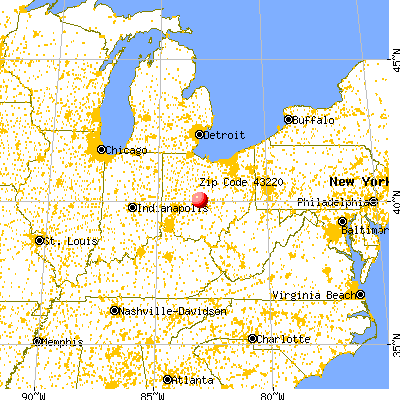
 Nearest zip codes: 43221, 43214, 43202, 43210, 43212, 43085.


 According to the data from the years 2002 - 2018 the average number of fires per year is 56. The highest number of fires - 79 took place in 2003, and the least - 29 in 2013. The data has a decreasing trend.
 When looking into fire subcategories, the most incidents belonged to: Structure Fires (60.1%), and Outside Fires (26.1%).