Estimated zip code population in 2022: 35,108 Zip code population in 2010: 31,265 Zip code population in 2000: 29,609
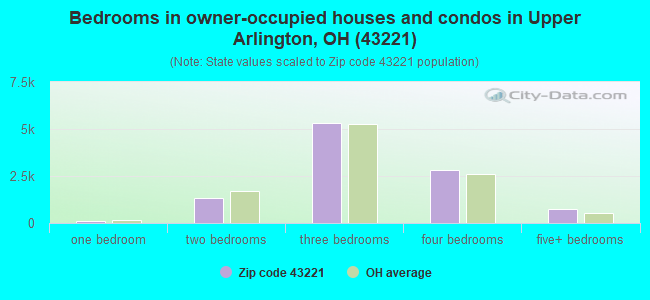
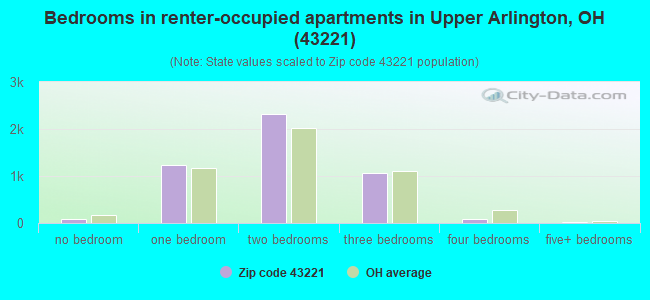
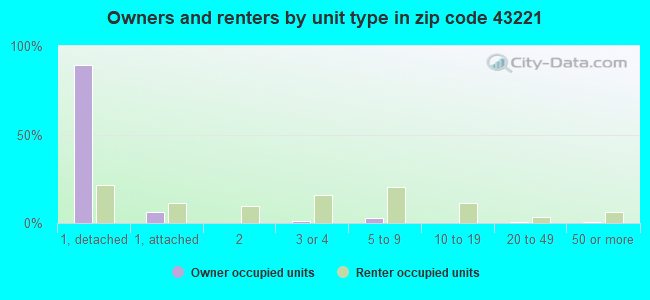
Houses and condos: 15,497 Renter-occupied apartments: 4,788
% of renters here:
32%
State:
33%
March 2022 cost of living index in zip code 43221: 97.0 (near average, U.S. average is 100)
Land area: 9.3 sq. mi. Water area: 0.3 sq. mi.
Population density: 3,760 people per square mile
(average).
OSM Map
General Map
Google Map
MSN Map
OSM Map
General Map
Google Map
MSN Map
OSM Map
General Map
Google Map
MSN Map
OSM Map
General Map
Google Map
MSN Map
Please wait while loading the map...
Real estate property taxes paid for housing units in 2022:
This zip code:
1.6% ($7,165)
Ohio:
1.3% ($2,639)
Median real estate property taxes paid for housing units with mortgages in 2022: $7,290 (1.6%) Median real estate property taxes paid for housing units with no mortgage in 2022: $6,984 (1.7%)
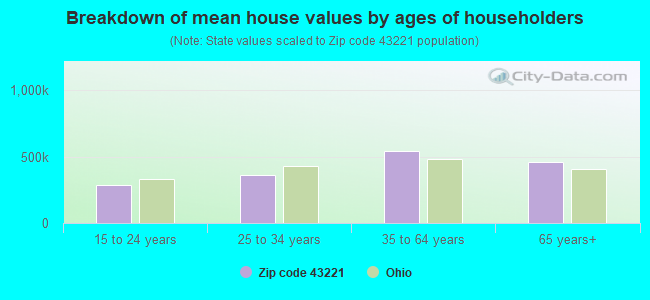
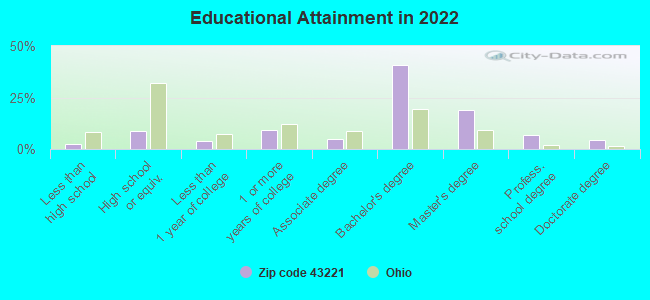
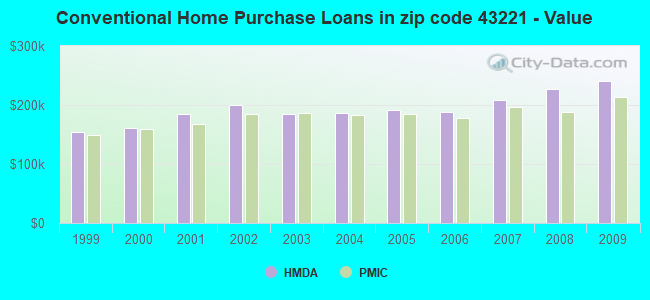
Estimated median house/condo value in 2022: $436,260
43221:
$436,260
Ohio:
$204,100
According to our research of Ohio and other state lists, there were 8 registered sex offenders living in 43221 zip code as of April 27, 2024. The ratio of all residents to sex offenders in zip code 43221 is 4,097 to 1. The ratio of registered sex offenders to all residents in this zip code is much lower than the state average.
Median resident age:
This zip code:
37.8 years
Ohio median age:
39.9 years
Average household size:
This zip code:
2.3 people
Ohio:
2.4 people
Averages for the 2020 tax year for zip code 43221, filed in 2021:
Average Adjusted Gross Income (AGI) in 2020: $150,018 (Individual Income Tax Returns)
Here:
$150,018
State:
$67,288
Salary/wage: $106,615 (reported on 81.4% of returns)
Here:
$106,615
State:
$55,628
(% of AGI for various income ranges: 1172.3% for AGIs below $25k, 3925.8% for AGIs $25k-50k, 6758.8% for AGIs $50k-75k, 9772.2% for AGIs $75k-100k, 19966.7% for AGIs $100k-200k, 108158.6% for AGIs over 200k)
Taxable interest for individuals: $2,463 (reported on 44.5% of returns)
This zip code:
$2,463
Ohio:
$1,518
(% of AGI for various income ranges: 23.2% for AGIs below $25k, 27.6% for AGIs $25k-50k, 54.5% for AGIs $50k-75k, 83.2% for AGIs $75k-100k, 165.7% for AGIs $100k-200k, 1796.5% for AGIs over 200k)
Ordinary dividends: $16,659 (reported on 40.3% of returns)
Here:
$16,659
State:
$7,167
(% of AGI for various income ranges: 73.0% for AGIs below $25k, 84.0% for AGIs $25k-50k, 178.8% for AGIs $50k-75k, 305.8% for AGIs $75k-100k, 661.7% for AGIs $100k-200k, 13183.7% for AGIs over 200k)
Net capital gain/loss in AGI: +$56,241 (reported on 35.3% of returns)
Here:
+$56,241
State:
+$18,919
(% of AGI for various income ranges: 36.1% for AGIs below $25k, 71.0% for AGIs $25k-50k, 157.0% for AGIs $50k-75k, 319.7% for AGIs $75k-100k, 829.7% for AGIs $100k-200k, 45265.2% for AGIs over 200k)
Profit/loss from business: +$26,296 (reported on 17.8% of returns)
Here:
+$26,296
State:
+$13,744
(% of AGI for various income ranges: 141.9% for AGIs below $25k, 202.3% for AGIs $25k-50k, 275.2% for AGIs $50k-75k, 434.8% for AGIs $75k-100k, 1039.3% for AGIs $100k-200k, 6118.6% for AGIs over 200k)
Taxable individual retirement arrangement distribution: $26,133 (reported on 11.6% of returns)
43221:
$26,133
Ohio:
$18,876
(% of AGI for various income ranges: 72.1% for AGIs below $25k, 133.6% for AGIs $25k-50k, 256.0% for AGIs $50k-75k, 486.1% for AGIs $75k-100k, 779.8% for AGIs $100k-200k, 3184.4% for AGIs over 200k)
Self-employed (Keogh) retirement plans: $30,047 (reported on 2.2% of returns)
43221:
$30,047
Ohio:
$24,898
(% of AGI for various income ranges: 30.0% for AGIs $50k-75k, 68.1% for AGIs $100k-200k, 1340.0% for AGIs over 200k)
Total itemized deductions: $35,950 (reported on 17.8% of returns)
Here:
$35,950
State:
$33,869
(% of AGI for various income ranges: 136.3% for AGIs below $25k, 179.2% for AGIs $25k-50k, 397.5% for AGIs $50k-75k, 720.7% for AGIs $75k-100k, 1190.5% for AGIs $100k-200k, 9165.4% for AGIs over 200k)
Charity contributions: $14,742 (reported on 14.7% of returns)
Here:
$14,742
State:
$14,577
(% of AGI for various income ranges: 9.0% for AGIs below $25k, 13.0% for AGIs $25k-50k, 61.6% for AGIs $50k-75k, 92.9% for AGIs $75k-100k, 251.9% for AGIs $100k-200k, 4223.4% for AGIs over 200k)
Taxes paid: $8,920 (reported on 17.7% of returns)
43221:
$8,920
State:
$7,681
(% of AGI for various income ranges: 30.1% for AGIs below $25k, 42.9% for AGIs $25k-50k, 144.1% for AGIs $50k-75k, 260.5% for AGIs $75k-100k, 406.5% for AGIs $100k-200k, 1710.4% for AGIs over 200k)
Earned income credit: $1,793 (reported on 5.2% of returns)
Here:
$1,793
State:
$2,304
(% of AGI for various income ranges: 42.5% for AGIs below $25k, 33.6% for AGIs $25k-50k)
Percentage of individuals using paid preparers for their 2020 taxes: 92.7%
Here:
93%
State:
94%
(% for various income ranges: 89.6% for AGIs below $25k, 93.8% for AGIs $25k-50k, 93.1% for AGIs $50k-75k, 92.7% for AGIs $75k-100k, 93.2% for AGIs $100k-200k, 94.7% for AGIs over 200k)
Averages for the 2012 tax year for zip code 43221, filed in 2013:
Average Adjusted Gross Income (AGI) in 2012: $110,685 (Individual Income Tax Returns)
Here:
$110,685
State:
$54,926
Salary/wage: $80,522 (reported on 83.7% of returns)
Here:
$80,522
State:
$45,869
(% of AGI for various income ranges: 72.6% for AGIs below $25k, 77.5% for AGIs $25k-50k, 76.5% for AGIs $50k-75k, 74.8% for AGIs $75k-100k, 74.7% for AGIs $100k-200k, 46.5% for AGIs over 200k)
Taxable interest for individuals: $2,171 (reported on 46.7% of returns)
This zip code:
$2,171
Ohio:
$1,297
(% of AGI for various income ranges: 1.1% for AGIs below $25k, 0.8% for AGIs $25k-50k, 0.7% for AGIs $50k-75k, 0.7% for AGIs $75k-100k, 0.7% for AGIs $100k-200k, 1.1% for AGIs over 200k)
Ordinary dividends: $12,107 (reported on 37.5% of returns)
Here:
$12,107
State:
$5,821
(% of AGI for various income ranges: 4.3% for AGIs below $25k, 1.8% for AGIs $25k-50k, 2.0% for AGIs $50k-75k, 2.1% for AGIs $75k-100k, 2.4% for AGIs $100k-200k, 5.9% for AGIs over 200k)
Net capital gain/loss in AGI: +$33,127 (reported on 30.0% of returns)
Here:
+$33,127
State:
+$11,232
(% of AGI for various income ranges: 0.3% for AGIs below $25k, 0.4% for AGIs $25k-50k, 0.8% for AGIs $50k-75k, 1.0% for AGIs $75k-100k, 2.0% for AGIs $100k-200k, 16.7% for AGIs over 200k)
Profit/loss from business: +$21,293 (reported on 18.6% of returns)
Here:
+$21,293
State:
+$12,773
(% of AGI for various income ranges: 8.7% for AGIs below $25k, 4.4% for AGIs $25k-50k, 3.4% for AGIs $50k-75k, 3.6% for AGIs $75k-100k, 5.0% for AGIs $100k-200k, 2.6% for AGIs over 200k)
Taxable individual retirement arrangement distribution: $22,551 (reported on 12.7% of returns)
43221:
$22,551
Ohio:
$14,511
(% of AGI for various income ranges: 4.4% for AGIs below $25k, 2.6% for AGIs $25k-50k, 2.8% for AGIs $50k-75k, 3.2% for AGIs $75k-100k, 2.6% for AGIs $100k-200k, 2.3% for AGIs over 200k)
Self-employment retirement plans: $20,445 (reported on 2.2% of returns)
43221:
$20,445
Ohio:
$20,257
(% of AGI for various income ranges: 0.2% for AGIs $50k-75k, 0.1% for AGIs $75k-100k, 0.4% for AGIs $100k-200k, 0.6% for AGIs over 200k)
Total itemized deductions: $29,537 (17% of AGI, reported on 53.7% of returns)
Here:
$29,537
State:
$21,278
Here:
16.7% of AGI
State:
18.8% of AGI
(% of AGI for various income ranges: 14.6% for AGIs below $25k, 12.8% for AGIs $25k-50k, 15.3% for AGIs $50k-75k, 17.2% for AGIs $75k-100k, 17.7% for AGIs $100k-200k, 12.3% for AGIs over 200k)
Charity contributions: $4,984 (reported on 45.5% of returns)
Here:
$4,984
State:
$3,943
(% of AGI for various income ranges: 0.9% for AGIs below $25k, 1.1% for AGIs $25k-50k, 1.5% for AGIs $50k-75k, 1.9% for AGIs $75k-100k, 2.1% for AGIs $100k-200k, 2.3% for AGIs over 200k)
Taxes paid: $16,364 (reported on 53.6% of returns)
43221:
$16,364
State:
$9,568
(% of AGI for various income ranges: 4.4% for AGIs below $25k, 5.6% for AGIs $25k-50k, 7.0% for AGIs $50k-75k, 8.4% for AGIs $75k-100k, 9.6% for AGIs $100k-200k, 7.7% for AGIs over 200k)
Earned income credit: $1,724 (reported on 6.3% of returns)
Here:
$1,724
State:
$2,285
(% of AGI for various income ranges: 2.9% for AGIs below $25k, 0.4% for AGIs $25k-50k)
Percentage of individuals using paid preparers for their 2012 taxes: 49.7%
Here:
50%
State:
51%
(% for various income ranges: 40.8% for AGIs below $25k, 44.3% for AGIs $25k-50k, 48.7% for AGIs $50k-75k, 52.9% for AGIs $75k-100k, 52.7% for AGIs $100k-200k, 76.9% for AGIs over 200k)
Averages for the 2004 tax year for zip code 43221, filed in 2005:
Average Adjusted Gross Income (AGI) in 2004: $78,344 (Individual Income Tax Returns)
Here:
$78,344
State:
$44,480
Salary/wage: $63,369 (reported on 81.6% of returns)
Here:
$63,369
State:
$39,198
(% of AGI for various income ranges: 68.9% for AGIs $10k-25k, 77.0% for AGIs $25k-50k, 77.9% for AGIs $50k-75k, 77.0% for AGIs $75k-100k, 57.9% for AGIs over 100k)
Taxable interest for individuals: $2,445 (reported on 61.1% of returns)
This zip code:
$2,445
Ohio:
$1,532
(% of AGI for various income ranges: 3.7% for AGIs $10k-25k, 1.8% for AGIs $25k-50k, 1.6% for AGIs $50k-75k, 1.3% for AGIs $75k-100k, 1.9% for AGIs over 100k)
Taxable dividends: $7,211 (reported on 43.7% of returns)
Here:
$7,211
State:
$3,496
(% of AGI for various income ranges: 3.3% for AGIs $10k-25k, 2.3% for AGIs $25k-50k, 2.0% for AGIs $50k-75k, 2.5% for AGIs $75k-100k, 5.0% for AGIs over 100k)
Net capital gain/loss: +$15,392 (reported on 36.0% of returns)
Here:
+$15,392
State:
+$8,582
(% of AGI for various income ranges: 0.8% for AGIs $10k-25k, 1.0% for AGIs $25k-50k, 1.1% for AGIs $50k-75k, 2.1% for AGIs $75k-100k, 10.7% for AGIs over 100k)
Profit/loss from business: +$19,017 (reported on 18.1% of returns)
Here:
+$19,017
State:
+$10,813
(% of AGI for various income ranges: 7.6% for AGIs $10k-25k, 3.6% for AGIs $25k-50k, 3.8% for AGIs $50k-75k, 4.4% for AGIs $75k-100k, 4.5% for AGIs over 100k)
IRA payment deduction: $2,980 (reported on 2.8% of returns)
43221:
$2,980
Ohio:
$2,794
(% of AGI for various income ranges: 0.3% for AGIs $10k-25k, 0.3% for AGIs $25k-50k, 0.1% for AGIs $50k-75k, 0.1% for AGIs $75k-100k, 0.1% for AGIs over 100k)
Self-employed pension: $15,888 (reported on 3.0% of returns)
Here:
$15,888
Ohio:
$13,981
(% of AGI for various income ranges: 0.2% for AGIs $10k-25k, 0.2% for AGIs $25k-50k, 0.2% for AGIs $50k-75k, 0.4% for AGIs $75k-100k, 0.8% for AGIs over 100k)
Total itemized deductions: $23,985 (20% of AGI, reported on 56.1% of returns)
Here:
$23,985
State:
$17,503
Here:
19.7% of AGI
State:
20.8% of AGI
(% of AGI for various income ranges: 15.4% for AGIs $10k-25k, 16.8% for AGIs $25k-50k, 19.0% for AGIs $50k-75k, 20.1% for AGIs $75k-100k, 16.0% for AGIs over 100k)
Charity contributions deductions: $4,016 (3% of AGI, reported on 50.3% of returns)
Here:
$4,016
State:
$3,087
Here:
3.1% of AGI
State:
3.4% of AGI
(% of AGI for various income ranges: 1.3% for AGIs $10k-25k, 1.7% for AGIs $25k-50k, 2.2% for AGIs $50k-75k, 2.5% for AGIs $75k-100k, 2.9% for AGIs over 100k)
Total tax: $15,008 (reported on 84.5% of returns)
43221:
$15,008
State:
$6,781
(% of AGI for various income ranges: 5.3% for AGIs $10k-25k, 8.3% for AGIs $25k-50k, 10.5% for AGIs $50k-75k, 11.1% for AGIs $75k-100k, 20.2% for AGIs over 100k)
Earned income credit: $1,358 (reported on 4.3% of returns)
Here:
$1,358
State:
$1,696
Percentage of individuals using paid preparers for their 2004 taxes: 50.6%
Here:
51%
State:
55%
(% for various income ranges: 44.5% for AGIs below $10k, 45.5% for AGIs $10k-25k, 48.7% for AGIs $25k-50k, 50.3% for AGIs $50k-75k, 49.9% for AGIs $75k-100k, 62.2% for AGIs over 100k)
Likely homosexual households (counted as self-reported same-sex unmarried-partner households)
Lesbian couples: 0.1% of all households
Gay men: 0.2% of all households
Household received Food Stamps/SNAP in the past 12 months: 231 Household did not receive Food Stamps/SNAP in the past 12 months: 14,775
Women who had a birth in the past 12 months: 521 (508 now married, 23 unmarried) Women who did not have a birth in the past 12 months: 8,450 (3,993 now married, 4,455 unmarried)
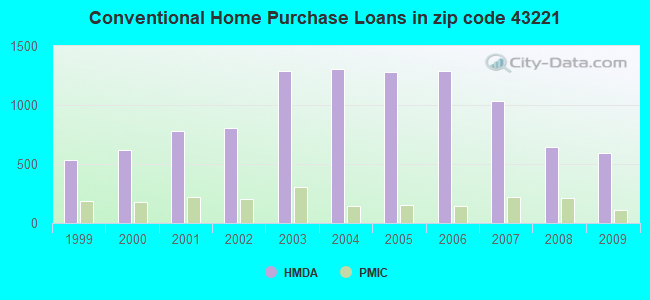
Housing units in zip code 43221 with a mortgage: 6,788 (1,295 second mortgage, 1,231 both second mortgage and home equity loan) Houses without a mortgage: 321
Median monthly owner costs for units with a mortgage: $2,357 Median monthly owner costs for units without a mortgage: $944
Residents with income below the poverty level in 2022:
This zip code:
5.0%
Whole state:
13.4%
Residents with income below 50% of the poverty level in 2022:
This zip code:
1.9%
Whole state:
7.0%
Median number of rooms in houses and condos:
Here:
7.0
State:
6.7
Median number of rooms in apartments:
Here:
4.2
State:
4.4
Notable locations in this zip code not listed on our city pages
Notable locations in zip code 43221: Indian Village Camp (A), Scioto Country Club (B), Scioto Golf Course (C), The Ohio State University Dairy (D), Upper Arlington Fire Division Station 71 (E), Upper Arlington City Hall (F), Scott Hall (G), Rightmire Hall (H), Pressey Hall (I), Mount Hall (J), Bevis Hall (K). Display/hide their locations on the map
Shopping Centers: Golden Bear Shopping Center (1), Kingsdale Shopping Center (2), Tremont Center Shopping Center (3), Lane Avenue Shopping Center (4). Display/hide their locations on the map
Churches in zip code 43221 include: Church of Christ (A), Northwest Christian Church (B), Riverside United Methodist Church (C), Saint Agatha Catholic Church (D), Saint Marks Episcopal Church (E), Wesley Chapel (F), Lane Avenue Baptist Church (G), Lifepoint Church of the Nazarene (H), Northwest Evangelical Christian Church (I). Display/hide their locations on the map
Parks in zip code 43221 include: Fancyburg Park (1), Northam Road Park (2), Upper Arlington Historic District (3), James Thomas Park (4), James J Thomas Park (5), Hoover Park (6). Display/hide their locations on the map
6,642 married couples with children.
1,537 single-parent households (568 men, 969 women).
89.7% of residents of 43221 zip code speak English at home.
1.9% of residents speak Spanish at home (74% very well, 16% well, 8% not well, 3% not at all).
2.6% of residents speak other Indo-European language at home (76% very well, 17% well, 7% not well).
4.4% of residents speak Asian or Pacific Island language at home (46% very well, 31% well, 23% not well).
1.2% of residents speak other language at home (77% very well, 15% well, 4% not well, 4% not at all).
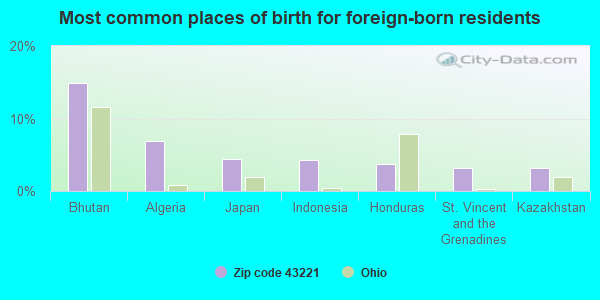
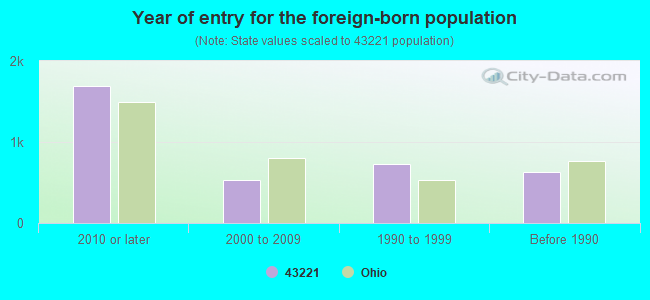
Foreign born population: 3,170 (9.0%) (49.3% of them are naturalized citizens)
Facilities with environmental interests located in this zip code:
ALLIED MINERAL PRODUCTS INC (2700 SCIOTO PKY. in COLUMBUS, OH)
AIR MINOR (AIRS/AFS) CRITERIA AND HAZARDOUS AIR POLLUTANT INVENTORY (Inventory of air pollution sources) STATE MASTER (Ohio general info) - AIR MAJOR, EPCRA, TRIS-43026LLDMN2700S, TRI REPORTER (Resource Conservation and Recovery Act (tracking hazardous waste)) TRI REPORTER (Tracking of toxic chemicals releasing facilities) Business SIC classification: NONCLAY REFRACTORIES Business NAICS classification: NONCLAY REFRACTORY MANUFACTURING. Organizations: TABOR JON K (CONTACT/OWNER)
Alternative names: ALLIED MINERALS
(Integrated Compliance Information System) - ICIS-05-1992-0141, FORMAL ENFORCEMENT ACTION (National Center for Education Statistics) - STATE ID-001644 Organizations: UPPER ARLINGTON CITY SD (SCHOOL DISTRICT)
Alternative names: BARRINGTON ELEMENTARY SCHOOL
BP OIL CO NO 07921 (2468 NORTHWEST BLVD in COLUMBUS, OH)
STATE MASTER (Ohio general info) - AIR MAJOR (Resource Conservation and Recovery Act (tracking hazardous waste)) Organizations: BP OIL COMPANY (CONTACT/OWNER)
BP OIL CO (2139 FISHINGER RD in COLUMBUS, OH)
STATE MASTER (Ohio general info) - RCRA-OHD987012978, HAZARDOUS WASTE PROGRAM, AIR MAJOR, -25-5541-168-49, EPCRA Conditionally Exempt Small Quantity Generators, less than 100 kg/month of hazardous waste (Resource Conservation and Recovery Act (tracking hazardous waste)) - notification Organizations: BP OIL COMPANY (CONTACT/OWNER)
ADL TECHNOLOGY INC (2727 SCIOTO PKWY in COLUMBUS, OH)
TRI REPORTER (Tracking of toxic chemicals releasing facilities) Business SIC classification: ELECTRONIC COMPONENTS
Housing units lacking complete plumbing facilities: 0.5% Housing units lacking complete kitchen facilities: 0.4%
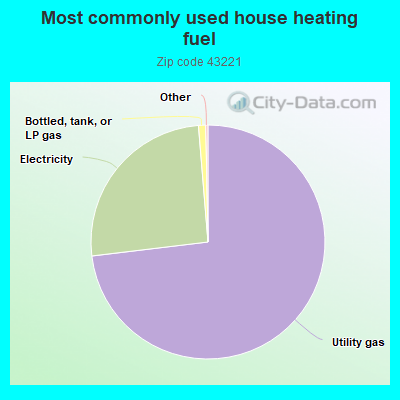
73.1%Utility gas
25.6%Electricity
1.0%Bottled, tank, or LP gas
Population in 1990: 21,283. Population change in the 1990s: +8,326 (+39.1%).
Place of birth for U.S.-born residents:
This state: 22,517
Northeast: 3,087
Midwest: 2,598
South: 2,389
West: 1,045
62% of the 43221 zip code residents lived in the same house 5 years ago. Out of people who lived in different houses, 67% lived in this county. Out of people who lived in different counties, 50% lived in Ohio.
87% of the 43221 zip code residents lived in the same house 1 year ago. Out of people who lived in different houses, 49% moved from this county. Out of people who lived in different houses, 31% moved from different county within same state. Out of people who lived in different houses, 14% moved from different state. Out of people who lived in different houses, 5% moved from abroad.
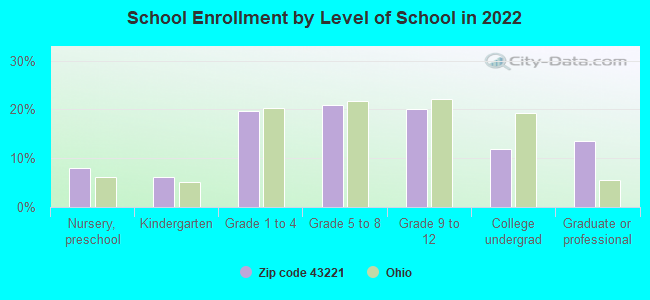
Private vs. public school enrollment:
Students in private schools in grades 1 to 8 (elementary and middle school): 242
Here:
6.6%
Ohio:
16.0%
Students in private schools in grades 9 to 12 (high school): 173
Here:
9.6%
Ohio:
13.1%
Students in private undergraduate colleges: 194
Here:
18.1%
Ohio:
22.3%
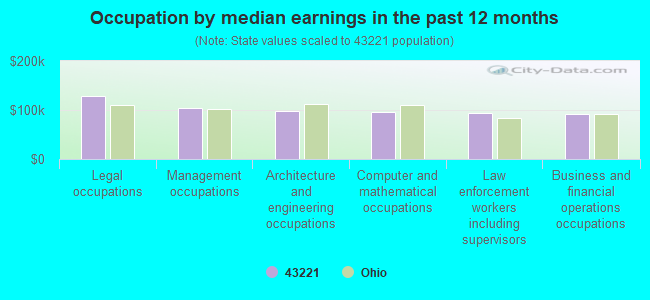
Occupation by median earnings in the past 12 months ($)
128,241Legal occupations
104,158Management occupations
97,852Architecture and engineering occupations
96,174Computer and mathematical occupations
94,079Law enforcement workers including supervisors
91,078Business and financial operations occupations
Companies with federal contracts located in this zip code (COLUMBUS, OH):
EDISON WELDING INSTITUTE (1250 ARTHUR E ADAMS DRIVE) : $84,399,548 in 89 contractsfrom 1999 to 2006
Contracts for Other Defense -- Advanced Development (R&D), Invalid code: AE37, Engineering and Technical Services, Manufacturing Technology -- Applied Research and Exploratory Development (R&D), and moreby Navy, Army, Research and Innovative Technology Administration, ENERGY, Department of, and others Signed by year:2000: $55,495; 2001: $4,026,263; 2002: $53,793,555; 2003: $7,772,501; 2004: $9,068,609; 2005: $3,504,303; 2006: $3,678,822.
Biggest contracts:
$46,093,405 with Navy for Other Defense -- Advanced Development (R&D). Signed on 2002-03-29. Completion date: 2003-01-02.
$3,490,000 with Navy for Invalid code: AE37. Signed on 2006-01-04. Completion date: 2007-01-02.
$3,320,641, same as above.Signed on 2004-10-28. Completion date: 2007-01-02.
$3,000,000 with Navy for Engineering and Technical Services. Signed on 2003-10-07. Completion date: 2007-01-02.
SPECTRUM MANUFACTURING & SALES (1951 HAMPSHIRE RD; small business) : $1,014,481 in 93 contractsfrom 2000 to 2006
Contracts for Hose, Pipe, Tube, Lubrication, and Railing Fittings, Miscellaneous Vehicular Components, Valves, Nonpowered, Marine Hardware and Hull Items, and moreby Defense Logistics Agency, Air Force Signed by year:2000: $29,800; 2001: $128,957; 2002: $104,072; 2003: $0; 2004: $172,952; 2005: $346,494; 2006: $232,206.
Biggest contracts:
$97,584 with Defense Logistics Agency for Hose, Pipe, Tube, Lubrication, and Railing Fittings. Signed on 2006-04-20. Completion date: 2006-07-30.
$74,250 with Defense Logistics Agency for Miscellaneous Vehicular Components. Signed on 2002-02-25. Completion date: 2002-07-25.
$53,865 with Defense Logistics Agency for Valves, Nonpowered. Signed on 2005-12-30. Completion date: 2006-02-28.
$53,464 with Defense Logistics Agency for Marine Hardware and Hull Items. Signed on 2001-03-03. Completion date: 2001-09-18.
ABS MONEY SYSTEMS INC (2105 RIVERSIDE DR) : $90,746 in 10 contractsfrom 2003 to 2006
Contracts for Maintenance, Repair and Rebuilding of Equipment -- Office Machines, Text Processing Systems and Visible Record Equipment, Maintenance, Repair and Rebuilding of Equipment -- Special Industry Machinery, Miscellaneous Office Machines by Defense Finance and Accounting Service, Air Force Signed by year:2000: $0; 2001: $0; 2002: $0; 2003: $28,610; 2004: $40,350; 2005: $25,180; 2006: -$3,394.
Biggest contracts:
$28,910 with Defense Finance and Accounting Service for Maintenance, Repair and Rebuilding of Equipment -- Office Machines, Text Processing Systems and Visible Record Equipment. Signed on 2004-10-01. Completion date: 2005-09-30.
$28,610, same as above.Signed on 2003-10-20. Completion date: 2004-09-30.
$16,720, same as above.Signed on 2005-10-01. Completion date: 2006-09-30.
$12,010 with Air Force for Maintenance, Repair and Rebuilding of Equipment -- Special Industry Machinery. Signed on 2005-10-01. Completion date: 2006-09-30.
EMCO MAIER CORPORATION (2757 SCIOTO PARKWAY; small business)
$85,770 with Navy for Machining Centers and Way-Type Machines. Signed on 2000-03-30. Completion date: 2000-04-28.
KENNETH K TRACEWELL (3159 DUNLAVIN GLEN RD; small business)
$62,650 with Defense Logistics Agency for Installation of Equipment -- Miscellaneous. Taking place in TN. Signed on 1999-11-18. Completion date: 1999-12-06.
TRANSITION PRODUCTS INC (3040 RIVERSIDE DRIVE; small business)
$33,166 with Department of Defense for Office Furniture. Signed on 2000-11-21. Completion date: 2001-01-16.
ALLIED MINERAL PRODUCTS INC (2700 SCIOTO PKWY; small business) : $22,602 in 3 contractsfrom 2004 to 2005
$13,706 with Navy for Miscellaneous Chemical Specialties. Signed on 2005-08-22. Completion date: 2005-09-30.
$8,361, same as above.Signed on 2004-09-17. Completion date: 2004-09-17.
$535, same as above.Signed on 2005-09-01. Completion date: 2005-09-30.
CENTRAL OHIO ALL STAR FOOTBALL (2547 WICKLIFFE RD)
$5,000 with Army for Advertising Services. Signed on 2005-04-29. Completion date: 2005-04-29.
Top industries in this zip code by the number of employees in 2005:
2002 - 2018 National Fire Incident Reporting System (NFIRS) incidents
According to the data from the years 2002 - 2018 the average number of fires per year is 52. The highest number of fires - 68 took place in 2002, and the least - 34 in 2013. The data has a decreasing trend.
When looking into fire subcategories, the most incidents belonged to: Structure Fires (52.0%), and Outside Fires (30.8%).
Fire incident types reported to NFIRS in Zip Code 43221

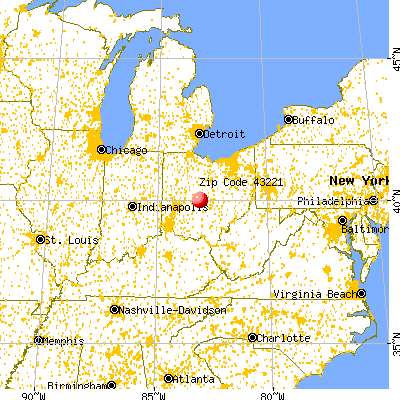


 Nearest zip codes: 43220, 43212, 43210, 43202, 43204, 43214.


 According to the data from the years 2002 - 2018 the average number of fires per year is 52. The highest number of fires - 68 took place in 2002, and the least - 34 in 2013. The data has a decreasing trend.
 When looking into fire subcategories, the most incidents belonged to: Structure Fires (52.0%), and Outside Fires (30.8%).