Estimated zip code population in 2022: 45,390 Zip code population in 2010: 38,493 Zip code population in 2000: 37,732
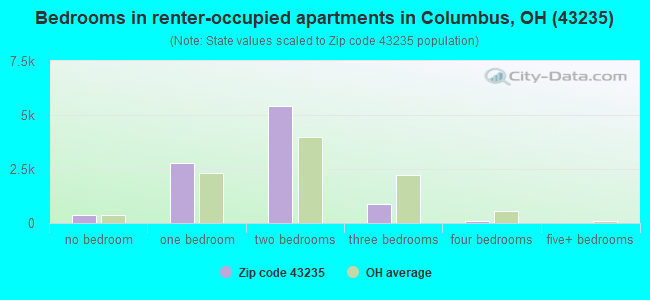
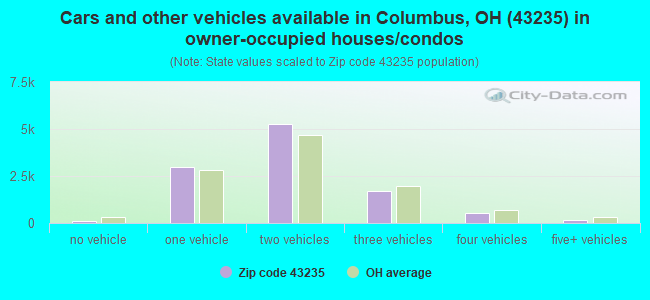
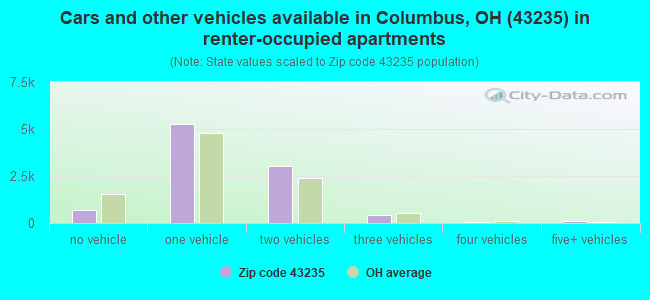
Houses and condos: 20,861 Renter-occupied apartments: 9,445
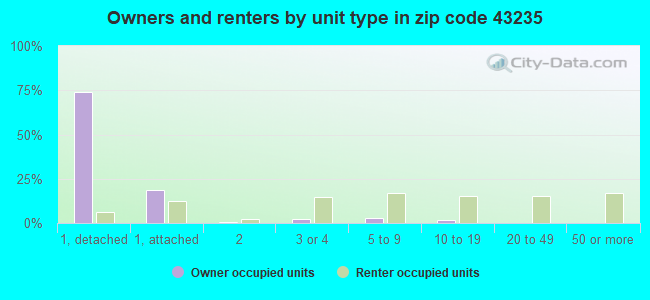
% of renters here:
47%
State:
33%
March 2022 cost of living index in zip code 43235: 97.0 (near average, U.S. average is 100)
Land area: 13.5 sq. mi. Water area: 0.3 sq. mi.
Population density: 3,365 people per square mile
(average).
OSM Map
General Map
Google Map
MSN Map
OSM Map
General Map
Google Map
MSN Map
OSM Map
General Map
Google Map
MSN Map
OSM Map
General Map
Google Map
MSN Map
Please wait while loading the map...
Real estate property taxes paid for housing units in 2022:
This zip code:
1.8% ($5,972)
Ohio:
1.3% ($2,639)
Median real estate property taxes paid for housing units with mortgages in 2022: $6,110 (1.8%) Median real estate property taxes paid for housing units with no mortgage in 2022: $5,774 (1.7%)
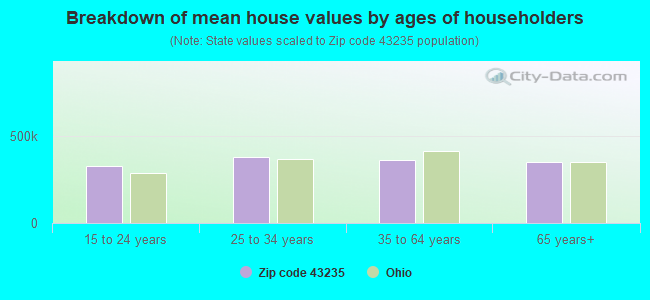
Estimated median house/condo value in 2022: $336,270
43235:
$336,270
Ohio:
$204,100
According to our research of Ohio and other state lists, there were 21 registered sex offenders living in 43235 zip code as of April 27, 2024. The ratio of all residents to sex offenders in zip code 43235 is 2,044 to 1. The ratio of registered sex offenders to all residents in this zip code is much lower than the state average.
Median resident age:
This zip code:
36.5 years
Ohio median age:
39.9 years
Average household size:
This zip code:
2.2 people
Ohio:
2.4 people
Averages for the 2020 tax year for zip code 43235, filed in 2021:
Average Adjusted Gross Income (AGI) in 2020: $84,282 (Individual Income Tax Returns)
Here:
$84,282
State:
$67,288
Salary/wage: $68,350 (reported on 83.0% of returns)
Here:
$68,350
State:
$55,628
(% of AGI for various income ranges: 1232.1% for AGIs below $25k, 3743.2% for AGIs $25k-50k, 6669.4% for AGIs $50k-75k, 10089.0% for AGIs $75k-100k, 18510.7% for AGIs $100k-200k, 75150.6% for AGIs over 200k)
Taxable interest for individuals: $1,529 (reported on 32.2% of returns)
This zip code:
$1,529
Ohio:
$1,518
(% of AGI for various income ranges: 12.7% for AGIs below $25k, 17.4% for AGIs $25k-50k, 32.6% for AGIs $50k-75k, 53.1% for AGIs $75k-100k, 153.3% for AGIs $100k-200k, 1060.2% for AGIs over 200k)
Ordinary dividends: $8,538 (reported on 27.4% of returns)
Here:
$8,538
State:
$7,167
(% of AGI for various income ranges: 32.7% for AGIs below $25k, 50.9% for AGIs $25k-50k, 115.3% for AGIs $50k-75k, 216.6% for AGIs $75k-100k, 492.0% for AGIs $100k-200k, 6895.3% for AGIs over 200k)
Net capital gain/loss in AGI: +$21,488 (reported on 24.7% of returns)
Here:
+$21,488
State:
+$18,919
(% of AGI for various income ranges: 14.6% for AGIs below $25k, 36.6% for AGIs $25k-50k, 88.8% for AGIs $50k-75k, 176.6% for AGIs $75k-100k, 649.7% for AGIs $100k-200k, 20912.7% for AGIs over 200k)
Profit/loss from business: +$19,280 (reported on 16.4% of returns)
Here:
+$19,280
State:
+$13,744
(% of AGI for various income ranges: 119.1% for AGIs below $25k, 168.8% for AGIs $25k-50k, 221.6% for AGIs $50k-75k, 352.8% for AGIs $75k-100k, 942.8% for AGIs $100k-200k, 6054.3% for AGIs over 200k)
Taxable individual retirement arrangement distribution: $24,234 (reported on 9.9% of returns)
43235:
$24,234
Ohio:
$18,876
(% of AGI for various income ranges: 51.5% for AGIs below $25k, 103.7% for AGIs $25k-50k, 219.3% for AGIs $50k-75k, 360.0% for AGIs $75k-100k, 1028.2% for AGIs $100k-200k, 3235.9% for AGIs over 200k)
Self-employed (Keogh) retirement plans: $21,915 (reported on 1.2% of returns)
43235:
$21,915
Ohio:
$24,898
(% of AGI for various income ranges: 10.5% for AGIs $50k-75k, 51.9% for AGIs $100k-200k, 921.8% for AGIs over 200k)
Total itemized deductions: $29,748 (reported on 9.1% of returns)
Here:
$29,748
State:
$33,869
(% of AGI for various income ranges: 61.0% for AGIs below $25k, 101.2% for AGIs $25k-50k, 244.1% for AGIs $50k-75k, 514.2% for AGIs $75k-100k, 891.5% for AGIs $100k-200k, 4539.0% for AGIs over 200k)
Charity contributions: $11,086 (reported on 7.2% of returns)
Here:
$11,086
State:
$14,577
(% of AGI for various income ranges: 3.8% for AGIs below $25k, 11.4% for AGIs $25k-50k, 34.6% for AGIs $50k-75k, 89.9% for AGIs $75k-100k, 241.0% for AGIs $100k-200k, 2157.6% for AGIs over 200k)
Taxes paid: $8,332 (reported on 9.1% of returns)
43235:
$8,332
State:
$7,681
(% of AGI for various income ranges: 9.1% for AGIs below $25k, 21.9% for AGIs $25k-50k, 74.5% for AGIs $50k-75k, 186.1% for AGIs $75k-100k, 298.5% for AGIs $100k-200k, 1016.3% for AGIs over 200k)
Earned income credit: $2,037 (reported on 9.2% of returns)
Here:
$2,037
State:
$2,304
(% of AGI for various income ranges: 62.5% for AGIs below $25k, 40.3% for AGIs $25k-50k, 0.6% for AGIs $50k-75k)
Percentage of individuals using paid preparers for their 2020 taxes: 93.4%
Here:
93%
State:
94%
(% for various income ranges: 92.0% for AGIs below $25k, 94.3% for AGIs $25k-50k, 94.4% for AGIs $50k-75k, 92.5% for AGIs $75k-100k, 93.6% for AGIs $100k-200k, 93.9% for AGIs over 200k)
Averages for the 2012 tax year for zip code 43235, filed in 2013:
Average Adjusted Gross Income (AGI) in 2012: $69,935 (Individual Income Tax Returns)
Here:
$69,935
State:
$54,926
Salary/wage: $58,781 (reported on 85.7% of returns)
Here:
$58,781
State:
$45,869
(% of AGI for various income ranges: 79.5% for AGIs below $25k, 83.8% for AGIs $25k-50k, 79.0% for AGIs $50k-75k, 76.5% for AGIs $75k-100k, 73.7% for AGIs $100k-200k, 57.6% for AGIs over 200k)
Taxable interest for individuals: $1,305 (reported on 37.2% of returns)
This zip code:
$1,305
Ohio:
$1,297
(% of AGI for various income ranges: 1.1% for AGIs below $25k, 0.6% for AGIs $25k-50k, 0.6% for AGIs $50k-75k, 0.5% for AGIs $75k-100k, 0.6% for AGIs $100k-200k, 0.9% for AGIs over 200k)
Ordinary dividends: $6,203 (reported on 27.9% of returns)
Here:
$6,203
State:
$5,821
(% of AGI for various income ranges: 2.1% for AGIs below $25k, 1.3% for AGIs $25k-50k, 1.4% for AGIs $50k-75k, 1.7% for AGIs $75k-100k, 2.0% for AGIs $100k-200k, 4.5% for AGIs over 200k)
Net capital gain/loss in AGI: +$8,205 (reported on 22.6% of returns)
Here:
+$8,205
State:
+$11,232
(% of AGI for various income ranges: 0.3% for AGIs $25k-50k, 0.4% for AGIs $50k-75k, 0.9% for AGIs $75k-100k, 1.8% for AGIs $100k-200k, 7.2% for AGIs over 200k)
Profit/loss from business: +$17,387 (reported on 15.6% of returns)
Here:
+$17,387
State:
+$12,773
(% of AGI for various income ranges: 7.7% for AGIs below $25k, 2.7% for AGIs $25k-50k, 2.4% for AGIs $50k-75k, 2.7% for AGIs $75k-100k, 3.9% for AGIs $100k-200k, 5.0% for AGIs over 200k)
Taxable individual retirement arrangement distribution: $19,985 (reported on 11.3% of returns)
43235:
$19,985
Ohio:
$14,511
(% of AGI for various income ranges: 3.1% for AGIs below $25k, 2.2% for AGIs $25k-50k, 2.8% for AGIs $50k-75k, 3.3% for AGIs $75k-100k, 3.7% for AGIs $100k-200k, 3.4% for AGIs over 200k)
Self-employment retirement plans: $19,174 (reported on 1.2% of returns)
43235:
$19,174
Ohio:
$20,257
(% of AGI for various income ranges: 0.2% for AGIs $25k-50k, 0.1% for AGIs $75k-100k, 0.3% for AGIs $100k-200k, 0.8% for AGIs over 200k)
Total itemized deductions: $23,172 (19% of AGI, reported on 41.7% of returns)
Here:
$23,172
State:
$21,278
Here:
19.0% of AGI
State:
18.8% of AGI
(% of AGI for various income ranges: 9.3% for AGIs below $25k, 8.8% for AGIs $25k-50k, 13.6% for AGIs $50k-75k, 15.6% for AGIs $75k-100k, 16.5% for AGIs $100k-200k, 13.5% for AGIs over 200k)
Charity contributions: $3,830 (reported on 34.6% of returns)
Here:
$3,830
State:
$3,943
(% of AGI for various income ranges: 0.7% for AGIs below $25k, 0.8% for AGIs $25k-50k, 1.6% for AGIs $50k-75k, 1.8% for AGIs $75k-100k, 2.2% for AGIs $100k-200k, 2.5% for AGIs over 200k)
Taxes paid: $11,922 (reported on 41.6% of returns)
43235:
$11,922
State:
$9,568
(% of AGI for various income ranges: 2.4% for AGIs below $25k, 3.1% for AGIs $25k-50k, 5.7% for AGIs $50k-75k, 7.2% for AGIs $75k-100k, 8.9% for AGIs $100k-200k, 8.6% for AGIs over 200k)
Earned income credit: $1,898 (reported on 9.3% of returns)
Here:
$1,898
State:
$2,285
(% of AGI for various income ranges: 3.6% for AGIs below $25k, 0.5% for AGIs $25k-50k)
Percentage of individuals using paid preparers for their 2012 taxes: 43.4%
Here:
43%
State:
51%
(% for various income ranges: 37.3% for AGIs below $25k, 38.6% for AGIs $25k-50k, 45.3% for AGIs $50k-75k, 47.7% for AGIs $75k-100k, 50.9% for AGIs $100k-200k, 68.2% for AGIs over 200k)
Averages for the 2004 tax year for zip code 43235, filed in 2005:
Average Adjusted Gross Income (AGI) in 2004: $59,660 (Individual Income Tax Returns)
Here:
$59,660
State:
$44,480
Salary/wage: $50,607 (reported on 85.8% of returns)
Here:
$50,607
State:
$39,198
(% of AGI for various income ranges: 183.5% for AGIs below $10k, 80.4% for AGIs $10k-25k, 83.2% for AGIs $25k-50k, 78.8% for AGIs $50k-75k, 79.3% for AGIs $75k-100k, 63.5% for AGIs over 100k)
Taxable interest for individuals: $1,647 (reported on 53.3% of returns)
This zip code:
$1,647
Ohio:
$1,532
(% of AGI for various income ranges: 14.3% for AGIs below $10k, 2.4% for AGIs $10k-25k, 1.3% for AGIs $25k-50k, 1.1% for AGIs $50k-75k, 1.2% for AGIs $75k-100k, 1.4% for AGIs over 100k)
Taxable dividends: $3,559 (reported on 35.0% of returns)
Here:
$3,559
State:
$3,496
(% of AGI for various income ranges: 11.7% for AGIs below $10k, 2.2% for AGIs $10k-25k, 1.3% for AGIs $25k-50k, 1.5% for AGIs $50k-75k, 1.7% for AGIs $75k-100k, 2.5% for AGIs over 100k)
Net capital gain/loss: +$7,126 (reported on 28.8% of returns)
Here:
+$7,126
State:
+$8,582
(% of AGI for various income ranges: -5.2% for AGIs below $10k, 0.3% for AGIs $10k-25k, 0.4% for AGIs $25k-50k, 0.9% for AGIs $50k-75k, 1.2% for AGIs $75k-100k, 6.3% for AGIs over 100k)
Profit/loss from business: +$17,573 (reported on 15.3% of returns)
Here:
+$17,573
State:
+$10,813
(% of AGI for various income ranges: 2.1% for AGIs below $10k, 5.1% for AGIs $10k-25k, 2.8% for AGIs $25k-50k, 3.6% for AGIs $50k-75k, 4.2% for AGIs $75k-100k, 5.4% for AGIs over 100k)
Profit/loss from farming: +$789 (reported on 0.1% of returns)
Here:
+$789
State:
-$3,706
IRA payment deduction: $3,117 (reported on 2.9% of returns)
43235:
$3,117
Ohio:
$2,794
(% of AGI for various income ranges: 0.4% for AGIs below $10k, 0.3% for AGIs $10k-25k, 0.3% for AGIs $25k-50k, 0.2% for AGIs $50k-75k, 0.2% for AGIs $75k-100k, 0.1% for AGIs over 100k)
Self-employed pension: $14,546 (reported on 2.1% of returns)
Here:
$14,546
Ohio:
$13,981
(% of AGI for various income ranges: 0.5% for AGIs below $10k, 0.1% for AGIs $25k-50k, 0.2% for AGIs $50k-75k, 0.2% for AGIs $75k-100k, 0.8% for AGIs over 100k)
Total itemized deductions: $20,392 (20% of AGI, reported on 45.9% of returns)
Here:
$20,392
State:
$17,503
Here:
20.1% of AGI
State:
20.8% of AGI
(% of AGI for various income ranges: 22.9% for AGIs below $10k, 11.7% for AGIs $10k-25k, 12.7% for AGIs $25k-50k, 17.2% for AGIs $50k-75k, 19.2% for AGIs $75k-100k, 15.6% for AGIs over 100k)
Charity contributions deductions: $3,576 (3% of AGI, reported on 40.6% of returns)
Here:
$3,576
State:
$3,087
Here:
3.3% of AGI
State:
3.4% of AGI
(% of AGI for various income ranges: 1.2% for AGIs below $10k, 1.1% for AGIs $10k-25k, 1.3% for AGIs $25k-50k, 2.1% for AGIs $50k-75k, 2.5% for AGIs $75k-100k, 3.0% for AGIs over 100k)
Total tax: $10,258 (reported on 82.4% of returns)
43235:
$10,258
State:
$6,781
(% of AGI for various income ranges: 4.5% for AGIs below $10k, 5.0% for AGIs $10k-25k, 8.4% for AGIs $25k-50k, 10.5% for AGIs $50k-75k, 11.3% for AGIs $75k-100k, 19.1% for AGIs over 100k)
Earned income credit: $1,404 (reported on 6.3% of returns)
Here:
$1,404
State:
$1,696
Percentage of individuals using paid preparers for their 2004 taxes: 44.3%
Here:
44%
State:
55%
(% for various income ranges: 37.3% for AGIs below $10k, 41.2% for AGIs $10k-25k, 41.6% for AGIs $25k-50k, 48.6% for AGIs $50k-75k, 46.9% for AGIs $75k-100k, 55.4% for AGIs over 100k)
Likely homosexual households (counted as self-reported same-sex unmarried-partner households)
Lesbian couples: 0.1% of all households
Gay men: 0.6% of all households
Household received Food Stamps/SNAP in the past 12 months: 825 Household did not receive Food Stamps/SNAP in the past 12 months: 19,352
Women who had a birth in the past 12 months: 484 (451 now married, 41 unmarried) Women who did not have a birth in the past 12 months: 10,839 (4,383 now married, 6,455 unmarried)
Housing units in zip code 43235 with a mortgage: 6,799 (931 second mortgage, 43 home equity loan, 827 both second mortgage and home equity loan) Houses without a mortgage: 257
Median monthly owner costs for units with a mortgage: $1,906 Median monthly owner costs for units without a mortgage: $856
Residents with income below the poverty level in 2022:
This zip code:
8.4%
Whole state:
13.4%
Residents with income below 50% of the poverty level in 2022:
This zip code:
4.8%
Whole state:
7.0%
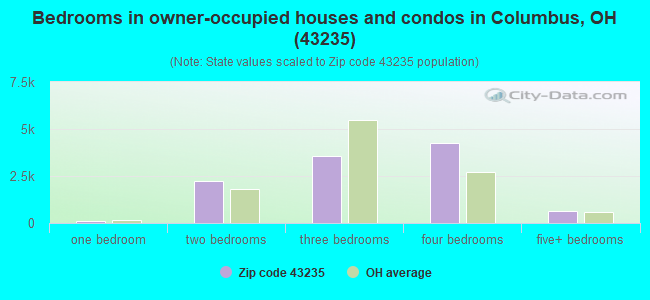
Median number of rooms in houses and condos:
Here:
7.4
State:
6.7
Median number of rooms in apartments:
Here:
3.9
State:
4.4
Notable locations in this zip code not listed on our city pages
Notable locations in zip code 43235: Worthington Hills Country Club (A), Wingsong Country Club (B), Crosswoods Center Industrial Park (C), Brookside Country Club (D), York Temple Country Club (E), Camp Mary Orton (F), Medflight (G), Columbus Division of Fire Station 27 Great Northwest Fire Station (H). Display/hide their locations on the map
Shopping Centers: Bethel Bentley Plaza Shopping Center (1), Hayden Run Plaza Shopping Center (2), Plaza at Sawmill Place Shopping Center (3), Northwest Square Shopping Center (4), Crown Point Shopping Center (5), Bethel Centre Shopping Center (6), Olentangy Square Shopping Center (7), Olentangy Valley Centre Shopping Center (8), Sun Center Shopping Center (9). Display/hide their locations on the map
Churches in zip code 43235 include: Worthington Christian Church (A), Riverside Bible Church (B), Linworth Road Community Church (C), Northwest Church of the Nazarene (D), Lord of Life Lutheran Church (E), Linworth United Methodist Church (F), North Columbus Baptist Church (G), Fellowship Lutheran Church (H), Smoky Row Brethren Church (I). Display/hide their locations on the map
Parks in zip code 43235 include: Antrim Park (1), Olentangy Park (2), Sycamore Hills Park (3), High Banks Metropolitan Park (4), Edward F Hutchins Nature Preserve (5), Sawmill State Wildlife Education Area (6), Worthington Hills Park (7). Display/hide their locations on the map
7,355 married couples with children.
2,000 single-parent households (600 men, 1,400 women).
81.6% of residents of 43235 zip code speak English at home.
3.5% of residents speak Spanish at home (53% very well, 25% well, 18% not well, 5% not at all).
4.9% of residents speak other Indo-European language at home (82% very well, 15% well, 3% not well).
4.2% of residents speak Asian or Pacific Island language at home (65% very well, 21% well, 11% not well, 4% not at all).
5.8% of residents speak other language at home (71% very well, 20% well, 7% not well, 2% not at all).
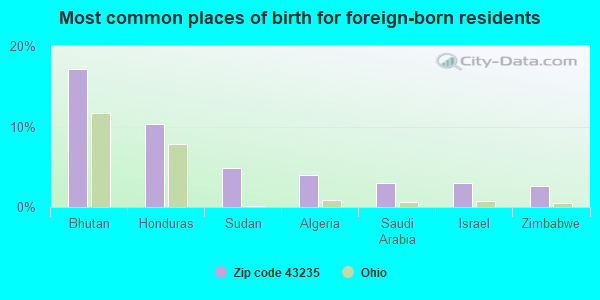
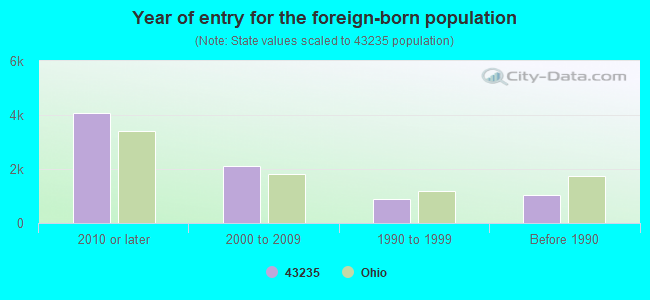
Foreign born population: 7,283 (16.0%) (44.2% of them are naturalized citizens)
Facilities with environmental interests located in this zip code:
BP OIL CO (6822 SAWMILL RD in COLUMBUS, OH)
STATE MASTER (Ohio general info) - RCRA-OHD987013224, HAZARDOUS WASTE PROGRAM, AIR MAJOR, -25-5541-168-42, EPCRA Conditionally Exempt Small Quantity Generators, less than 100 kg/month of hazardous waste (Resource Conservation and Recovery Act (tracking hazardous waste)) - notification Organizations: BP OIL COMPANY (CONTACT/OWNER)
BP OIL CO (7310 SAWMILL RD in COLUMBUS, OH)
STATE MASTER (Ohio general info) - RCRA-OHD987013240, HAZARDOUS WASTE PROGRAM, AIR MAJOR, -25-5541-168-48, EPCRA Conditionally Exempt Small Quantity Generators, less than 100 kg/month of hazardous waste (Resource Conservation and Recovery Act (tracking hazardous waste)) - notification Organizations: BP OIL COMPANY (CONTACT/OWNER)
BLUFFSVIEW ELEMENTARY SCHOOL (7111 LINWORTH RD in COLUMBUS, OH)
(National Center for Education Statistics) - STATE ID-112128 Organizations: WORTHINGTON CITY SD (SCHOOL DISTRICT)
BP OIL CO (4799 SAWMILL RD in COLUMBUS, OH)
(Resource Conservation and Recovery Act (tracking hazardous waste)) Organizations: BP OIL COMPANY (CONTACT/OWNER)
Housing units lacking complete plumbing facilities: 0.0% Housing units lacking complete kitchen facilities: 0.5%
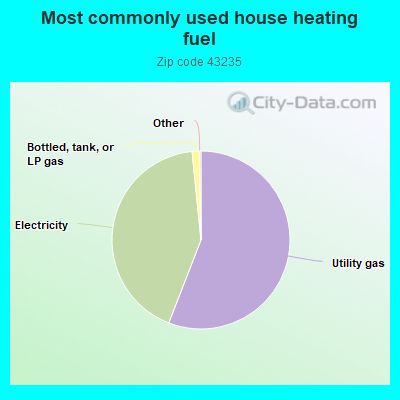
55.9%Utility gas
42.5%Electricity
1.3%Bottled, tank, or LP gas
Population in 1990: 34,051. Population change in the 1990s: +3,681 (+10.8%).
Place of birth for U.S.-born residents:
This state: 26,887
Northeast: 2,504
Midwest: 3,215
South: 3,451
West: 1,531
48% of the 43235 zip code residents lived in the same house 5 years ago. Out of people who lived in different houses, 62% lived in this county. Out of people who lived in different counties, 50% lived in Ohio.
83% of the 43235 zip code residents lived in the same house 1 year ago. Out of people who lived in different houses, 58% moved from this county. Out of people who lived in different houses, 19% moved from different county within same state. Out of people who lived in different houses, 13% moved from different state. Out of people who lived in different houses, 7% moved from abroad.
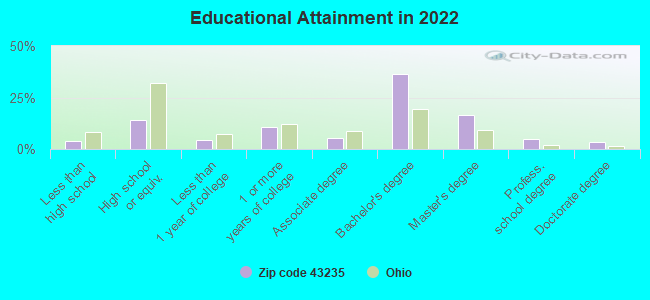
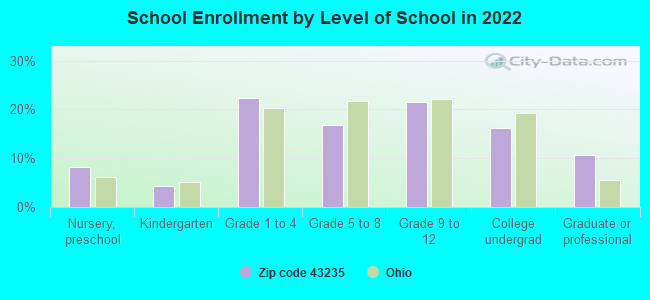
Private vs. public school enrollment:
Students in private schools in grades 1 to 8 (elementary and middle school): 493
Here:
12.4%
Ohio:
16.0%
Students in private schools in grades 9 to 12 (high school): 209
Here:
9.6%
Ohio:
13.1%
Students in private undergraduate colleges: 199
Here:
12.0%
Ohio:
22.3%
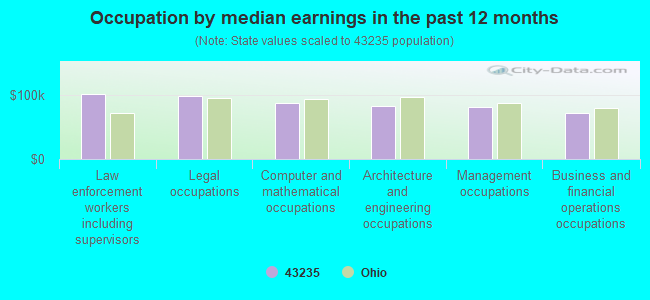
Occupation by median earnings in the past 12 months ($)
101,937Law enforcement workers including supervisors
98,825Legal occupations
87,039Computer and mathematical occupations
82,258Architecture and engineering occupations
81,532Management occupations
72,090Business and financial operations occupations
Companies with federal contracts located in this zip code (COLUMBUS, OH):
OHIO REHABILITION SERVICES COM (400 E CAMPUS VIEW BLVD) : $5,818,830 in 18 contractsfrom 1999 to 2004
Contracts for Food Services by Air Force Signed by year:2000: $1,039,512; 2001: $1,114,538; 2002: $1,151,075; 2003: $1,126,754; 2004: $871,534; 2005: $0; 2006: $0.
Biggest contracts:
$1,020,158 with Air Force for Food Services. Signed on 2000-11-09. Completion date: 2001-03-31.
$563,377, same as above.Signed on 2003-11-05. Completion date: 2004-03-31.
$563,377, same as above.Signed on 2002-10-15. Completion date: 2002-03-31.
$563,377, same as above.Signed on 2003-03-14. Completion date: 2004-03-31.
SRICO INC (2724 SAWBURY BLVD; small business) : $3,921,145 in 24 contractsfrom 2000 to 2006
Contracts for Weapons -- Management and Support (R&D), Services -- Basic Research (R&D), Other Medical -- Operational Systems Development (R&D), Other Defense -- Applied Research and Exploratory Development (R&D), and moreby Air Force, Army, Navy, Department of Defense, and others Signed by year:2000: $573,998; 2001: $119,847; 2002: $929,921; 2003: $313,970; 2004: $703,130; 2005: $1,200,374; 2006: $79,905.
Biggest contracts:
$449,000 with Air Force for Weapons -- Management and Support (R&D). Signed on 2005-04-07. Completion date: 2007-06-25.
$399,051 with Army for Services -- Basic Research (R&D). Signed on 2004-09-23. Completion date: 2006-09-19.
$374,974 with Army for Other Medical -- Operational Systems Development (R&D). Signed on 2000-01-11. Completion date: 2001-10-02.
$365,016, same as above.Signed on 2002-09-11. Completion date: 2001-08-07.
ENTIFIC MEDICAL SYSTEMS, INC (7610 OLENTANGY RIVER RD) : $760,268 in 113 contractsfrom 2002 to 2006
Contracts for Medical and Surgical Instruments, Equipment, and Supplies, Maintenance, Repair and Rebuilding of Equipment -- Medical, Dental, and Veterinary Equipment and Supplies by Department of Veterans Affairs, Navy, Air Force, Army, and others Signed by year:2000: $0; 2001: $0; 2002: $15,750; 2003: $67,644; 2004: $306,550; 2005: $360,165; 2006: $10,159.
Biggest contracts:
$42,122 with Department of Veterans Affairs for Medical and Surgical Instruments, Equipment, and Supplies. Taking place in WA. Signed on 2005-07-01. Completion date: 2005-07-31.
$29,427 with Department of Veterans Affairs for Medical and Surgical Instruments, Equipment, and Supplies. Taking place in MO. Signed on 2005-07-01. Completion date: 2005-07-31.
$27,062 with Navy for Medical and Surgical Instruments, Equipment, and Supplies. Taking place in VA. Signed on 2004-12-20. Completion date: 2004-11-17.
$21,705 with Department of Veterans Affairs for Medical and Surgical Instruments, Equipment, and Supplies. Taking place in NY. Signed on 2005-07-01. Completion date: 2005-07-31.
MORLAN & ASSOCIATES INC (6625 MCVEY BLVD; small business) : $43,463 in 2 contractsin 2005
$29,744 with Navy for Coils and Transformers. Signed on 2005-02-28. Completion date: 2005-04-15.
$13,719, same as above.Signed on 2005-01-25. Completion date: 2005-02-28.
PERFECT PLATE CATERING CO INC, (2608 BILLINGSLEY RD; small business) : $29,099 in 6 contractsfrom 2004 to 2005
Contracts for Perishable Subsistence $10k To $25K, Food Services, Food Items For Resale by Army Signed by year:2000: $0; 2001: $0; 2002: $0; 2003: $0; 2004: $6,524; 2005: $22,575; 2006: $0.
Biggest contracts:
$51,450 with Army for Perishable Subsistence $10k To $25K. Signed on 2005-09-30. Completion date: 2005-10-27.
$5,340 with Army for Food Services. Signed on 2004-07-02. Completion date: 2004-06-07.
$4,307, same as above.Signed on 2005-08-24. Completion date: 2005-08-13.
$3,753, same as above.Signed on 2005-08-18. Completion date: 2005-09-13.
WEST-WHI COLUMBUS NORTHWEST PA (175 HUTCHINSON AVE)
$28,918 with Army for Purchase of Structures and Facilities -- Conference Space and Facilities. Signed on 2001-03-19. Completion date: 2001-04-01.
BUCKEYE CORPORATE TRANSPORTATI (30 DILLMONT DR STE 137; small business) : $24,783 in 6 contractsfrom 2002 to 2005
Contracts for Motor Passenger Services, Passenger Motor Charter Service by Army Signed by year:2000: $0; 2001: $0; 2002: $9,555; 2003: $7,763; 2004: $1,000; 2005: $6,465; 2006: $0.
Biggest contracts:
$9,555 with Army for Motor Passenger Services. Signed on 2002-12-23. Completion date: 2003-01-31.
$7,763, same as above.Signed on 2003-02-24. Completion date: 2003-01-31.
$6,000 with Army for Passenger Motor Charter Service. Signed on 2004-04-14. Completion date: 2004-04-18.
$3,500, same as above.Signed on 2005-05-16. Completion date: 2005-06-10.
Top industries in this zip code by the number of employees in 2005:
Finance and Insurance: Other Activities Related to Credit Intermediation (over 1000: 1, 20-49: 1, 1-4: 2)
Administrative and Support and Waste Management and Remediation Services: Temporary Help Services (500-999: 1, 250-499: 1, 50-99: 1, 20-49: 2, 10-19: 1, 1-4: 3)
2002 - 2018 National Fire Incident Reporting System (NFIRS) incidents
Based on the data from the years 2002 - 2018 the average number of fire incidents per year is 85. The highest number of reported fire incidents - 126 took place in 2002, and the least - 52 in 2016. The data has a decreasing trend.
When looking into fire subcategories, the most incidents belonged to: Structure Fires (40.2%), and Outside Fires (37.0%).
Fire incident types reported to NFIRS in Zip Code 43235


+$789
-$3,706
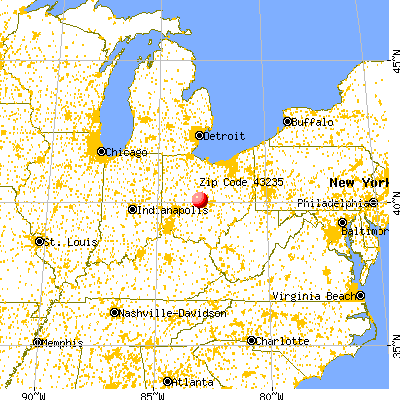
 Nearest zip codes: 43085, 43240, 43229, 43214, 43035, 43220.
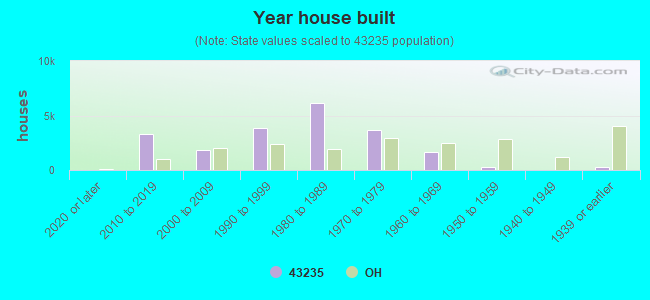


 Based on the data from the years 2002 - 2018 the average number of fire incidents per year is 85. The highest number of reported fire incidents - 126 took place in 2002, and the least - 52 in 2016. The data has a decreasing trend.
 When looking into fire subcategories, the most incidents belonged to: Structure Fires (40.2%), and Outside Fires (37.0%).