Estimated zip code population in 2022: 3,018 Zip code population in 2010: 2,755 Zip code population in 2000: 2,768
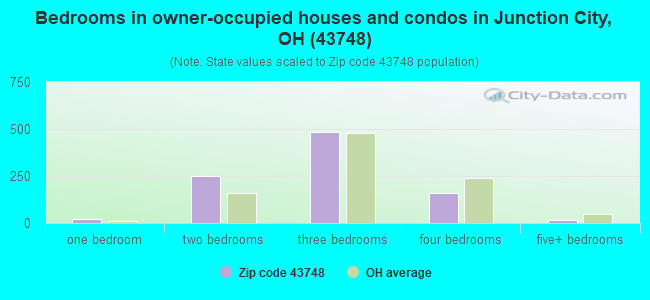
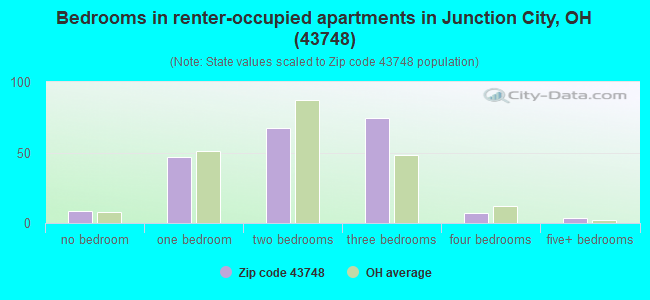
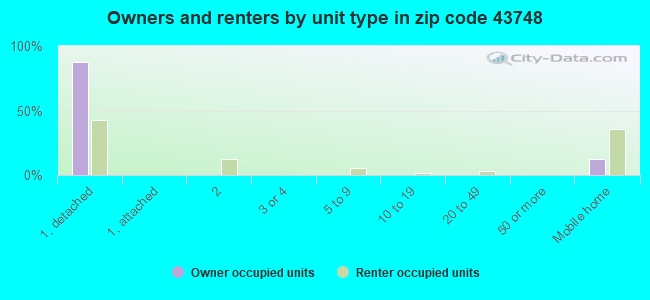
Houses and condos: 1,235 Renter-occupied apartments: 208
% of renters here:
18%
State:
33%
March 2022 cost of living index in zip code 43748: 83.1 (low, U.S. average is 100)
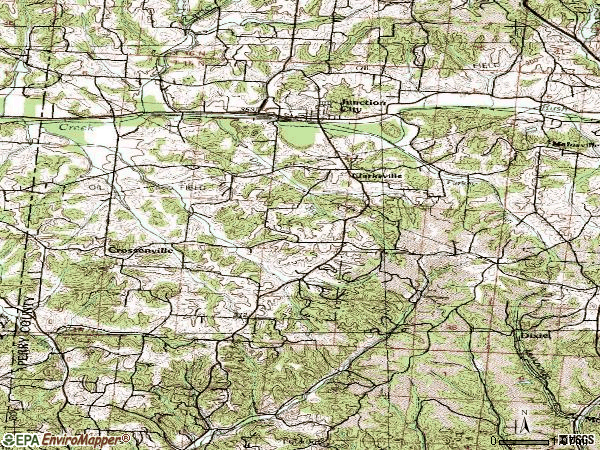
Land area: 35.7 sq. mi. Water area: 0.3 sq. mi.
Population density: 84 people per square mile
(very low).
OSM Map
General Map
Google Map
MSN Map
OSM Map
General Map
Google Map
MSN Map
OSM Map
General Map
Google Map
MSN Map
OSM Map
General Map
Google Map
MSN Map
Please wait while loading the map...
Real estate property taxes paid for housing units in 2022:
This zip code:
0.7% ($1,402)
Ohio:
1.3% ($2,639)
Median real estate property taxes paid for housing units with mortgages in 2022: $1,358 (0.6%) Median real estate property taxes paid for housing units with no mortgage in 2022: $1,636 (0.9%)
Business Search- 14 Million verified businesses
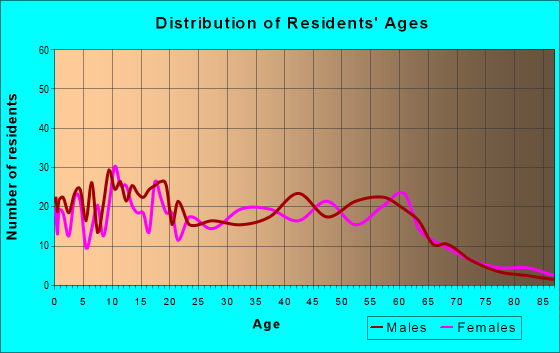
Males: 1,531
(50.8%)
Females: 1,486
(49.2%)
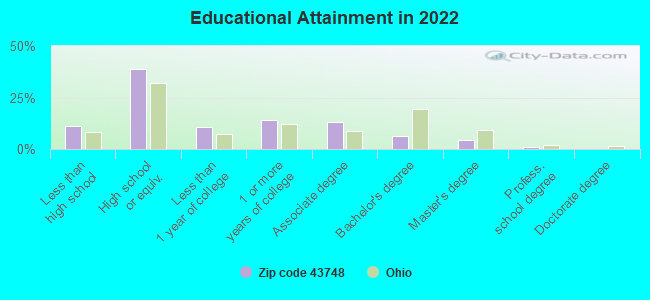
For population 25 years and over in 43748:
High school or higher: 87.7%
Bachelor's degree or higher: 12.0%
Graduate or professional degree: 5.5%
Unemployed: 2.3%
Mean travel time to work (commute): 34.7 minutes
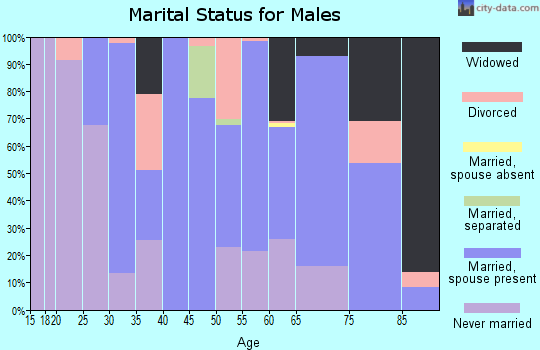
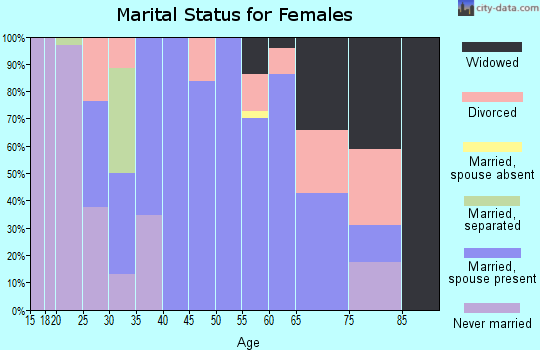
For population 15 years and over in 43748:
Never married: 28.8%
Now married: 47.0%
Separated: 2.7%
Widowed: 3.9%
Divorced: 17.6%
Zip code 43748 compared to state average:
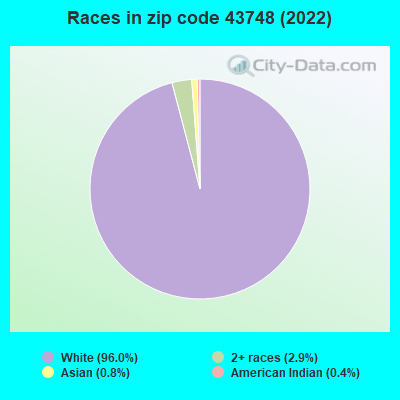
Black race population percentage significantly below state average.
Hispanic race population percentage significantly below state average.
Median age below state average.
Foreign-born population percentage significantly below state average.
Renting percentage below state average.
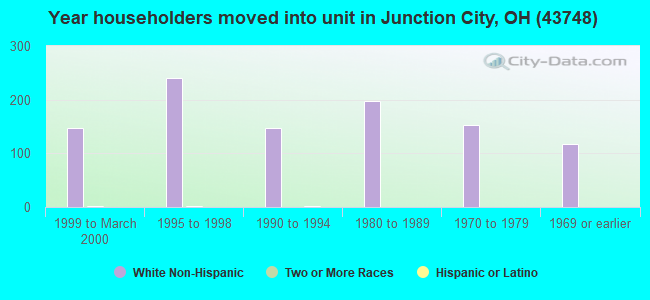
Length of stay since moving in above state average.
Percentage of population with a bachelor's degree or higher significantly below state average.
Averages for the 2020 tax year for zip code 43748, filed in 2021:
Average Adjusted Gross Income (AGI) in 2020: $50,936 (Individual Income Tax Returns)
Here:
$50,936
State:
$67,288
Salary/wage: $44,748 (reported on 86.3% of returns)
Here:
$44,748
State:
$55,628
(% of AGI for various income ranges: 1184.3% for AGIs below $25k, 3565.3% for AGIs $25k-50k, 5849.5% for AGIs $50k-75k, 8696.0% for AGIs $75k-100k, 14706.7% for AGIs $100k-200k)
Taxable interest for individuals: $762 (reported on 19.4% of returns)
This zip code:
$762
Ohio:
$1,518
(% of AGI for various income ranges: 6.0% for AGIs below $25k, 6.7% for AGIs $25k-50k, 15.0% for AGIs $50k-75k, 27.0% for AGIs $75k-100k, 97.8% for AGIs $100k-200k)
Ordinary dividends: $1,750 (reported on 9.7% of returns)
Here:
$1,750
State:
$7,167
(% of AGI for various income ranges: 14.0% for AGIs $25k-50k, 19.5% for AGIs $50k-75k, 28.0% for AGIs $75k-100k, 112.2% for AGIs $100k-200k)
Net capital gain/loss in AGI: +$6,064 (reported on 8.9% of returns)
Here:
+$6,064
State:
+$18,919
(% of AGI for various income ranges: 20.0% for AGIs $25k-50k, 98.5% for AGIs $50k-75k, 455.6% for AGIs $100k-200k)
Profit/loss from business: +$5,428 (reported on 14.5% of returns)
Here:
+$5,428
State:
+$13,744
(% of AGI for various income ranges: 142.0% for AGIs below $25k, 69.0% for AGIs $25k-50k, 96.0% for AGIs $50k-75k, 66.0% for AGIs $75k-100k, 95.6% for AGIs $100k-200k)
Taxable individual retirement arrangement distribution: $17,829 (reported on 5.6% of returns)
43748:
$17,829
Ohio:
$18,876
(% of AGI for various income ranges: 142.3% for AGIs $25k-50k, 821.0% for AGIs $75k-100k)
Taxes paid: $6,350 (reported on 1.6% of returns)
43748:
$6,350
State:
$7,681
(% of AGI for various income ranges: 42.3% for AGIs below $25k)
Earned income credit: $2,262 (reported on 19.4% of returns)
Here:
$2,262
State:
$2,304
(% of AGI for various income ranges: 110.3% for AGIs below $25k, 70.7% for AGIs $25k-50k)
Percentage of individuals using paid preparers for their 2020 taxes: 94.4%
Here:
94%
State:
94%
(% for various income ranges: 92.3% for AGIs below $25k, 94.3% for AGIs $25k-50k, 95.8% for AGIs $50k-75k, 100.0% for AGIs $75k-100k, 92.3% for AGIs $100k-200k)
Averages for the 2012 tax year for zip code 43748, filed in 2013:
Average Adjusted Gross Income (AGI) in 2012: $37,262 (Individual Income Tax Returns)
Here:
$37,262
State:
$54,926
Salary/wage: $35,391 (reported on 86.2% of returns)
Here:
$35,391
State:
$45,869
(% of AGI for various income ranges: 75.5% for AGIs below $25k, 84.3% for AGIs $25k-50k, 82.3% for AGIs $50k-75k, 85.8% for AGIs $75k-100k, 77.2% for AGIs $100k-200k)
Taxable interest for individuals: $654 (reported on 22.4% of returns)
This zip code:
$654
Ohio:
$1,297
(% of AGI for various income ranges: 0.7% for AGIs below $25k, 0.4% for AGIs $25k-50k, 0.4% for AGIs $50k-75k, 0.4% for AGIs $75k-100k, 0.1% for AGIs $100k-200k)
Ordinary dividends: $1,267 (reported on 10.3% of returns)
Here:
$1,267
State:
$5,821
(% of AGI for various income ranges: 0.7% for AGIs below $25k, 0.3% for AGIs $25k-50k, 0.2% for AGIs $50k-75k, 0.7% for AGIs $75k-100k)
Profit/loss from business: +$7,875 (reported on 17.2% of returns)
Here:
+$7,875
State:
+$12,773
(% of AGI for various income ranges: 12.7% for AGIs below $25k, 2.8% for AGIs $25k-50k, 1.7% for AGIs $50k-75k, 3.1% for AGIs $75k-100k)
Taxable individual retirement arrangement distribution: $8,225 (reported on 6.9% of returns)
43748:
$8,225
Ohio:
$14,511
(% of AGI for various income ranges: 2.1% for AGIs $25k-50k, 3.5% for AGIs $50k-75k)
Total itemized deductions: $15,510 (25% of AGI, reported on 17.2% of returns)
Here:
$15,510
State:
$21,278
Here:
25.0% of AGI
State:
18.8% of AGI
(% of AGI for various income ranges: 4.8% for AGIs below $25k, 5.6% for AGIs $25k-50k, 7.4% for AGIs $50k-75k, 10.2% for AGIs $75k-100k, 8.1% for AGIs $100k-200k)
Charity contributions: $2,292 (reported on 11.2% of returns)
Here:
$2,292
State:
$3,943
(% of AGI for various income ranges: 0.7% for AGIs $25k-50k, 0.9% for AGIs $50k-75k, 0.6% for AGIs $75k-100k, 1.2% for AGIs $100k-200k)
Taxes paid: $4,760 (reported on 17.2% of returns)
43748:
$4,760
State:
$9,568
(% of AGI for various income ranges: 0.7% for AGIs below $25k, 1.4% for AGIs $25k-50k, 2.1% for AGIs $50k-75k, 4.0% for AGIs $75k-100k, 3.1% for AGIs $100k-200k)
Earned income credit: $2,332 (reported on 24.1% of returns)
Here:
$2,332
State:
$2,285
(% of AGI for various income ranges: 8.4% for AGIs below $25k, 1.1% for AGIs $25k-50k)
Percentage of individuals using paid preparers for their 2012 taxes: 44.0%
Here:
44%
State:
51%
(% for various income ranges: 40.0% for AGIs below $25k, 40.6% for AGIs $25k-50k, 52.6% for AGIs $50k-75k, 50.0% for AGIs $75k-100k, 60.0% for AGIs $100k-200k)
Averages for the 2004 tax year for zip code 43748, filed in 2005:
Average Adjusted Gross Income (AGI) in 2004: $32,292 (Individual Income Tax Returns)
Here:
$32,292
State:
$44,480
Salary/wage: $29,859 (reported on 89.0% of returns)
Here:
$29,859
State:
$39,198
(% of AGI for various income ranges: 99.9% for AGIs below $10k, 82.5% for AGIs $10k-25k, 87.9% for AGIs $25k-50k, 88.5% for AGIs $50k-75k, 84.2% for AGIs $75k-100k, 35.0% for AGIs over 100k)
Taxable interest for individuals: $1,062 (reported on 31.6% of returns)
This zip code:
$1,062
Ohio:
$1,532
(% of AGI for various income ranges: 4.1% for AGIs below $10k, 1.1% for AGIs $10k-25k, 0.7% for AGIs $25k-50k, 1.2% for AGIs $50k-75k, 0.6% for AGIs $75k-100k, 1.5% for AGIs over 100k)
Taxable dividends: $2,115 (reported on 11.5% of returns)
Here:
$2,115
State:
$3,496
(% of AGI for various income ranges: 0.4% for AGIs below $10k, 0.4% for AGIs $10k-25k, 0.7% for AGIs $25k-50k, 0.3% for AGIs $50k-75k, 0.1% for AGIs $75k-100k, 3.9% for AGIs over 100k)
Net capital gain/loss: +$8,737 (reported on 8.4% of returns)
Here:
+$8,737
State:
+$8,582
(% of AGI for various income ranges: 2.7% for AGIs below $10k, 0.1% for AGIs $25k-50k, 0.4% for AGIs $50k-75k, 0.2% for AGIs $75k-100k, 22.2% for AGIs over 100k)
Profit/loss from business: +$6,676 (reported on 16.1% of returns)
Here:
+$6,676
State:
+$10,813
(% of AGI for various income ranges: 17.2% for AGIs below $10k, 6.2% for AGIs $10k-25k, 3.2% for AGIs $25k-50k, 0.4% for AGIs $50k-75k, 6.6% for AGIs $75k-100k)
IRA payment deduction: $2,040 (reported on 2.2% of returns)
43748:
$2,040
Ohio:
$2,794
Total itemized deductions: $12,968 (24% of AGI, reported on 19.7% of returns)
Here:
$12,968
State:
$17,503
Here:
24.0% of AGI
State:
20.8% of AGI
(% of AGI for various income ranges: 7.0% for AGIs $10k-25k, 8.4% for AGIs $25k-50k, 8.4% for AGIs $50k-75k, 7.4% for AGIs $75k-100k, 8.6% for AGIs over 100k)
Charity contributions deductions: $1,710 (3% of AGI, reported on 14.4% of returns)
Here:
$1,710
State:
$3,087
Here:
3.0% of AGI
State:
3.4% of AGI
(% of AGI for various income ranges: 0.8% for AGIs $10k-25k, 0.9% for AGIs $25k-50k, 0.6% for AGIs $50k-75k, 0.4% for AGIs $75k-100k, 1.3% for AGIs over 100k)
Total tax: $3,439 (reported on 73.0% of returns)
43748:
$3,439
State:
$6,781
(% of AGI for various income ranges: 3.6% for AGIs below $10k, 4.6% for AGIs $10k-25k, 5.8% for AGIs $25k-50k, 7.9% for AGIs $50k-75k, 11.4% for AGIs $75k-100k, 16.7% for AGIs over 100k)
Earned income credit: $1,782 (reported on 18.7% of returns)
Here:
$1,782
State:
$1,696
Percentage of individuals using paid preparers for their 2004 taxes: 49.9%
Here:
50%
State:
55%
(% for various income ranges: 40.5% for AGIs below $10k, 48.9% for AGIs $10k-25k, 51.4% for AGIs $25k-50k, 53.3% for AGIs $50k-75k, 59.2% for AGIs $75k-100k, 87.5% for AGIs over 100k)
Household received Food Stamps/SNAP in the past 12 months: 215 Household did not receive Food Stamps/SNAP in the past 12 months: 925
Women who had a birth in the past 12 months: 18 (4 now married, 14 unmarried) Women who did not have a birth in the past 12 months: 617 (248 now married, 368 unmarried)
Housing units in zip code 43748 with a mortgage: 414 (20 second mortgage, 13 both second mortgage and home equity loan) Houses without a mortgage: 6
Median monthly owner costs for units with a mortgage: $1,227 Median monthly owner costs for units without a mortgage: $471
Residents with income below the poverty level in 2022:
This zip code:
18.3%
Whole state:
13.4%
Residents with income below 50% of the poverty level in 2022:
This zip code:
11.9%
Whole state:
7.0%
Median number of rooms in houses and condos:
Here:
6.4
State:
6.7
Median number of rooms in apartments:
Here:
4.6
State:
4.4
Notable locations in this zip code not listed on our city pages
Notable locations in zip code 43748: Five Points (A), Ohio State Penitentiary Junction City Branch (B), Pine View Tree Farm (C), Junction City Volunteer Fire Department (D). Display/hide their locations on the map
Churches in zip code 43748 include: Mount Zion United Brethren in Christ Church (A), Friendship Church (B), Bethel Church (C), Old Zion United Brethren Church (D), New Lebanon Evangelical Lutheran Church (E), Saint Patricks Church (F). Display/hide their locations on the map
Cemeteries: Harvey Cemetery (1), Bethel Cemetery (2), Friendship Methodist Episcopal Cemetery (3), Mount Zion United Brethren In Christ Cemetery (4), New Lebanon Evangelical Lutheran Cemetery (5), Old Zion United Brethren Cemetery (6), Saint Patricks Cemetery (7). Display/hide their locations on the map
Streams, rivers, and creeks: Dry Run (A), Salem Run (B), Lideys Run (C), Turkey Run (D), Center Branch Rush Creek (E). Display/hide their locations on the map
Size of family households: 281 2-persons, 160 3-persons, 190 4-persons, 69 5-persons, 106 6-persons, 3 7-or-more-persons
Size of nonfamily households: 258 1-person, 42 2-persons, 20 3-persons
597 married couples with children.
338 single-parent households (259 men, 79 women).
85.4% of residents of 43748 zip code speak English at home.
12.6% of residents speak Spanish at home (100% very well).
1.2% of residents speak other Indo-European language at home (100% well).
0.1% of residents speak Asian or Pacific Island language at home (100% very well).
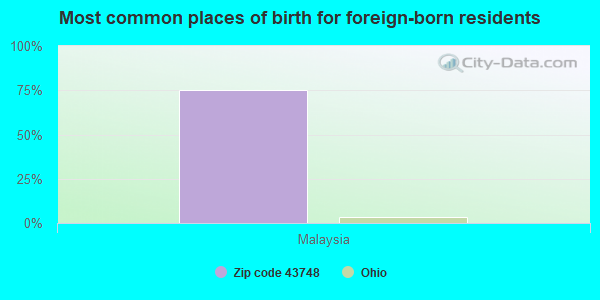
Foreign born population: 4 (0.1%) (100.0% of them are naturalized citizens)
This zip code:
0.1%
Whole state:
5.0%
75%Malaysia
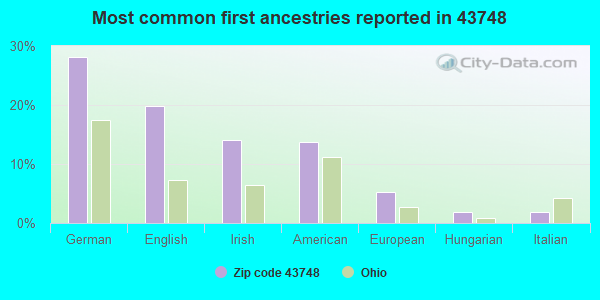
28%German
20%English
14%Irish
14%American
5%European
2%Hungarian
2%Italian
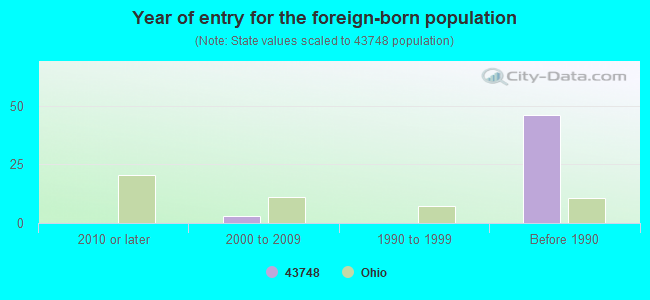
Year of entry for the foreign-born population
02010 or later
32000 to 2009
01990 to 1999
46Before 1990
Facilities with environmental interests located in this zip code:
ASHLAND BRANDED MARKETING (301 W MAIN ST in JUNCTION CITY, OH)
(Resource Conservation and Recovery Act (tracking hazardous waste))
Housing units lacking complete plumbing facilities: 2.8% Housing units lacking complete kitchen facilities: 3.4%
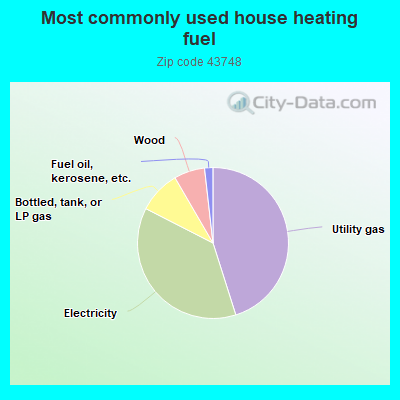
45.2%Utility gas
37.5%Electricity
9.1%Bottled, tank, or LP gas
6.6%Wood
1.8%Fuel oil, kerosene, etc.
Population in 1990: 2,577. Population change in the 1990s: +191 (+7.4%).
Place of birth for U.S.-born residents:
This state: 2,552
Northeast: 102
Midwest: 61
South: 233
West: 6
64% of the 43748 zip code residents lived in the same house 5 years ago. Out of people who lived in different houses, 53% lived in this county. Out of people who lived in different counties, 50% lived in Ohio.
98% of the 43748 zip code residents lived in the same house 1 year ago. Out of people who lived in different houses, 106% moved from this county. Out of people who lived in different houses, 15% moved from different county within same state. Out of people who lived in different houses, 6% moved from different state.
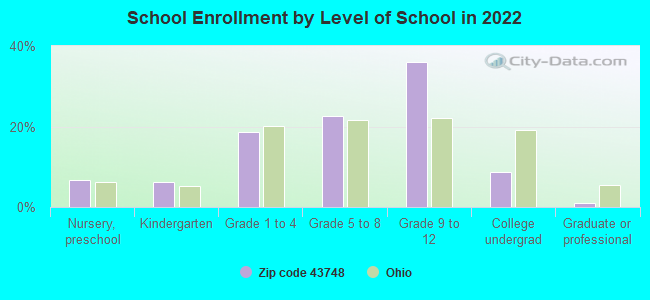
Private vs. public school enrollment:
Students in private schools in grades 1 to 8 (elementary and middle school): 33
Here:
8.8%
Ohio:
16.0%
Students in private schools in grades 9 to 12 (high school):
Here:
0.0%
Ohio:
13.1%
Students in private undergraduate colleges: 8
Here:
10.2%
Ohio:
22.3%
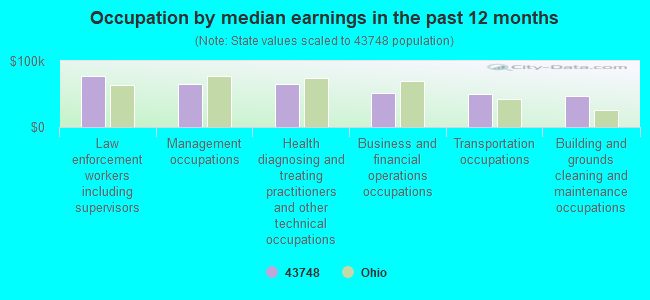
Occupation by median earnings in the past 12 months ($)
76,690Law enforcement workers including supervisors
65,274Management occupations
64,777Health diagnosing and treating practitioners and other technical occupations
50,909Business and financial operations occupations
49,806Transportation occupations
47,432Building and grounds cleaning and maintenance occupations
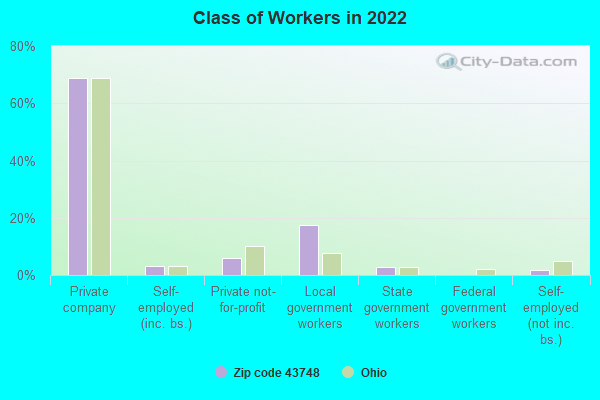
Top industries in this zip code by the number of employees in 2005:
Finance and Insurance: Commercial Banking (5-9: 1)
Fatal accident statistics in 2014:
Fatal accident count: 1
Vehicles involved in fatal accidents: 2
Fatal accidents caused by drunken drivers: 0
Fatalities: 1
Persons involved in fatal accidents: 3
Pedestrians involved in fatal accidents: 0
Fatal accident statistics in 2011:
Fatal accident count: 1
Vehicles involved in fatal accidents: 1
Fatal accidents caused by drunken drivers: 1
Fatalities: 1
Persons involved in fatal accidents: 1
Pedestrians involved in fatal accidents: 0
2002 - 2018 National Fire Incident Reporting System (NFIRS) incidents
Based on the data from the years 2002 - 2018 the average number of fire incidents per year is 26. The highest number of reported fires - 42 took place in 2009, and the least - 10 in 2013. The data has a growing trend.
When looking into fire subcategories, the most reports belonged to: Structure Fires (51.0%), and Outside Fires (36.3%).
Fire incident types reported to NFIRS in Zip Code 43748
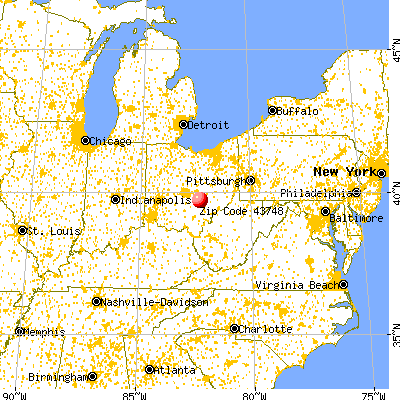


 Nearest zip codes: 43107, 43766, 43783, 43764, 43782, 43150.


 Based on the data from the years 2002 - 2018 the average number of fire incidents per year is 26. The highest number of reported fires - 42 took place in 2009, and the least - 10 in 2013. The data has a growing trend.
 When looking into fire subcategories, the most reports belonged to: Structure Fires (51.0%), and Outside Fires (36.3%).