Estimated zip code population in 2022: 2,048 Zip code population in 2010: 2,070 Zip code population in 2000: 1,744
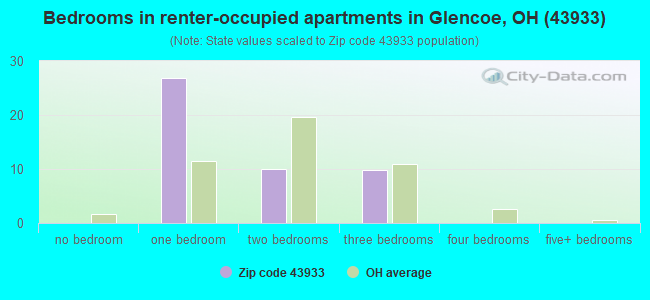
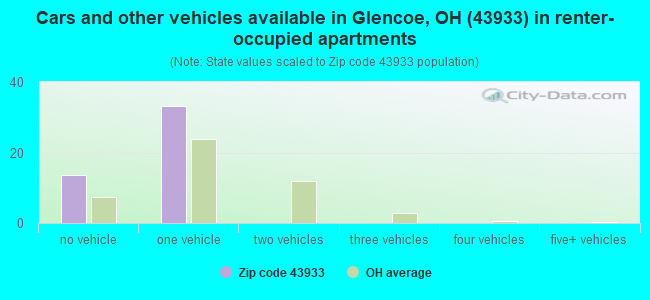
Houses and condos: 1,026 Renter-occupied apartments: 46
% of renters here:
5%
State:
33%
March 2022 cost of living index in zip code 43933: 81.2 (low, U.S. average is 100)
Land area: 47.6 sq. mi. Water area: 0.4 sq. mi.
Population density: 43 people per square mile
(very low).
OSM Map
General Map
Google Map
MSN Map
OSM Map
General Map
Google Map
MSN Map
OSM Map
General Map
Google Map
MSN Map
OSM Map
General Map
Google Map
MSN Map
Please wait while loading the map...
Real estate property taxes paid for housing units in 2022:
This zip code:
1.0% ($1,650)
Ohio:
1.3% ($2,639)
Median real estate property taxes paid for housing units with mortgages in 2022: $1,797 (0.8%) Median real estate property taxes paid for housing units with no mortgage in 2022: $1,478 (1.2%)
Business Search- 14 Million verified businesses
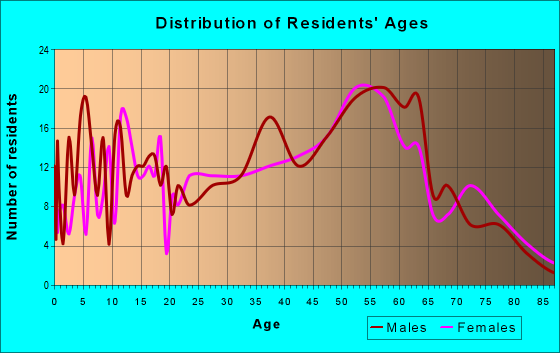
Males: 1,006
(49.1%)
Females: 1,042
(50.9%)
For population 25 years and over in 43933:
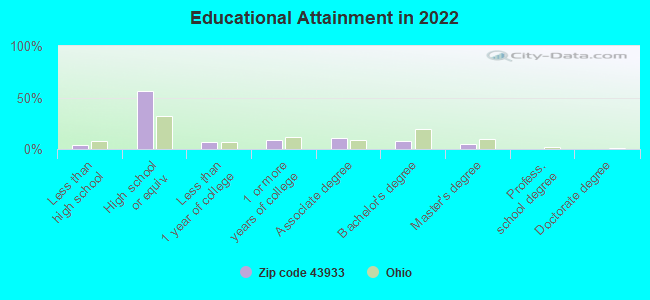
High school or higher: 95.0%
Bachelor's degree or higher: 12.7%
Graduate or professional degree: 5.0%
Unemployed: 4.9%
Mean travel time to work (commute): 30.8 minutes
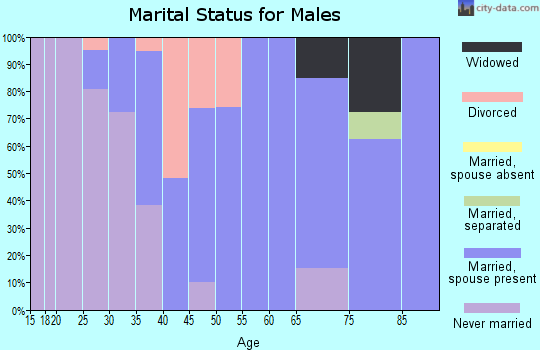
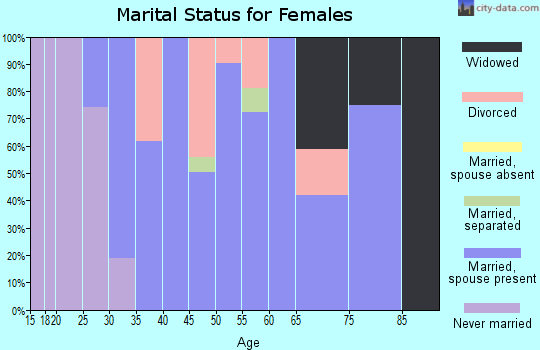
For population 15 years and over in 43933:
Never married: 26.8%
Now married: 59.3%
Separated: 2.1%
Widowed: 7.1%
Divorced: 4.6%
Zip code 43933 compared to state average:
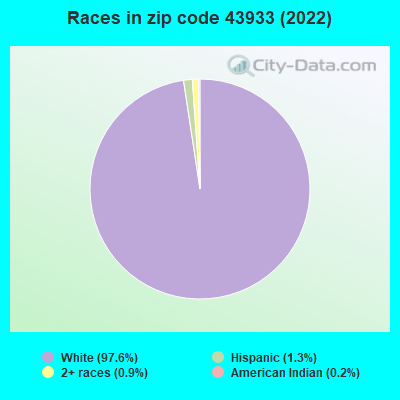
Black race population percentage significantly below state average.
Hispanic race population percentage significantly below state average.
Median age significantly above state average.
Foreign-born population percentage significantly below state average.
Renting percentage significantly below state average.
Length of stay since moving in significantly above state average.
Number of college students significantly below state average.
Percentage of population with a bachelor's degree or higher below state average.
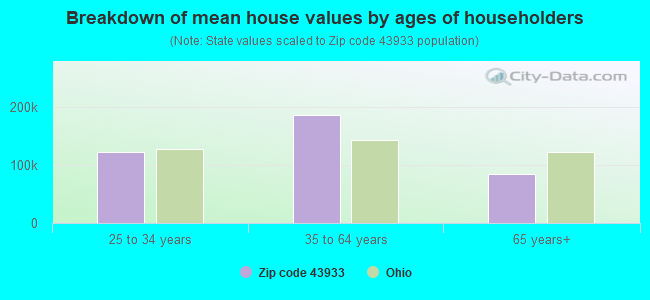
Estimated median house/condo value in 2022: $168,803
43933:
$168,803
Ohio:
$204,100
According to our research of Ohio and other state lists, there were 2 registered sex offenders living in 43933 zip code as of April 26, 2024. The ratio of all residents to sex offenders in zip code 43933 is 1,024 to 1. The ratio of registered sex offenders to all residents in this zip code is lower than the state average.
Median resident age:
This zip code:
49.8 years
Ohio median age:
39.9 years
Average household size:
This zip code:
2.3 people
Ohio:
2.4 people
Averages for the 2020 tax year for zip code 43933, filed in 2021:
Average Adjusted Gross Income (AGI) in 2020: $58,138 (Individual Income Tax Returns)
Here:
$58,138
State:
$67,288
Salary/wage: $47,755 (reported on 73.3% of returns)
Here:
$47,755
State:
$55,628
(% of AGI for various income ranges: 981.8% for AGIs below $25k, 3367.8% for AGIs $25k-50k, 5785.0% for AGIs $50k-75k, 8222.9% for AGIs $75k-100k, 16792.9% for AGIs $100k-200k)
Taxable interest for individuals: $628 (reported on 27.8% of returns)
This zip code:
$628
Ohio:
$1,518
(% of AGI for various income ranges: 2.7% for AGIs below $25k, 12.8% for AGIs $25k-50k, 24.0% for AGIs $50k-75k, 35.7% for AGIs $75k-100k, 112.9% for AGIs $100k-200k)
Ordinary dividends: $3,092 (reported on 13.3% of returns)
Here:
$3,092
State:
$7,167
(% of AGI for various income ranges: 52.2% for AGIs $25k-50k, 61.4% for AGIs $75k-100k, 334.3% for AGIs $100k-200k)
Net capital gain/loss in AGI: +$4,464 (reported on 12.2% of returns)
Here:
+$4,464
State:
+$18,919
(% of AGI for various income ranges: 31.4% for AGIs below $25k, 95.0% for AGIs $50k-75k, 467.1% for AGIs $100k-200k)
Profit/loss from business: +$5,171 (reported on 7.8% of returns)
Here:
+$5,171
State:
+$13,744
(% of AGI for various income ranges: 186.1% for AGIs $25k-50k, 38.6% for AGIs $75k-100k)
Taxable individual retirement arrangement distribution: $10,275 (reported on 8.9% of returns)
43933:
$10,275
Ohio:
$18,876
(% of AGI for various income ranges: 250.6% for AGIs $25k-50k, 530.0% for AGIs $75k-100k)
Earned income credit: $2,425 (reported on 13.3% of returns)
Here:
$2,425
State:
$2,304
(% of AGI for various income ranges: 70.0% for AGIs below $25k, 76.1% for AGIs $25k-50k)
Percentage of individuals using paid preparers for their 2020 taxes: 96.7%
Here:
97%
State:
94%
(% for various income ranges: 96.4% for AGIs below $25k, 96.0% for AGIs $25k-50k, 100.0% for AGIs $50k-75k, 100.0% for AGIs $75k-100k, 90.9% for AGIs $100k-200k, 100.0% for AGIs over 200k)
Averages for the 2012 tax year for zip code 43933, filed in 2013:
Average Adjusted Gross Income (AGI) in 2012: $52,668 (Individual Income Tax Returns)
Here:
$52,668
State:
$54,926
Salary/wage: $40,556 (reported on 86.7% of returns)
Here:
$40,556
State:
$45,869
(% of AGI for various income ranges: 79.8% for AGIs below $25k, 77.6% for AGIs $25k-50k, 80.0% for AGIs $50k-75k, 82.7% for AGIs $75k-100k, 43.4% for AGIs $100k-200k)
Taxable interest for individuals: $392 (reported on 28.9% of returns)
This zip code:
$392
Ohio:
$1,297
(% of AGI for various income ranges: 0.3% for AGIs below $25k, 0.4% for AGIs $25k-50k, 0.2% for AGIs $50k-75k, 0.1% for AGIs $75k-100k, 0.1% for AGIs $100k-200k)
Ordinary dividends: $1,210 (reported on 11.1% of returns)
Here:
$1,210
State:
$5,821
(% of AGI for various income ranges: 0.4% for AGIs $25k-50k, 0.6% for AGIs $50k-75k, 0.2% for AGIs $100k-200k)
Net capital gain/loss in AGI: +$640 (reported on 5.6% of returns)
Here:
+$640
State:
+$11,232
(% of AGI for various income ranges: 0.3% for AGIs $50k-75k)
Profit/loss from business: +$3,629 (reported on 7.8% of returns)
Here:
+$3,629
State:
+$12,773
(% of AGI for various income ranges: 0.9% for AGIs below $25k, 1.1% for AGIs $25k-50k, 1.3% for AGIs $50k-75k)
Taxable individual retirement arrangement distribution: $6,583 (reported on 6.7% of returns)
43933:
$6,583
Ohio:
$14,511
(% of AGI for various income ranges: 4.8% for AGIs below $25k, 2.0% for AGIs $50k-75k)
Total itemized deductions: $18,927 (16% of AGI, reported on 12.2% of returns)
Here:
$18,927
State:
$21,278
Here:
16.1% of AGI
State:
18.8% of AGI
(% of AGI for various income ranges: 9.5% for AGIs $25k-50k, 4.9% for AGIs $75k-100k, 5.3% for AGIs $100k-200k)
Charity contributions: $2,486 (reported on 7.8% of returns)
Here:
$2,486
State:
$3,943
(% of AGI for various income ranges: 0.9% for AGIs $50k-75k, 0.5% for AGIs $100k-200k)
Taxes paid: $7,870 (reported on 11.1% of returns)
43933:
$7,870
State:
$9,568
(% of AGI for various income ranges: 1.6% for AGIs $25k-50k, 1.4% for AGIs $75k-100k, 3.1% for AGIs $100k-200k)
Earned income credit: $1,881 (reported on 17.8% of returns)
Here:
$1,881
State:
$2,285
(% of AGI for various income ranges: 5.3% for AGIs below $25k, 0.9% for AGIs $25k-50k)
Percentage of individuals using paid preparers for their 2012 taxes: 53.3%
Here:
53%
State:
51%
(% for various income ranges: 48.5% for AGIs below $25k, 47.8% for AGIs $25k-50k, 56.2% for AGIs $50k-75k, 66.7% for AGIs $75k-100k, 66.7% for AGIs $100k-200k)
Averages for the 2004 tax year for zip code 43933, filed in 2005:
Average Adjusted Gross Income (AGI) in 2004: $32,555 (Individual Income Tax Returns)
Here:
$32,555
State:
$44,480
Salary/wage: $31,681 (reported on 89.1% of returns)
Here:
$31,681
State:
$39,198
(% of AGI for various income ranges: 107.2% for AGIs below $10k, 80.3% for AGIs $10k-25k, 89.5% for AGIs $25k-50k, 89.0% for AGIs $50k-75k, 87.8% for AGIs $75k-100k, 68.3% for AGIs over 100k)
Taxable interest for individuals: $665 (reported on 37.7% of returns)
This zip code:
$665
Ohio:
$1,532
(% of AGI for various income ranges: 1.7% for AGIs below $10k, 1.7% for AGIs $10k-25k, 0.8% for AGIs $25k-50k, 0.5% for AGIs $50k-75k, 0.4% for AGIs $75k-100k, 0.1% for AGIs over 100k)
Taxable dividends: $618 (reported on 11.5% of returns)
Here:
$618
State:
$3,496
(% of AGI for various income ranges: 0.4% for AGIs below $10k, 0.5% for AGIs $10k-25k, 0.2% for AGIs $25k-50k, 0.2% for AGIs $50k-75k, 0.2% for AGIs $75k-100k)
Net capital gain/loss: +$1,840 (reported on 5.6% of returns)
Here:
+$1,840
State:
+$8,582
(% of AGI for various income ranges: -1.7% for AGIs below $10k, 0.2% for AGIs $10k-25k, -0.0% for AGIs $50k-75k, 2.3% for AGIs $75k-100k)
Profit/loss from business: +$2,866 (reported on 7.6% of returns)
Here:
+$2,866
State:
+$10,813
(% of AGI for various income ranges: 15.9% for AGIs below $10k, 2.2% for AGIs $10k-25k, -0.2% for AGIs $50k-75k)
IRA payment deduction: $2,000 (reported on 1.4% of returns)
43933:
$2,000
Ohio:
$2,794
Total itemized deductions: $13,720 (23% of AGI, reported on 11.3% of returns)
Here:
$13,720
State:
$17,503
Here:
23.1% of AGI
State:
20.8% of AGI
Charity contributions deductions: $1,394 (2% of AGI, reported on 7.4% of returns)
Here:
$1,394
State:
$3,087
Here:
2.3% of AGI
State:
3.4% of AGI
Total tax: $3,236 (reported on 74.9% of returns)
43933:
$3,236
State:
$6,781
(% of AGI for various income ranges: 3.5% for AGIs below $10k, 3.9% for AGIs $10k-25k, 6.1% for AGIs $25k-50k, 8.5% for AGIs $50k-75k, 10.6% for AGIs $75k-100k, 11.7% for AGIs over 100k)
Earned income credit: $1,622 (reported on 17.6% of returns)
Here:
$1,622
State:
$1,696
Percentage of individuals using paid preparers for their 2004 taxes: 53.4%
Here:
53%
State:
55%
(% for various income ranges: 42.6% for AGIs below $10k, 55.0% for AGIs $10k-25k, 57.7% for AGIs $25k-50k, 56.6% for AGIs $50k-75k, 68.0% for AGIs $75k-100k)
Churches in zip code 43933 include: Bethel Church (A), Concord Church (B), Dover Church (C), Pleasant Hill Church (D), United Holiness Church (E). Display/hide their locations on the map
Cemeteries: Armstrongs Cemetery (1), Scatterday Cemetery (2), Vallonia Area Cemetery (3), Pleasant Hill Cemetery (4), Key Cemetery (5), Jacobsburg Cemetery (6), Grandview Cemetery (7). Display/hide their locations on the map
Streams, rivers, and creeks: Bend Fork (A), Anderson Run (B), Pea Vine Creek (C), Moore Run (D), Cumberland Run (E). Display/hide their locations on the map
Size of family households: 348 2-persons, 97 3-persons, 84 4-persons, 47 5-persons
Size of nonfamily households: 269 1-person, 42 2-persons
286 married couples with children.
0 single-parent households ().
100.4% of residents of 43933 zip code speak English at home.
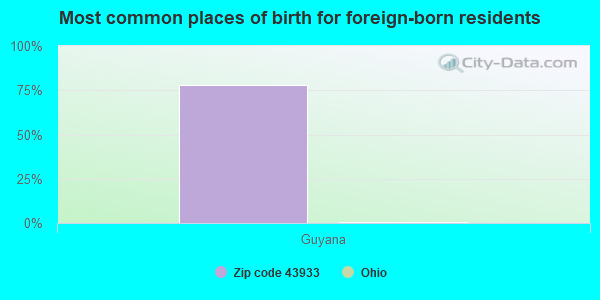
Foreign born population: 27 (1.4%) (100.0% of them are naturalized citizens)
This zip code:
1.4%
Whole state:
5.0%
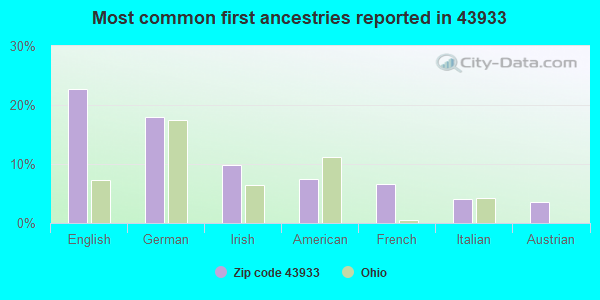
78%Guyana
23%English
18%German
10%Irish
7%American
7%French
4%Italian
4%Austrian
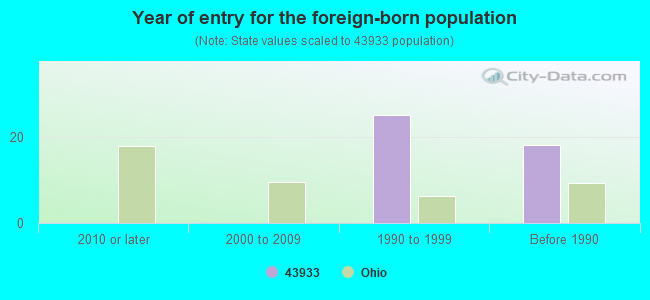
Year of entry for the foreign-born population
02010 or later
02000 to 2009
251990 to 1999
18Before 1990
Facilities with environmental interests located in this zip code:
BOSTON S STORE (48141 MAIN ST in ARMSTRONG MILLS, OH)
STATE MASTER (Ohio general info) - AIR MAJOR (Resource Conservation and Recovery Act (tracking hazardous waste)) Organizations: DOROTHY GODDARD (CONTACT/OWNER)
Alternative names: BOSTON'S STORE
Housing units lacking complete plumbing facilities: 8.6% Housing units lacking complete kitchen facilities: 7.7%
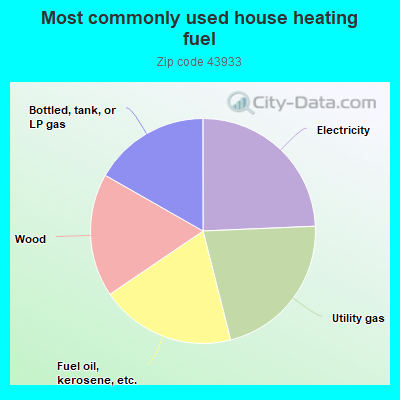
24.4%Electricity
21.8%Utility gas
19.5%Fuel oil, kerosene, etc.
17.8%Wood
16.8%Bottled, tank, or LP gas
Population in 1990: 1,795.
Place of birth for U.S.-born residents:
This state: 1,031
Northeast: 119
Midwest: 44
South: 664
West: 128
79% of the 43933 zip code residents lived in the same house 5 years ago. Out of people who lived in different houses, 67% lived in this county. Out of people who lived in different counties, 50% lived in Ohio.
97% of the 43933 zip code residents lived in the same house 1 year ago. Out of people who lived in different houses, 83% moved from this county. Out of people who lived in different houses, 38% moved from abroad.
Private vs. public school enrollment:
Students in private schools in grades 1 to 8 (elementary and middle school): 30
Here:
19.0%
Ohio:
16.0%
Students in private schools in grades 9 to 12 (high school):
Here:
0.0%
Ohio:
13.1%
Students in private undergraduate colleges: 23
Here:
100.0%
Ohio:
22.3%
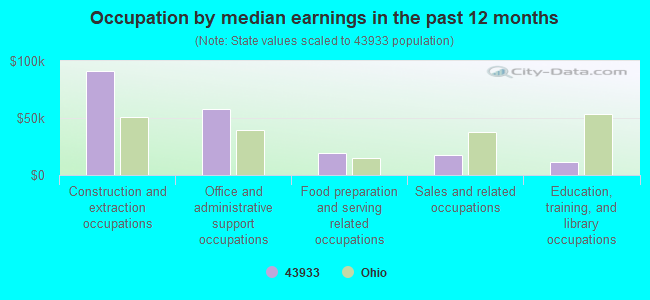
Occupation by median earnings in the past 12 months ($)
91,034Construction and extraction occupations
57,711Office and administrative support occupations
19,338Food preparation and serving related occupations
17,860Sales and related occupations
11,071Education, training, and library occupations
Top industries in this zip code by the number of employees in 2005:
Other Services (except Public Administration): General Automotive Repair (10-19 employees: 1 establishment)
Construction: New Single-Family Housing Construction (except Operative Builders) (5-9: 1, 1-4: 1)
Construction: Site Preparation Contractors (5-9: 1)
Construction: Power and Communication Line and Related Structures Construction (1-4: 1)
Arts, Entertainment, and Recreation: Golf Courses and Country Clubs (1-4: 1)
Construction: Drywall and Insulation Contractors (1-4: 1)
Fatal accident statistics in 2013:
Fatal accident count: 1
Vehicles involved in fatal accidents: 1
Fatal accidents caused by drunken drivers: 0
Fatalities: 1
Persons involved in fatal accidents: 1
Pedestrians involved in fatal accidents: 1
Fatal accident statistics in 2012:
Fatal accident count: 1
Vehicles involved in fatal accidents: 1
Fatal accidents caused by drunken drivers: 1
Fatalities: 1
Persons involved in fatal accidents: 2
Pedestrians involved in fatal accidents: 0
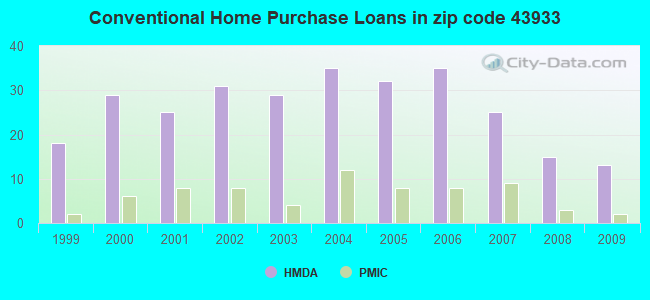
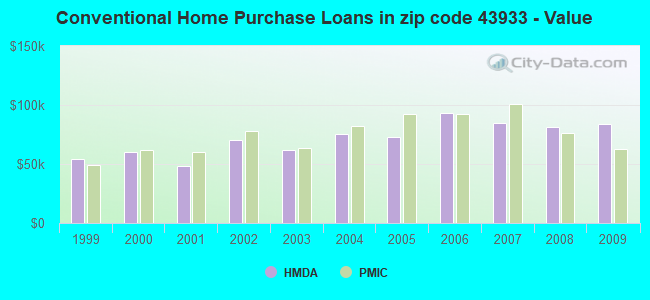
Home Mortgage Disclosure Act Aggregated Statistics For Year 2009 (Based on 4 partial tracts)
A) FHA, FSA/RHS & VA Home Purchase Loans
B) Conventional Home Purchase Loans
C) Refinancings
D) Home Improvement Loans
F) Non-occupant Loans on < 5 Family Dwellings (A B C & D)
G) Loans On Manufactured Home Dwelling (A B C & D)
Number
Average Value
Number
Average Value
Number
Average Value
Number
Average Value
Number
Average Value
Number
Average Value
LOANS ORIGINATED
10
$94,441
13
$84,297
37
$96,534
12
$26,725
1
$99,850
4
$47,172
APPLICATIONS APPROVED, NOT ACCEPTED
1
$32,350
2
$105,115
2
$29,490
0
$0
0
$0
1
$33,220
APPLICATIONS DENIED
2
$99,495
4
$90,682
19
$81,484
11
$21,436
1
$19,530
1
$1,220
APPLICATIONS WITHDRAWN
2
$55,200
4
$120,998
9
$107,681
0
$0
0
$0
0
$0
FILES CLOSED FOR INCOMPLETENESS
0
$0
0
$0
3
$107,597
0
$0
0
$0
0
$0
Aggregated Statistics For Year 2008 (Based on 4 partial tracts)
A) FHA, FSA/RHS & VA Home Purchase Loans
B) Conventional Home Purchase Loans
C) Refinancings
D) Home Improvement Loans
F) Non-occupant Loans on < 5 Family Dwellings (A B C & D)
G) Loans On Manufactured Home Dwelling (A B C & D)
Number
Average Value
Number
Average Value
Number
Average Value
Number
Average Value
Number
Average Value
Number
Average Value
LOANS ORIGINATED
7
$77,483
15
$81,716
36
$74,795
15
$40,189
3
$29,987
6
$72,022
APPLICATIONS APPROVED, NOT ACCEPTED
1
$125,910
2
$67,010
2
$65,410
1
$29,910
0
$0
1
$86,070
APPLICATIONS DENIED
5
$67,586
13
$93,542
38
$102,960
9
$25,557
1
$66,610
10
$90,844
APPLICATIONS WITHDRAWN
2
$81,310
3
$81,620
8
$104,982
2
$68,180
0
$0
2
$67,235
FILES CLOSED FOR INCOMPLETENESS
1
$25,640
0
$0
2
$96,550
1
$51,880
0
$0
0
$0
Aggregated Statistics For Year 2007 (Based on 4 partial tracts)
A) FHA, FSA/RHS & VA Home Purchase Loans
B) Conventional Home Purchase Loans
C) Refinancings
D) Home Improvement Loans
F) Non-occupant Loans on < 5 Family Dwellings (A B C & D)
G) Loans On Manufactured Home Dwelling (A B C & D)
Number
Average Value
Number
Average Value
Number
Average Value
Number
Average Value
Number
Average Value
Number
Average Value
LOANS ORIGINATED
8
$81,692
25
$84,413
24
$80,688
30
$33,362
5
$61,954
13
$58,143
APPLICATIONS APPROVED, NOT ACCEPTED
1
$108,480
3
$51,053
7
$89,300
2
$32,760
1
$8,550
3
$78,357
APPLICATIONS DENIED
3
$83,153
7
$76,169
59
$100,788
21
$40,769
0
$0
8
$77,865
APPLICATIONS WITHDRAWN
1
$54,330
4
$97,642
16
$107,878
3
$87,403
0
$0
1
$74,890
FILES CLOSED FOR INCOMPLETENESS
0
$0
1
$74,890
1
$127,730
0
$0
0
$0
0
$0
Aggregated Statistics For Year 2006 (Based on 4 partial tracts)
A) FHA, FSA/RHS & VA Home Purchase Loans
B) Conventional Home Purchase Loans
C) Refinancings
D) Home Improvement Loans
F) Non-occupant Loans on < 5 Family Dwellings (A B C & D)
G) Loans On Manufactured Home Dwelling (A B C & D)
Number
Average Value
Number
Average Value
Number
Average Value
Number
Average Value
Number
Average Value
Number
Average Value
LOANS ORIGINATED
5
$75,216
35
$93,353
41
$64,507
30
$29,743
5
$133,876
10
$49,574
APPLICATIONS APPROVED, NOT ACCEPTED
0
$0
6
$82,497
11
$51,015
1
$22,680
1
$88,600
3
$36,560
APPLICATIONS DENIED
3
$60,237
16
$78,831
52
$81,444
19
$47,065
2
$48,655
12
$53,762
APPLICATIONS WITHDRAWN
1
$78,890
2
$137,795
23
$100,222
3
$29,933
1
$36,620
2
$41,810
FILES CLOSED FOR INCOMPLETENESS
0
$0
2
$125,530
7
$108,677
0
$0
0
$0
0
$0
Aggregated Statistics For Year 2005 (Based on 4 partial tracts)
A) FHA, FSA/RHS & VA Home Purchase Loans
B) Conventional Home Purchase Loans
C) Refinancings
D) Home Improvement Loans
F) Non-occupant Loans on < 5 Family Dwellings (A B C & D)
G) Loans On Manufactured Home Dwelling (A B C & D)
Number
Average Value
Number
Average Value
Number
Average Value
Number
Average Value
Number
Average Value
Number
Average Value
LOANS ORIGINATED
7
$65,283
32
$72,472
54
$75,413
25
$22,247
2
$80,270
11
$52,846
APPLICATIONS APPROVED, NOT ACCEPTED
0
$0
4
$95,800
14
$87,119
1
$14,100
0
$0
1
$60,620
APPLICATIONS DENIED
1
$80,570
15
$72,013
58
$81,640
15
$34,081
2
$42,845
9
$67,269
APPLICATIONS WITHDRAWN
0
$0
4
$66,582
27
$96,671
6
$70,505
0
$0
6
$77,290
FILES CLOSED FOR INCOMPLETENESS
1
$96,440
2
$66,955
5
$81,018
0
$0
0
$0
0
$0
Aggregated Statistics For Year 2004 (Based on 4 partial tracts)
A) FHA, FSA/RHS & VA Home Purchase Loans
B) Conventional Home Purchase Loans
C) Refinancings
D) Home Improvement Loans
F) Non-occupant Loans on < 5 Family Dwellings (A B C & D)
G) Loans On Manufactured Home Dwelling (A B C & D)
Number
Average Value
Number
Average Value
Number
Average Value
Number
Average Value
Number
Average Value
Number
Average Value
LOANS ORIGINATED
8
$64,009
35
$75,681
52
$77,701
24
$23,207
4
$72,008
7
$43,893
APPLICATIONS APPROVED, NOT ACCEPTED
0
$0
5
$66,300
16
$79,744
3
$44,803
0
$0
4
$104,058
APPLICATIONS DENIED
3
$61,333
14
$56,304
53
$82,155
13
$33,088
2
$18,830
12
$62,728
APPLICATIONS WITHDRAWN
0
$0
3
$96,033
32
$85,069
3
$24,600
0
$0
3
$59,977
FILES CLOSED FOR INCOMPLETENESS
1
$45,010
0
$0
7
$86,911
2
$30,650
0
$0
0
$0
Aggregated Statistics For Year 2003 (Based on 4 partial tracts)
A) FHA, FSA/RHS & VA Home Purchase Loans
B) Conventional Home Purchase Loans
C) Refinancings
D) Home Improvement Loans
F) Non-occupant Loans on < 5 Family Dwellings (A B C & D)
Number
Average Value
Number
Average Value
Number
Average Value
Number
Average Value
Number
Average Value
LOANS ORIGINATED
6
$68,045
29
$61,509
118
$67,955
23
$17,731
3
$33,360
APPLICATIONS APPROVED, NOT ACCEPTED
1
$41,510
5
$58,048
24
$60,972
4
$28,170
0
$0
APPLICATIONS DENIED
1
$74,170
14
$56,435
58
$71,455
12
$23,900
2
$48,265
APPLICATIONS WITHDRAWN
0
$0
3
$66,833
28
$82,739
1
$25,980
1
$7,320
FILES CLOSED FOR INCOMPLETENESS
3
$49,863
2
$90,025
8
$74,479
0
$0
1
$111,010
Aggregated Statistics For Year 2002 (Based on 4 partial tracts)
A) FHA, FSA/RHS & VA Home Purchase Loans
B) Conventional Home Purchase Loans
C) Refinancings
D) Home Improvement Loans
F) Non-occupant Loans on < 5 Family Dwellings (A B C & D)
Number
Average Value
Number
Average Value
Number
Average Value
Number
Average Value
Number
Average Value
LOANS ORIGINATED
3
$63,593
31
$70,520
101
$63,726
24
$14,731
3
$25,207
APPLICATIONS APPROVED, NOT ACCEPTED
0
$0
4
$45,008
26
$73,909
3
$5,663
0
$0
APPLICATIONS DENIED
1
$46,990
7
$53,223
56
$71,177
8
$21,125
1
$70,450
APPLICATIONS WITHDRAWN
1
$28,690
7
$56,390
26
$72,647
1
$44,240
1
$29,630
FILES CLOSED FOR INCOMPLETENESS
1
$59,820
2
$80,205
12
$78,169
1
$42,570
0
$0
Aggregated Statistics For Year 2001 (Based on 4 partial tracts)
A) FHA, FSA/RHS & VA Home Purchase Loans
B) Conventional Home Purchase Loans
C) Refinancings
D) Home Improvement Loans
F) Non-occupant Loans on < 5 Family Dwellings (A B C & D)
Number
Average Value
Number
Average Value
Number
Average Value
Number
Average Value
Number
Average Value
LOANS ORIGINATED
5
$56,876
25
$48,281
72
$61,022
22
$17,084
3
$29,973
APPLICATIONS APPROVED, NOT ACCEPTED
0
$0
4
$56,478
18
$65,981
3
$15,523
0
$0
APPLICATIONS DENIED
2
$57,480
16
$35,359
41
$60,341
12
$12,981
1
$43,330
APPLICATIONS WITHDRAWN
1
$52,440
5
$73,150
34
$68,487
3
$19,347
0
$0
FILES CLOSED FOR INCOMPLETENESS
0
$0
0
$0
4
$74,180
0
$0
0
$0
Aggregated Statistics For Year 2000 (Based on 4 partial tracts)
A) FHA, FSA/RHS & VA Home Purchase Loans
B) Conventional Home Purchase Loans
C) Refinancings
D) Home Improvement Loans
F) Non-occupant Loans on < 5 Family Dwellings (A B C & D)
Number
Average Value
Number
Average Value
Number
Average Value
Number
Average Value
Number
Average Value
LOANS ORIGINATED
3
$45,647
29
$60,134
38
$49,756
20
$12,396
4
$44,448
APPLICATIONS APPROVED, NOT ACCEPTED
1
$19,530
10
$52,223
14
$45,396
5
$14,268
1
$17,090
APPLICATIONS DENIED
0
$0
27
$35,965
36
$54,486
16
$18,625
1
$31,650
APPLICATIONS WITHDRAWN
0
$0
5
$67,272
36
$53,089
1
$37,230
0
$0
FILES CLOSED FOR INCOMPLETENESS
0
$0
1
$57,990
3
$67,910
1
$15,260
1
$57,990
Aggregated Statistics For Year 1999 (Based on 2 partial tracts)
B) Conventional Home Purchase Loans
C) Refinancings
D) Home Improvement Loans
F) Non-occupant Loans on < 5 Family Dwellings (A B C & D)
Detailed PMIC statistics for the following Tracts:0110.00
, 0112.00
2002 - 2018 National Fire Incident Reporting System (NFIRS) incidents
According to the data from the years 2002 - 2018 the average number of fires per year is 9. The highest number of fire incidents - 25 took place in 2017, and the least - 1 in 2007. The data has a declining trend.
When looking into fire subcategories, the most incidents belonged to: Structure Fires (62.9%), and Outside Fires (27.2%).
Fire incident types reported to NFIRS in Zip Code 43933


 Nearest zip codes: 43902, 43928, 43942, 43947, 43967, 43906.


 According to the data from the years 2002 - 2018 the average number of fires per year is 9. The highest number of fire incidents - 25 took place in 2017, and the least - 1 in 2007. The data has a declining trend.
 When looking into fire subcategories, the most incidents belonged to: Structure Fires (62.9%), and Outside Fires (27.2%).