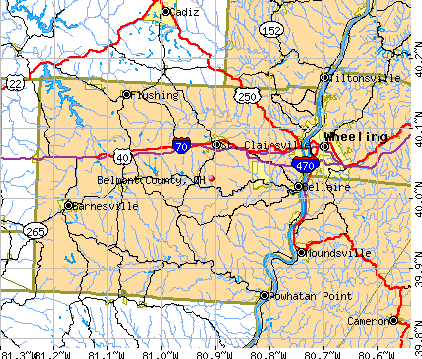
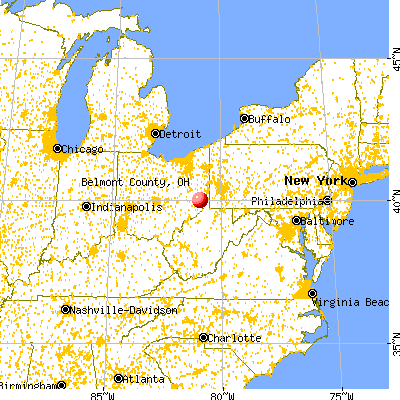
Belmont County, Ohio (OH)
County owner-occupied free and clear houses and condos in 2010: 9,842
County owner-occupied houses and condos in 2000: 21,244
Renter-occupied apartments: 7,674 (it was 7,065 in 2000)
| % of renters here: | 25% |
| State: | 32% |
Land area: 537 sq. mi.
Water area: 4.0 sq. mi.
Population density: 122 people per square mile (average).
Industries providing employment: Educational, health and social services (23.5%), Retail trade (15.8%).
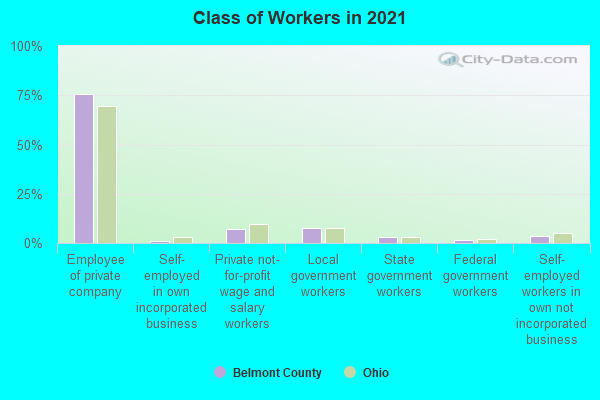
Type of workers:
- Private wage or salary: 84%
- Government: 12%
- Self-employed, not incorporated: 3%
- Unpaid family work: 0%
- OSM Map
- General Map
- Google Map
- MSN Map

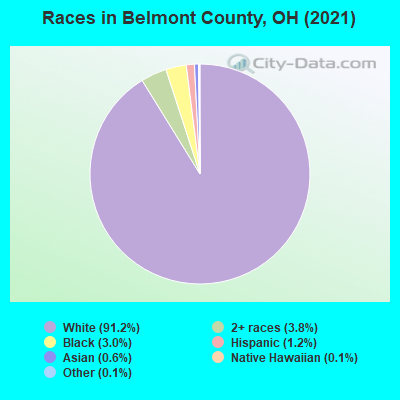
- 60,02590.7%White Non-Hispanic Alone
- 2,8184.3%Two or more races
- 1,9543.0%Black Non-Hispanic Alone
- 8111.2%Hispanic or Latino
- 4200.6%Asian alone
- 650.10%Some other race alone
- 430.06%American Indian and Alaska Native alone
- 350.05%Native Hawaiian and Other
Pacific Islander alone
| Median resident age: | 43.8 years |
| Ohio median age: | 39.9 years |
| Males: 33,150 | |
| Females: 32,359 |

 | Ohio daily reports: hospitalizations and deaths (65 replies) |
| are the oil and gas industry in the Columbus and Cincinnati areas? (5 replies) |
| Ohio Waterways ranked 10th highest in toxic chemicals in US. (70 replies) |
| Does anyone care that Ohio is a toxic dumping ground? (88 replies) |
| give up the good life for Ohio? (21 replies) |
| Florida in Columbus (10 replies) |
| Belmont County: | 2.0 people |
| Ohio: | 2 people |
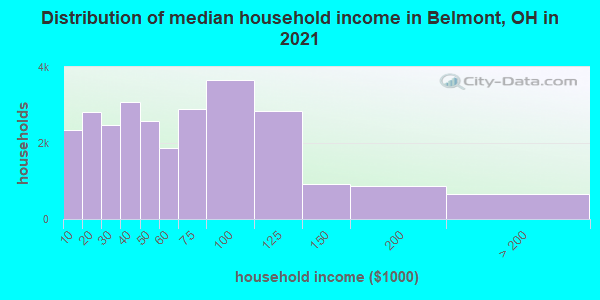
Estimated median household income in 2022: $56,422 ($29,714 in 1999)
| This county: | $56,422 |
| Ohio: | $65,720 |
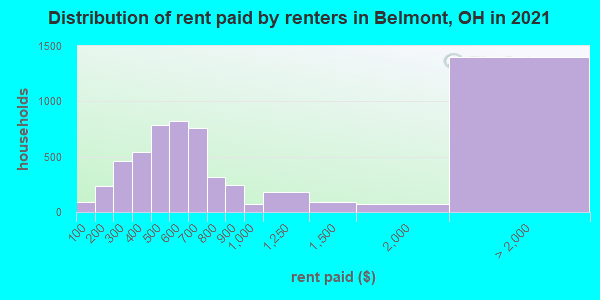
Median contract rent in 2022 for apartments: $566 (lower quartile is $403, upper quartile is $696)
| This county: | $566 |
| State: | $765 |
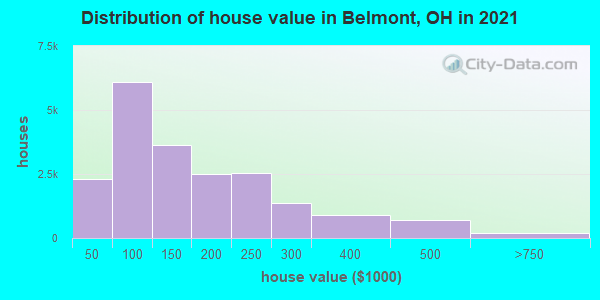
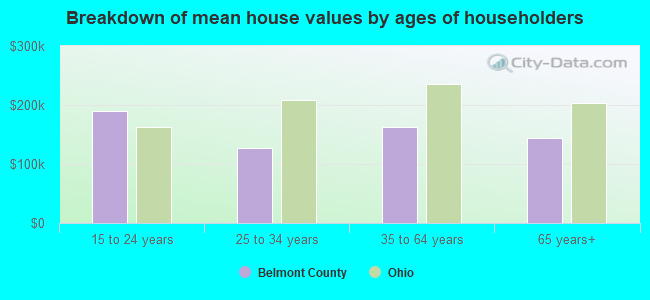
Estimated median house or condo value in 2022: $133,800 (it was $63,300 in 2000)
| Belmont: | $133,800 |
| Ohio: | $204,100 |
Median monthly housing costs for homes and condos with a mortgage: $1,199
Median monthly housing costs for units without a mortgage: $440
Institutionalized population: 3,650
Crime in 2021 (reported by the sheriff's office or county police, not the county total):
- Murders: 2
- Rapes: 5
- Robberies: 0
- Assaults: 37
- Burglaries: 13
- Thefts: 63
- Auto thefts: 2
Crime in 2020 (reported by the sheriff's office or county police, not the county total):
- Murders: 1
- Rapes: 20
- Robberies: 2
- Assaults: 28
- Burglaries: 31
- Thefts: 115
- Auto thefts: 6
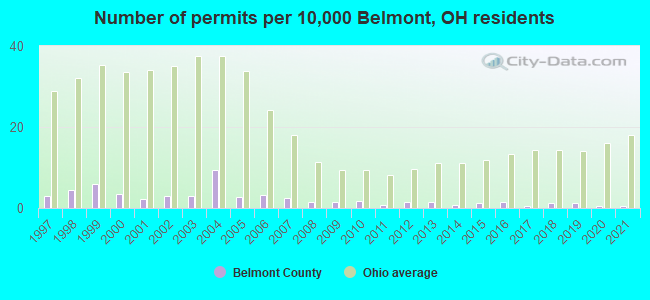
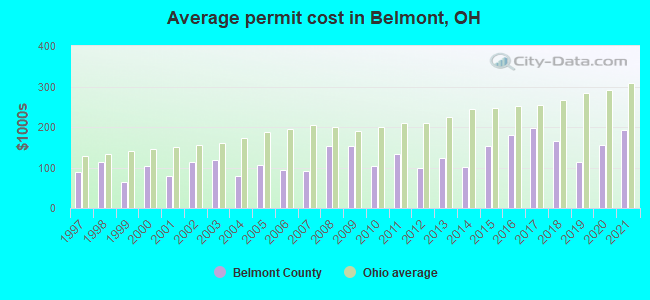
Single-family new house construction building permits:
- 2022: 10 buildings, average cost: $133,800
- 2021: 4 buildings, average cost: $192,500
- 2020: 3 buildings, average cost: $155,000
- 2019: 8 buildings, average cost: $113,300
- 2018: 8 buildings, average cost: $165,900
- 2017: 4 buildings, average cost: $198,300
- 2016: 10 buildings, average cost: $180,100
- 2015: 8 buildings, average cost: $152,700
- 2014: 5 buildings, average cost: $101,600
- 2013: 10 buildings, average cost: $123,700
- 2012: 11 buildings, average cost: $98,600
- 2011: 5 buildings, average cost: $132,800
- 2010: 13 buildings, average cost: $103,500
- 2009: 10 buildings, average cost: $152,200
- 2008: 10 buildings, average cost: $152,500
- 2007: 18 buildings, average cost: $90,800
- 2006: 23 buildings, average cost: $95,400
- 2005: 19 buildings, average cost: $105,700
- 2004: 65 buildings, average cost: $79,100
- 2003: 21 buildings, average cost: $118,600
- 2002: 20 buildings, average cost: $112,700
- 2001: 15 buildings, average cost: $80,200
- 2000: 25 buildings, average cost: $103,800
- 1999: 42 buildings, average cost: $64,700
- 1998: 32 buildings, average cost: $113,900
- 1997: 21 buildings, average cost: $87,900
Median real estate property taxes paid for housing units with mortgages in 2022: $1,553 (0.8%)
Median real estate property taxes paid for housing units with no mortgage in 2022: $1,296 (1.2%)
| Belmont County: | 18.2% |
| Ohio: | 13.4% |
Median age of residents in 2022: 43.8 years old
(Males: 42.4 years old, Females: 46.0 years old)
(Median age for: White residents: 46.0 years old, Black residents: 36.4 years old, Asian residents: 44.6 years old, Hispanic or Latino residents: 37.7 years old, Other race residents: 37.1 years old)
Area name: Wheeling, WV-OH MSA
Fair market rent in 2006 for a 1-bedroom apartment in Belmont County is $394 a month.
Fair market rent for a 2-bedroom apartment is $503 a month.
Fair market rent for a 3-bedroom apartment is $632 a month.
Cities in this county include: Martins Ferry, St. Clairsville, Bellaire, Barnesville, Shadyside, Bridgeport, Powhatan Point, Bethesda, Wolfhurst, Yorkville.
| Zip Code | City | Tests | Max concentration | Min concentration | Arithmetic mean | Geometric mean | Standard deviation | Coefficient of variation | Mean concentration | First quartile | Third quartile |
|---|---|---|---|---|---|---|---|---|---|---|---|
| 43713 | Barnesville | 39 | 17.9 | 0.5 | 5.18 | 3.48 | 4.37 | 84.46 | 4.20 | 1.78 | 7.43 |
| 43718 | Belmont | 19 | 32.4 | 0.1 | 5.65 | 2.09 | 8.39 | 148.48 | 2.10 | 0.90 | 5.18 |
| 43719 | Bethesda | 3 | 14.3 | 2.4 | 9.9 | 7.64 | 6.53 | 65.94 | 13.00 | 1.95 | 13.33 |
| 43759 | Morristown | 4 | 2.6 | 2 | 2.4 | 2.39 | 0.28 | 11.79 | 2.50 | 2.00 | 2.60 |
| 43902 | Alledonia | 2 | 3.1 | 0.8 | 1.95 | 1.57 | 1.63 | 83.4 | 1.95 | 2.60 | 1.95 |
| 43905 | Barton | 4 | 13.3 | 0.9 | 5.45 | 3.63 | 5.41 | 99.25 | 3.80 | 0.90 | 3.80 |
| 43906 | Bellaire | 37 | 33.9 | 0.8 | 6.77 | 4.45 | 6.56 | 96.94 | 3.60 | 1.88 | 11.10 |
| 43909 | Blaine | 2 | 2.3 | 2.3 | 2.3 | 2.3 | 0 | 0 | 2.30 | 2.30 | 2.30 |
| 43912 | Bridgeport | 11 | 23.4 | 0.1 | 3.69 | 1.55 | 6.68 | 180.93 | 1.50 | 0.60 | 2.13 |
| 43916 | Colerain | 3 | 3.3 | 2.7 | 3 | 2.99 | 0.3 | 10 | 3.00 | 2.38 | 3.08 |
| 43927 | Fairpoint | 1 | 2.4 | 2.4 | 2.4 | 2.4 | 2.40 | 2.03 | 2.30 | ||
| 43933 | Jacobsburg | 11 | 54 | 0.5 | 20.78 | 7.24 | 22.62 | 108.86 | 11.20 | 0.88 | 43.10 |
| 43935 | Martins Ferry | 31 | 13.4 | 0.1 | 3.25 | 2.1 | 2.96 | 91.01 | 2.10 | 1.28 | 4.43 |
| 43937 | Maynard | 3 | 24.3 | 3.1 | 11.43 | 8.04 | 11.3 | 98.87 | 6.90 | 2.63 | 11.25 |
| 43940 | Neffs | 1 | 6.2 | 6.2 | 6.2 | 6.2 | 6.20 | 2.38 | 5.75 | ||
| 43942 | Powhatan Point | 13 | 13.6 | 0.5 | 4.02 | 2.24 | 4.15 | 103.25 | 2.30 | 0.55 | 5.30 |
| 43947 | Shadyside | 17 | 16.8 | 0.6 | 4.29 | 3.02 | 4 | 93.24 | 2.80 | 1.65 | 5.58 |
| 43950 | Saint Clairsville | 208 | 70.3 | 0 | 4.96 | 2.83 | 7.56 | 152.22 | 3.00 | 1.50 | 5.10 |
| 43967 | Warnock | 2 | 0.9 | 0.9 | 0.9 | 0.9 | 0 | 0 | 0.90 | 1.45 | 0.90 |
| 43972 | Bannock | 1 | 2.2 | 2.2 | 2.2 | 2.2 | 2.20 | 1.08 | 2.95 | ||
| 43977 | Flushing | 4 | 15.1 | 1 | 4.82 | 2.45 | 6.86 | 142.25 | 1.60 | 1.00 | 2.00 |
| 43983 | Piedmont | 4 | 10.4 | 0.1 | 3.5 | 1.16 | 4.76 | 135.97 | 1.75 | 0.10 | 2.90 |
| 43985 | Holloway | 2 | 5.9 | 0.5 | 3.2 | 1.72 | 3.82 | 119.32 | 3.20 | 0.30 | 3.20 |
All concentrations are in units of pico-Curies of radiation per liter of air ( pCi/l ).
2023 air pollution in Belmont County:
Nitrogen Dioxide: 0.00 ppm (standard limit: 0.053 ppm). Below U.S. average.
Particulate Matter (PM10) Annual: 21.4 µg/m3. Near U.S. average.
Particulate Matter (PM2.5) Annual: 9.2 µg/m3(standard limit: 15.0 µg/m3). Near U.S. average.
Sulfur Oxides Annual: 0.000 ppm (standard limit: 0.03 ppm). Near U.S. average.
Neighboring counties: Lyon County, Nevada  , Ohio County, West Virginia
  , Warren County, Indiana .
| Here: | 4.1% |
| Ohio: | 3.1% |
Current college students: 2,477
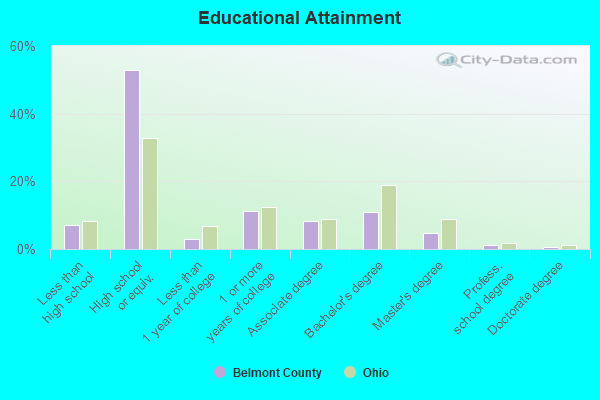
People 25 years of age or older with a high school degree or higher: 91.2%
People 25 years of age or older with a bachelor's degree or higher: 21.1%
Number of foreign born residents: 480 (80.2% naturalized citizens)
| Belmont County: | 0.7% |
| Whole state: | 5.0% |
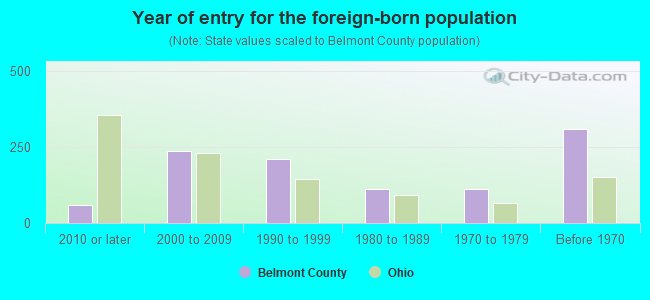
- Year of entry for the foreign-born population
- 262010 or later
- 1852000 to 2009
- 1951990 to 1999
- 1121980 to 1989
- 1111970 to 1979
- 309Before 1970
Mean travel time to work (commute): minutes
Percentage of county residents living and working in this county: 71.0%
Housing units in structures:
- One, detached: 24,216
- One, attached: 277
- Two: 2,320
- 3 or 4: 804
- 5 to 9: 974
- 10 to 19: 315
- 20 to 49: 498
- 50 or more: 689
- Mobile homes: 1,453
Housing units in Belmont County with a mortgage: 9,397 (1,199 second mortgage, 42 home equity loan, 1,157 both second mortgage and home equity loan)
Houses without a mortgage: 715
| Here: | 1.2% with mortgage |
| State: | 95.2% with mortgage |
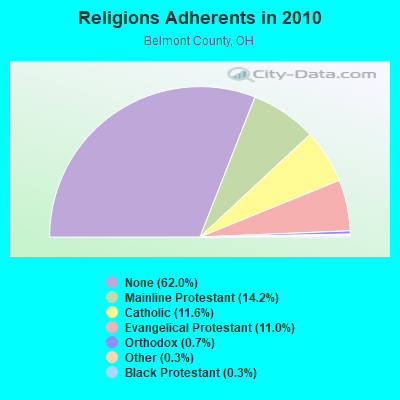
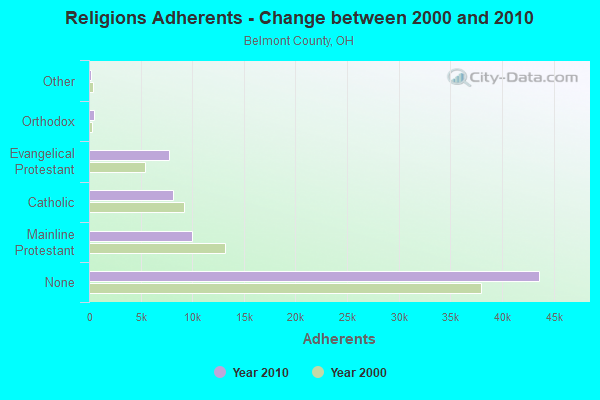
Religion statistics for Belmont County
| Religion | Adherents | Congregations |
|---|---|---|
| Mainline Protestant | 10,012 | 66 |
| Catholic | 8,179 | 16 |
| Evangelical Protestant | 7,732 | 53 |
| Orthodox | 463 | 3 |
| Other | 202 | 5 |
| Black Protestant | 176 | 1 |
| None | 43,636 | - |
Source: Clifford Grammich, Kirk Hadaway, Richard Houseal, Dale E.Jones, Alexei Krindatch, Richie Stanley and Richard H.Taylor. 2012. 2010 U.S.Religion Census: Religious Congregations & Membership Study. Association of Statisticians of American Religious Bodies. Jones, Dale E., et al. 2002. Congregations and Membership in the United States 2000. Nashville, TN: Glenmary Research Center.
Food Environment Statistics:
| Belmont County: | 2.64 / 10,000 pop. |
| State: | 1.89 / 10,000 pop. |
| Here: | 0.15 / 10,000 pop. |
| Ohio: | 0.13 / 10,000 pop. |
| This county: | 1.76 / 10,000 pop. |
| Ohio: | 1.25 / 10,000 pop. |
| Belmont County: | 4.69 / 10,000 pop. |
| Ohio: | 2.93 / 10,000 pop. |
| This county: | 5.13 / 10,000 pop. |
| State: | 6.25 / 10,000 pop. |
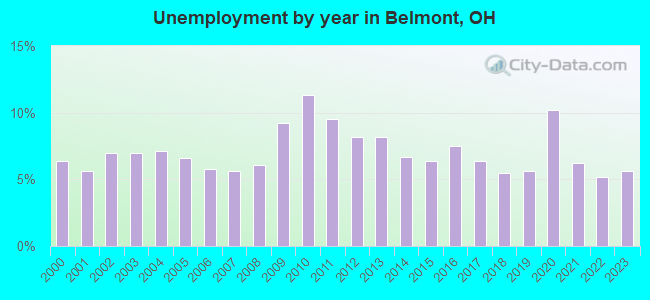
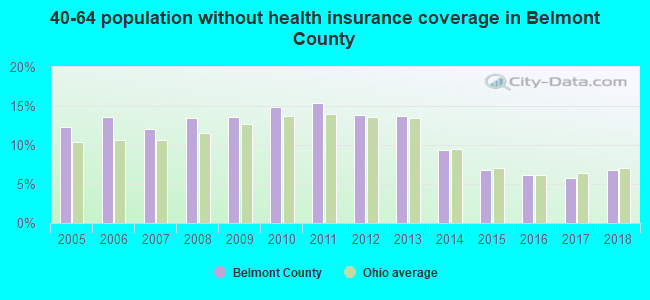
| Belmont County: | 11.1% |
| Ohio: | 10.3% |
| Belmont County: | 29.5% |
| State: | 29.1% |
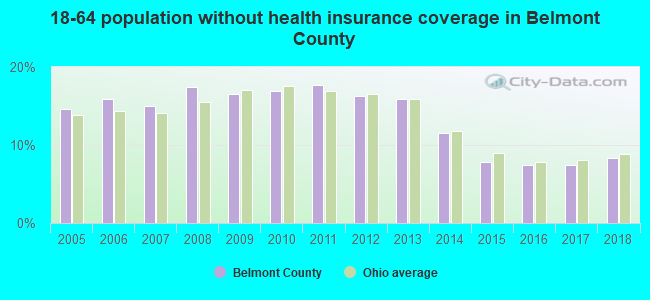
| Here: | 16.8% |
| State: | 11.9% |
Agriculture in Belmont County:
Average size of farms: 188 acresAverage value of agricultural products sold per farm: $19,622
Average value of crops sold per acre for harvested cropland: $115.40
The value of nursery, greenhouse, floriculture, and sod as a percentage of the total market value of agricultural products sold: 6.88%
The value of livestock, poultry, and their products as a percentage of the total market value of agricultural products sold: 70.34%
Average total farm production expenses per farm: $18,450
Harvested cropland as a percentage of land in farms: 26.76%
Irrigated harvested cropland as a percentage of land in farms: 0.04%
Average market value of all machinery and equipment per farm: $58,902
The percentage of farms operated by a family or individual: 95.35%
Average age of principal farm operators: 55 years
Average number of cattle and calves per 100 acres of all land in farms: 15.93
Milk cows as a percentage of all cattle and calves: 10.63%
Corn for grain: 524 harvested acres
All wheat for grain: 119 harvested acres
Vegetables: 129 harvested acres
Land in orchards: 119 acres
Earthquake activity:
Belmont County-area historical earthquake activity is significantly above Ohio state average. It is 36% smaller than the overall U.S. average.On 8/23/2011 at 17:51:04, a magnitude 5.8 (5.8 MW, Depth: 3.7 mi, Class: Moderate, Intensity: VI - VII) earthquake occurred 216.8 miles away from Belmont County center
On 9/25/1998 at 19:52:52, a magnitude 5.2 (4.8 MB, 4.3 MS, 5.2 LG, 4.5 MW, Depth: 3.1 mi) earthquake occurred 104.8 miles away from the county center
On 1/31/1986 at 16:46:43, a magnitude 5.0 (5.0 MB) earthquake occurred 109.7 miles away from the county center
On 7/27/1980 at 18:52:21, a magnitude 5.2 (5.1 MB, 4.7 MS, 5.0 UK, 5.2 UK) earthquake occurred 205.9 miles away from the county center
On 8/9/2020 at 12:07:37, a magnitude 5.1 (5.1 MW, Depth: 4.7 mi) earthquake occurred 245.9 miles away from Belmont County center
On 12/31/2011 at 20:05:01, a magnitude 4.0 (4.0 ML, Depth: 3.1 mi, Class: Light, Intensity: IV - V) earthquake occurred 76.6 miles away from the county center
Magnitude types: regional Lg-wave magnitude (LG), body-wave magnitude (MB), local magnitude (ML), surface-wave magnitude (MS), moment magnitude (MW)
Most recent natural disasters:
- Ohio Covid-19 Pandemic, Incident Period: January 20, 2020, FEMA Id: 4507, Natural disaster type: Other
- Ohio Severe Storms, Flooding, And Landslides, Incident Period: February 5, 2019 - February 13, 2019, FEMA Id: 4424, Natural disaster type: Storm, Landslide, Flood
- Ohio Severe Storms, Landslides, And Mudslides, Incident Period: February 14, 2018 - February 25, 2018, FEMA Id: 4360, Natural disaster type: Storm, Mudslide, Landslide
- Ohio Severe Storms and Straight-line Winds, Incident Period: June 29, 2012 to July 02, 2012, Major Disaster (Presidential) Declared DR-4077: August 20, 2012, FEMA Id: 4077, Natural disaster type: Storm, Wind
- Ohio Severe Storms and Flooding, Incident Period: April 04, 2011 to May 15, 2011, Major Disaster (Presidential) Declared DR-4002: July 13, 2011, FEMA Id: 4002, Natural disaster type: Storm, Flood
- Ohio Hurricane Katrina Evacuation, Incident Period: August 29, 2005 to October 01, 2005, Emergency Declared EM-3250: September 13, 2005, FEMA Id: 3250, Natural disaster type: Hurricane
- Ohio Severe Winter Storms, Flooding and Mudslides, Incident Period: December 22, 2004 to February 01, 2005, Major Disaster (Presidential) Declared DR-1580: February 15, 2005, FEMA Id: 1580, Natural disaster type: Winter Storm, Mudslide, Flood
- Ohio Severe Storms and Flooding, Incident Period: August 27, 2004 to September 27, 2004, Major Disaster (Presidential) Declared DR-1556: September 19, 2004, FEMA Id: 1556, Natural disaster type: Storm, Flood
- Ohio Severe Storms, Flooding, Mudslides, and Landslides, Incident Period: January 03, 2004 to January 30, 2004, Major Disaster (Presidential) Declared DR-1507: January 26, 2004, FEMA Id: 1507, Natural disaster type: Storm, Mudslide, Landslide, Flood
- Ohio Severe Storms, Flooding and Tornadoes, Incident Period: June 24, 1998 to July 05, 1998, Major Disaster (Presidential) Declared DR-1227: June 30, 1998, FEMA Id: 1227, Natural disaster type: Storm, Tornado, Flood
- 9 other natural disasters have been reported since 1953.
The number of natural disasters in Belmont County (19) is greater than the US average (15).
Major Disasters (Presidential) Declared: 13
Emergencies Declared: 3
Causes of natural disasters: Floods: 12, Storms: 11, Tornadoes: 4, Landslides: 3, Mudslides: 3, Snowstorms: 2, Winds: 2, Blizzard: 1, Heavy Rain: 1, Hurricane: 1, Tropical Storm: 1, Winter Storm: 1, Other: 1 (Note: some incidents may be assigned to more than one category).
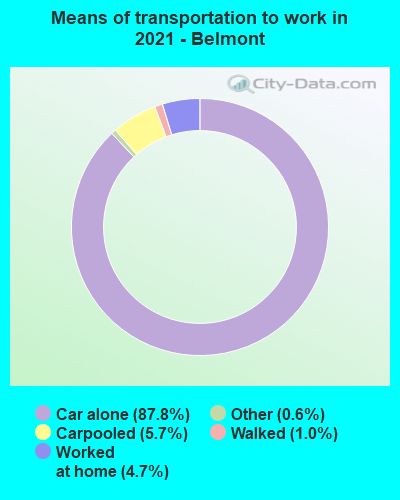
Means of transportation to work:
- Drove a car alone: 19,270 (82.1%)
- Carpooled: 1,573 (6.7%)
- Bus: 24 (0.1%)
- Light rail, streetcar or trolley: 13 (0.1%)
- Taxicab, motorcycle, or other means: 183 (0.8%)
- Walked: 317 (1.4%)
- Worked at home: 1,696 (7.2%)
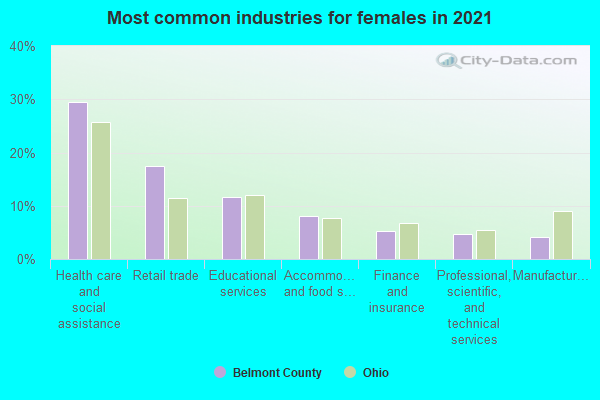
- Health care and social assistance (23%)
- Retail trade (17%)
- Other services, except public administration (9%)
- Educational services (9%)
- Accommodation and food services (7%)
- Manufacturing (4%)
- Arts, entertainment, and recreation (4%)
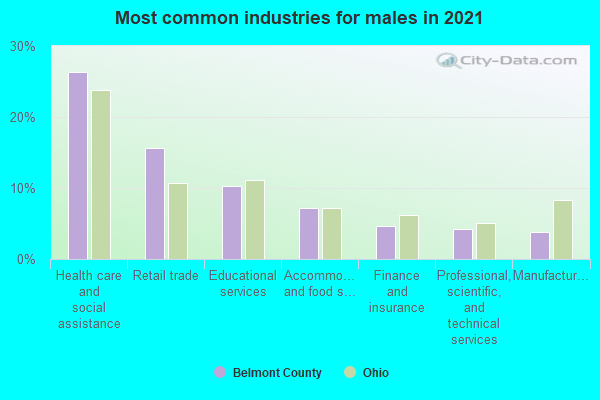
- Health care and social assistance (26%)
- Retail trade (19%)
- Other services, except public administration (11%)
- Educational services (10%)
- Accommodation and food services (8%)
- Manufacturing (5%)
- Arts, entertainment, and recreation (5%)
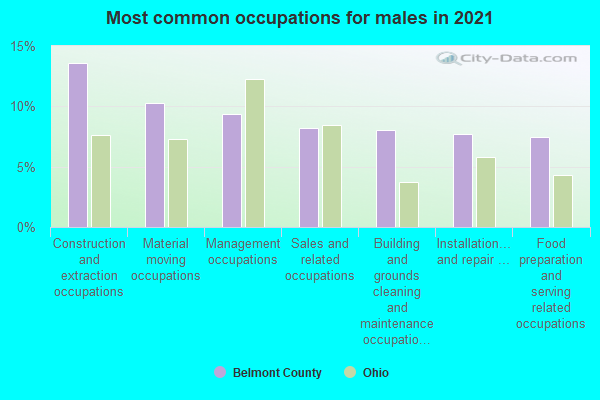
- Construction and extraction occupations (17%)
- Transportation occupations (10%)
- Management occupations (10%)
- Installation, maintenance, and repair occupations (7%)
- Material moving occupations (7%)
- Sales and related occupations (6%)
- Production occupations (6%)
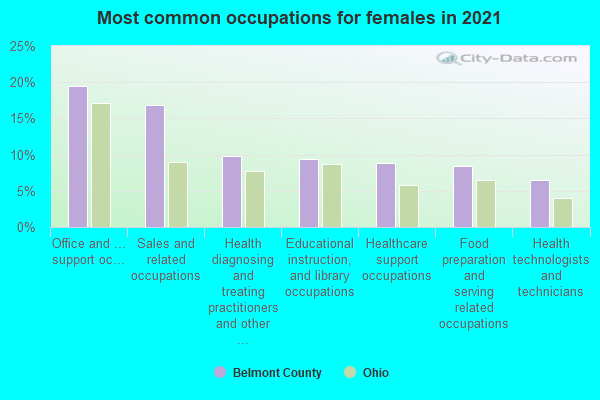
- Office and administrative support occupations (19%)
- Sales and related occupations (17%)
- Health diagnosing and treating practitioners and other technical occupations (12%)
- Food preparation and serving related occupations (8%)
- Educational instruction, and library occupations (8%)
- Management occupations (6%)
- Healthcare support occupations (6%)
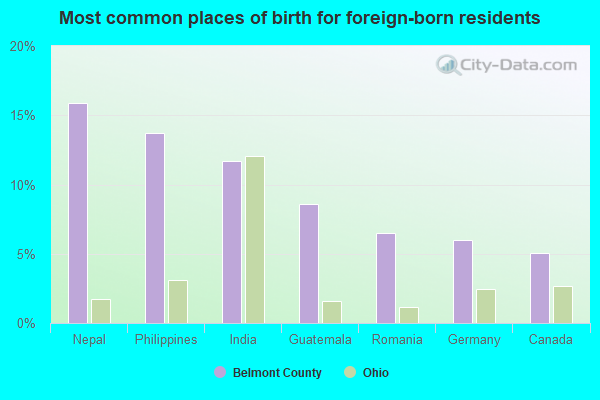
- Nepal (14%)
- India (9%)
- Romania (9%)
- Philippines (9%)
- Germany (8%)
- Guatemala (7%)
- Canada (5%)
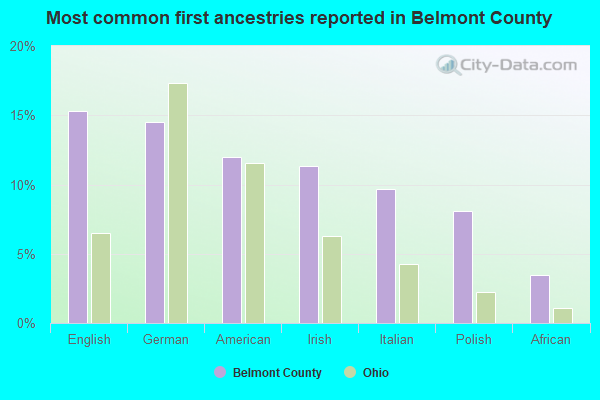
- German (18%)
- English (12%)
- Irish (11%)
- American (10%)
- Italian (10%)
- Polish (8%)
- African (4%)
People in group quarters in Belmont County, Ohio in 2010:
- 2,692 people in state prisons
- 798 people in nursing facilities/skilled-nursing facilities
- 94 people in group homes for juveniles (non-correctional)
- 78 people in workers' group living quarters and job corps centers
- 76 people in group homes intended for adults
- 35 people in correctional facilities intended for juveniles
- 31 people in residential treatment centers for juveniles (non-correctional)
- 18 people in emergency and transitional shelters (with sleeping facilities) for people experiencing homelessness
- 8 people in residential treatment centers for adults
- 4 people in other noninstitutional facilities
People in group quarters in Belmont County, Ohio in 2000:
- 2,156 people in state prisons
- 718 people in nursing homes
- 68 people in hospitals/wards and hospices for chronically ill
- 68 people in other hospitals or wards for chronically ill
- 45 people in mental (psychiatric) hospitals or wards
- 39 people in other group homes
- 36 people in short-term care, detention or diagnostic centers for delinquent children
- 34 people in homes for the mentally retarded
- 17 people in homes or halfway houses for drug/alcohol abuse
- 12 people in homes for the mentally ill
- 9 people in training schools for juvenile delinquents
- 8 people in other noninstitutional group quarters
- 6 people in orthopedic wards and institutions for the physically handicapped
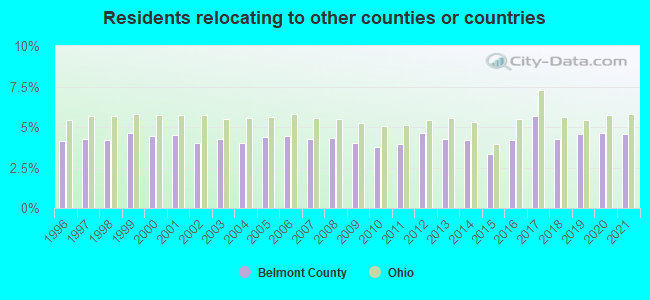
4.90% of this county's 2021 resident taxpayers lived in other counties in 2020 ($39,539 average adjusted gross income)
| Here: | 4.90% |
| Ohio average: | 5.68% |
10 or fewer of this county's residents moved from foreign countries.
2.34% relocated from other counties in Ohio ($15,602 average AGI)
2.56% relocated from other states ($23,937 average AGI)
Belmont County: 2.56% Ohio average: 1.92%

Top counties from which taxpayers relocated into this county between 2020 and 2021:
| from Ohio County, WV | |
| from Jefferson County, OH | |
| from Marshall County, WV | |
| from Franklin County, OH | |
| from Guernsey County, OH | |
| from Monroe County, OH | |
| from Allegheny County, PA |
4.55% of this county's 2020 resident taxpayers moved to other counties in 2021 ($44,284 average adjusted gross income)
| Here: | 4.55% |
| Ohio average: | 5.79% |
10 or fewer of this county's residents moved to foreign countries.
2.02% relocated to other counties in Ohio ($18,422 average AGI)
2.54% relocated to other states ($25,862 average AGI)
Belmont County: 2.54% Ohio average: 2.05%
Top counties to which taxpayers relocated from this county between 2020 and 2021:
| to Ohio County, WV | |
| to Jefferson County, OH | |
| to Marshall County, WV | |
| to Franklin County, OH | |
| to Monroe County, OH | |
| to Harrison County, OH | |
| to Guernsey County, OH |
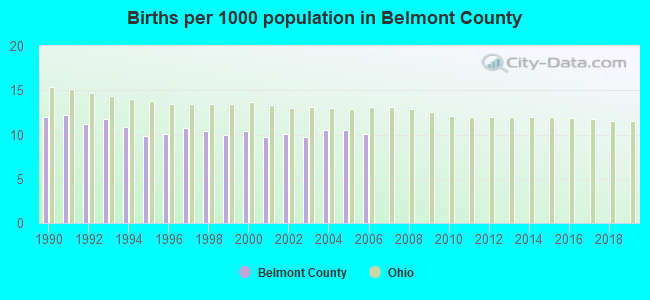
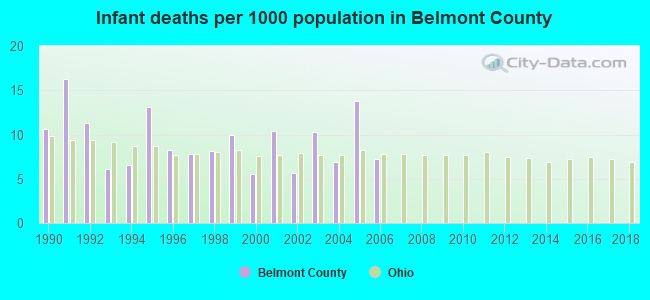
Births per 1000 population from 1990 to 1999: 10.9
Births per 1000 population from 2000 to 2006: 10.1
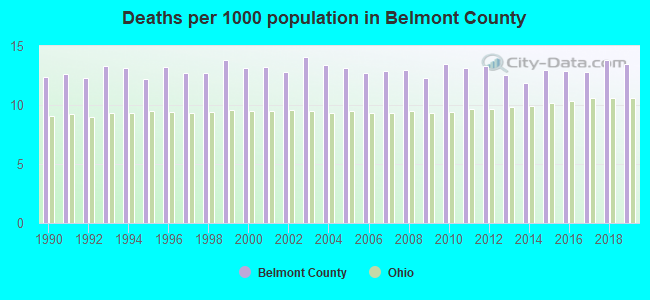
Deaths per 1000 population from 1990 to 1999: 12.8
Deaths per 1000 population from 2000 to 2009: 13.0
Deaths per 1000 population from 2010 to 2020: 13.3
Infant deaths per 1000 live births from 1990 to 1999: 9.8
Infant deaths per 1000 live births from 2000 to 2006: 8.5
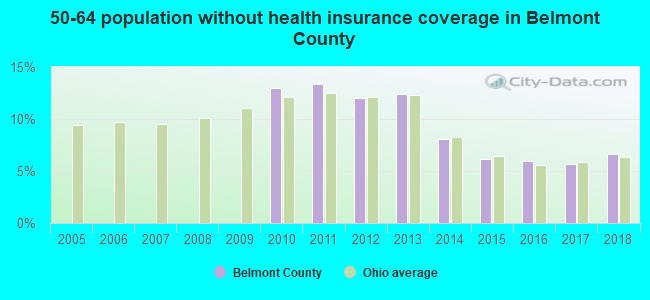
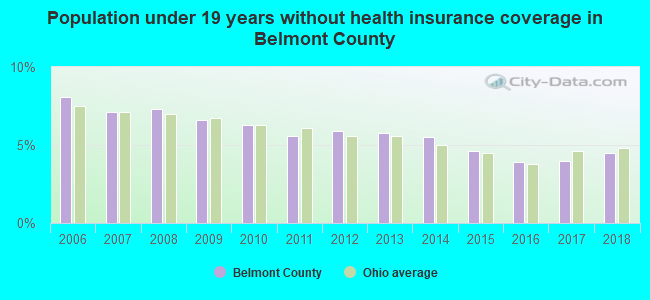
Persons under 19 years old without health insurance coverage in 2018: 4.5%
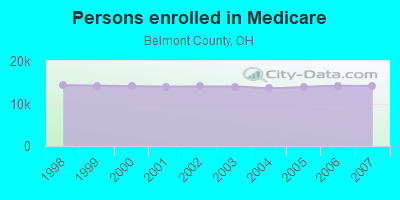
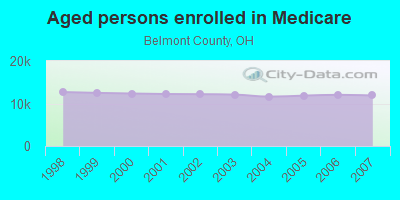
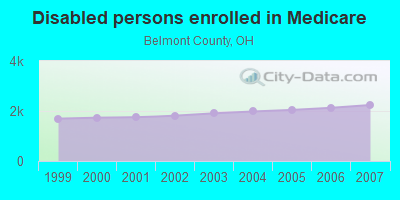
Persons enrolled in hospital insurance and/or supplemental medical insurance (Medicare) in July 1, 2007: 14,126 (11,886 aged, 2,240 disabled)
Children under 18 without health insurance coverage in 2007: 900 (6%)
Most common underlying causes of death in Belmont County, Ohio in 1999 - 2019:
- Atherosclerotic heart disease (2,141)
- Acute myocardial infarction, unspecified (1,581)
- Bronchus or lung, unspecified - Malignant neoplasms (1,147)
- Chronic obstructive pulmonary disease, unspecified (894)
- Alzheimer disease, unspecified (577)
- Stroke, not specified as haemorrhage or infarction (416)
- Unspecified diabetes mellitus, without complications (391)
- Pneumonia, unspecified (388)
- Colon, unspecified - Malignant neoplasms (354)
- Congestive heart failure (302)
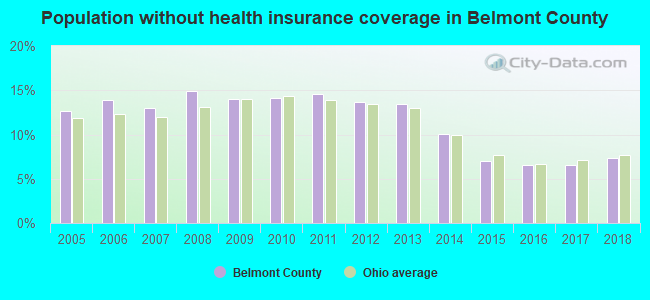
Population without health insurance coverage in 2000: 11%
Children under 18 without health insurance coverage in 2000: 10%
Short term general hospital admissions per 100,000 population in 2004: 13,499
Short term general hospital beds per 100,000 population in 2004: 388
Emergency room visits per 100,000 population in 2004: 45,137
General practice office based MDs per 100,000 population in 2005: 1,011
Medical specialist MDs per 100,000 population in 2005: 1,400
Dentists per 100,000 population in 1998: 9
Total births per 100,000 population, July 2005 - July 2006 : 40
Total deaths per 100,000 population, July 2005 - July 2006: 98
Limited-service eating places per 100,000 population in 2005 : 10
Beer, wine & liquor stores per 100,000 population in 2005: 1
Suicides per 1,000,000 population from 2000 to 2006: 142.3. This is more than state average.
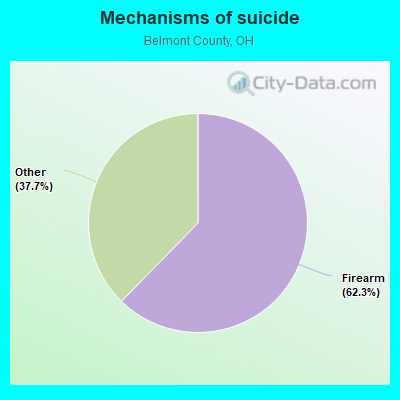
- Firearm - 88.7
- Other - 53.6
Household type by relationship:
Households: 65,509- Male householders: 13,442 (3,039 living alone), Female householders: 13,339 (4,286 living alone)
14,092 spouses (14,092 opposite-sex spouses), 1,548 unmarried partners, (1,515 opposite-sex unmarried partners), 17,453 children (16,229 natural, 374 adopted, 850 stepchildren), 452 grandchildren, 309 brothers or sisters, 209 parents, 62 foster children, 467 other relatives, 508 non-relatives
- In group quarters: 3,628
Size of family households: 9,585 2-persons, 4,238 3-persons, 3,182 4-persons, 695 5-persons, 285 6-persons, 270 7-or-more-persons.
Size of nonfamily households: 7,325 1-person, 1,201 2-persons.
9,069 married couples with children.
2,708 single-parent households (1,216 men, 1,492 women).
98.4% of residents of Belmont speak English at home.
0.5% of residents speak Spanish at home (83% speak English very well, 5% speak English well, 12% speak English not well, 1% don't speak English at all).
0.7% of residents speak other Indo-European language at home (54% speak English very well, 34% speak English well, 12% speak English not well).
0.2% of residents speak Asian or Pacific Island language at home (61% speak English very well, 26% speak English well, 13% speak English not well).
In fiscal year 2004:
Federal Government expenditure: $420,158,000 ($6,057 per capita)
Department of Defense expenditure: $6,190,000
Federal direct payments to individuals for retirement and disability: $210,052,000
Federal other direct payments to individuals: $117,404,000
Federal direct payments not to individuals: $1,819,000
Federal grants: $72,932,000
Federal procurement contracts: $5,372,000 ($956,000 Department of Defense)
Federal salaries and wages: $12,579,000 ($338,000 Department of Defense)
Federal Government direct loans: $1,006,000
Federal guaranteed/insured loans: $11,872,000
Federal Government insurance: $25,177,000
Population change from April 1, 2000 to July 1, 2005:
Births: 3,563| Here: | 51 per 1000 residents |
| State: | 69 per 1000 residents |
Deaths: 4,878
| Here: | 70 per 1000 residents |
| State: | 50 per 1000 residents |
Net international migration: +61
| Here: | +1 per 1000 residents |
| State: | +7 per 1000 residents |
Net internal migration: +327
| Here: | |
| State: |
Total withdrawal of fresh water for public supply: 8.28 millions of gallons per day (76% from ground, 24% from surface)
| Here: | 6.4 |
| State: | 6.7 |
| Here: | 5.0 |
| State: | 4.4 |
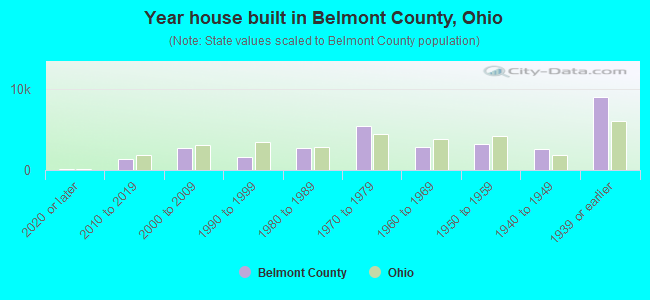
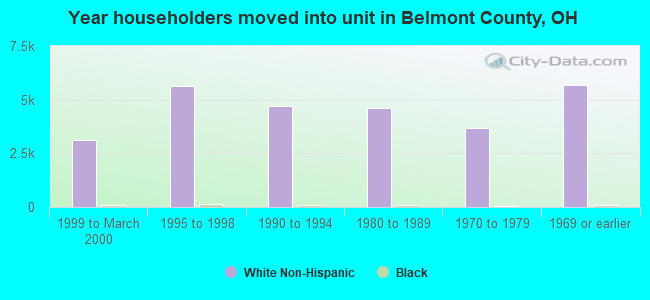
- Year house built in Belmont County, Ohio
- 1382020 or later
- 2,5902010 to 2019
- 1,8022000 to 2009
- 3,2871990 to 1999
- 2,4861980 to 1989
- 3,7411970 to 1979
- 3,0041960 to 1969
- 3,9291950 to 1959
- 2,7821940 to 1949
- 7,7871939 or earlier
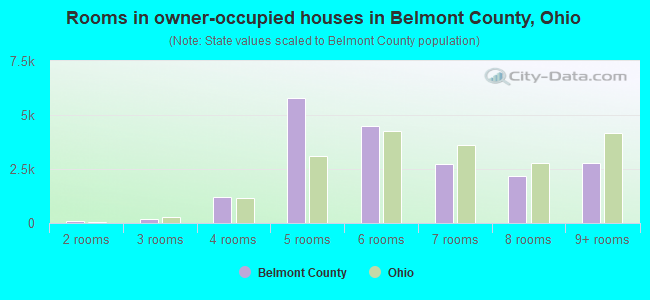
- Rooms in owner-occupied houses in Belmont County, Ohio
- 491 room
- 02 rooms
- 1993 rooms
- 1,2224 rooms
- 4,2205 rooms
- 4,8566 rooms
- 3,1927 rooms
- 2,6118 rooms
- 3,3199+ rooms
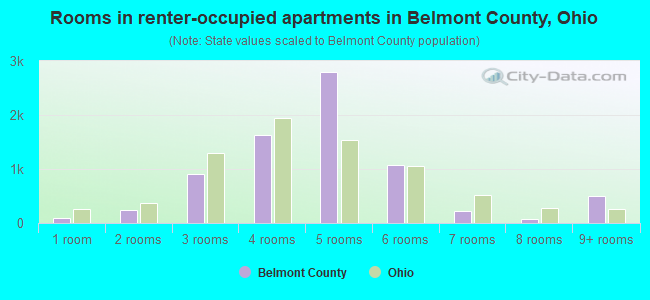
- Rooms in renter-occupied apartments in Belmont County, Ohio
- 941 room
- 2992 rooms
- 8973 rooms
- 1,2284 rooms
- 2,1395 rooms
- 1,1046 rooms
- 6027 rooms
- 3508 rooms
- 4009+ rooms
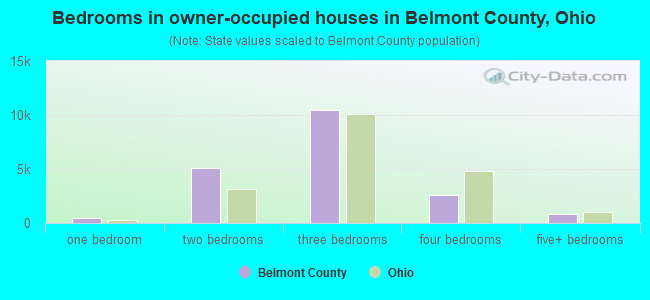
- Bedrooms in owner-occupied houses in Belmont County, Ohio
- 49no bedroom
- 3471 bedroom
- 3,2582 bedrooms
- 11,9163 bedrooms
- 3,3314 bedrooms
- 7675+ bedrooms
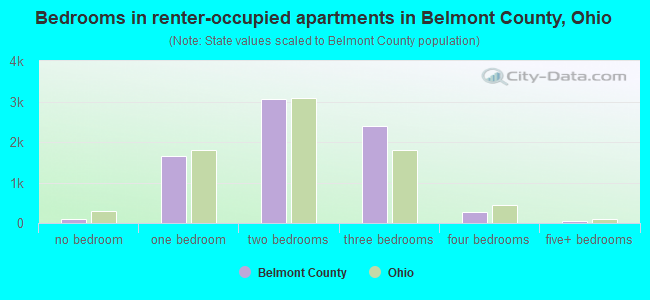
- Bedrooms in renter-occupied apartments in Belmont County, Ohio
- 122no bedroom
- 1,4281 bedroom
- 2,6162 bedrooms
- 2,2573 bedrooms
- 4004 bedrooms
- 2905+ bedrooms
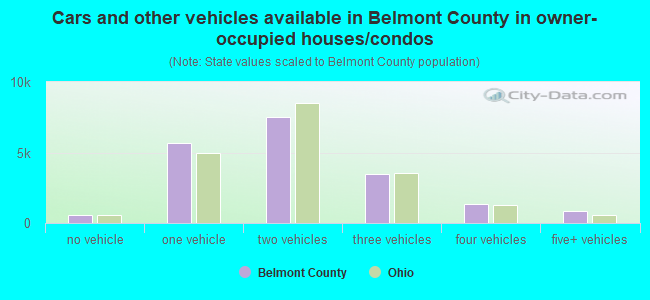
- Cars and other vehicles available in Belmont County in owner-occupied houses/condos
- 303no vehicle
- 4,5451 vehicle
- 8,0842 vehicles
- 4,5713 vehicles
- 1,4114 vehicles
- 7545+ vehicles
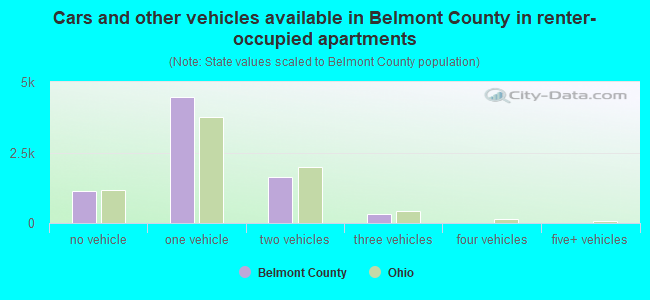
- Cars and other vehicles available in Belmont County in renter-occupied apartments
- 2,340no vehicle
- 2,6891 vehicle
- 1,6552 vehicles
- 3023 vehicles
- 1274 vehicles
- 05+ vehicles
93.2% of Belmont County residents lived in the same house 1 years ago.
Out of people who lived in different houses, 34% lived in this county.
Out of people who lived in different counties, 57% lived in Ohio.
| Belmont County: | 93.2% |
| State average: | 87.8% |
Place of birth for U.S.-born residents:
- This state: 31,433
- Other state: 33,359
- Northeast: 3,215
- Midwest: 986
- South: 28,556
- West: 602
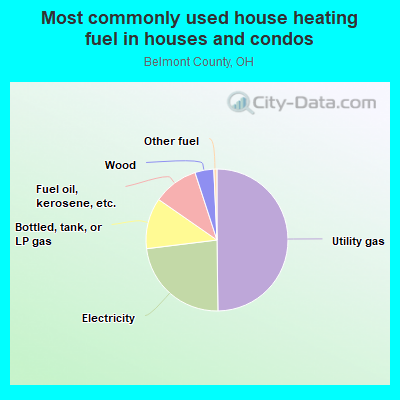
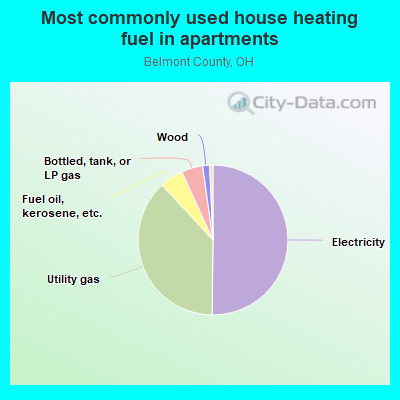
- 48.1%Utility gas
- 23.3%Electricity
- 12.2%Bottled, tank, or LP gas
- 10.3%Fuel oil, kerosene, etc.
- 5.3%Wood
- 0.6%Other fuel
- 0.1%No fuel used
- 49.4%Electricity
- 39.3%Utility gas
- 5.2%Fuel oil, kerosene, etc.
- 3.6%Bottled, tank, or LP gas
- 1.3%Wood
- 0.5%Coal or coke
- 0.4%No fuel used
- 0.3%Other fuel
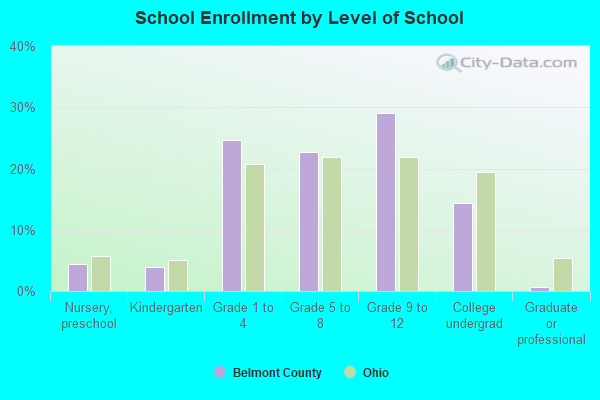
Private vs. public school enrollment:
| Here: | 14.5% |
| Ohio: | 16.0% |
| Here: | 17.5% |
| Ohio: | 13.1% |
| Here: | 31.5% |
| Ohio: | 22.3% |
Belmont County government finances - Expenditure in 2020:
- Charges - Other: $3,406,000
Other: $3,244,000
- Construction - Sewerage: $106,000
- Current Operations - Public Welfare - Other: $18,281,000
Public Welfare - Other: $15,124,000
Correctional Institutions: $9,680,000
Correctional Institutions: $8,430,000
Regular Highways: $6,595,000
Regular Highways: $5,465,000
Judicial and Legal Services: $5,277,000
Judicial and Legal Services: $5,197,000
Central Staff Services: $3,792,000
Central Staff Services: $3,702,000
Sewerage: $3,032,000
Sewerage: $2,417,000
Financial Administration: $2,349,000
General Public Buildings: $2,178,000
General Public Buildings: $1,909,000
Financial Administration: $1,863,000
Health - Other: $1,808,000
Police Protection: $1,795,000
Police Protection: $1,613,000
Health - Other: $1,607,000
Natural Resources - Other: $571,000
Natural Resources - Other: $507,000
- Federal Intergovernmental - Other: $338,000
Other: $291,000
Highways: $3,000
- Intergovernmental to Local - Other - General - Other: $99,804,000
Other - General - Other: $66,225,000
Other - Water Utilities: $8,107,000
Other - Water Utilities: $6,635,000
Other - Regular Highways: $5,673,000
Other - Regular Highways: $4,270,000
- Local Intergovernmental - Water Utilities: $6,784,000
Water Utilities: $5,227,000
Sewerage: $2,776,000
Sewerage: $2,294,000
- Long Term Debt - Beginning Outstanding - Unspecified Public Purpose: $9,988,000
Outstanding Unspecified Public Purpose: $9,249,000
Beginning Outstanding - Unspecified Public Purpose: $5,041,000
Retired Unspecified Public Purpose: $3,453,000
Outstanding Unspecified Public Purpose: $1,588,000
Retired Unspecified Public Purpose: $739,000
- Miscellaneous - Interest Earnings: $1,293,000
General Revenue - Other: $481,000
General Revenue - Other: $460,000
Rents: $39,000
Rents: $28,000
- Other Capital Outlay - Sewerage: $2,028,000
Regular Highways: $349,000
Financial Administration: $180,000
Regular Highways: $175,000
Financial Administration: $129,000
Police Protection: $78,000
Public Welfare - Other: $66,000
Central Staff Services: $62,000
General Public Building: $52,000
Central Staff Services: $44,000
Public Welfare - Other: $44,000
Judicial and Legal Services: $28,000
Correctional Institutions: $27,000
Sewerage: $21,000
Judicial and Legal Services: $20,000
General Public Building: $16,000
Health - Other: $11,000
Health - Other: $7,000
Police Protection: $2,000
- State Intergovernmental - Public Welfare: $11,116,000
Public Welfare: $9,084,000
Health and Hospitals: $3,057,000
Highways: $2,959,000
Health and Hospitals: $2,527,000
Highways: $2,275,000
- Tax - Property: $24,253,000
General Sales and Gross Receipts: $17,938,000
General Sales and Gross Receipts: $17,615,000
Property: $16,740,000
Other: $747,000
Other License: $655,000
Other: $606,000
Other License: $590,000
Motor Vehicle License: $243,000
Motor Vehicle License: $234,000
- Total Salaries and Wages: $31,938,000
: $29,225,000
- Water Utilities - Interest on Debt: $535,000
Interest on Debt: $202,000
Belmont County government finances - Revenue in 2020:
- Charges - Other: $3,406,000
Other: $3,244,000
- Construction - Sewerage: $106,000
- Current Operations - Public Welfare - Other: $18,281,000
Public Welfare - Other: $15,124,000
Correctional Institutions: $9,680,000
Correctional Institutions: $8,430,000
Regular Highways: $6,595,000
Regular Highways: $5,465,000
Judicial and Legal Services: $5,277,000
Judicial and Legal Services: $5,197,000
Central Staff Services: $3,792,000
Central Staff Services: $3,702,000
Sewerage: $3,032,000
Sewerage: $2,417,000
Financial Administration: $2,349,000
General Public Buildings: $2,178,000
General Public Buildings: $1,909,000
Financial Administration: $1,863,000
Health - Other: $1,808,000
Police Protection: $1,795,000
Police Protection: $1,613,000
Health - Other: $1,607,000
Natural Resources - Other: $571,000
Natural Resources - Other: $507,000
- Federal Intergovernmental - Other: $338,000
Other: $291,000
Highways: $3,000
- Intergovernmental to Local - Other - General - Other: $99,804,000
Other - General - Other: $66,225,000
Other - Water Utilities: $8,107,000
Other - Water Utilities: $6,635,000
Other - Regular Highways: $5,673,000
Other - Regular Highways: $4,270,000
- Local Intergovernmental - Water Utilities: $6,784,000
Water Utilities: $5,227,000
Sewerage: $2,776,000
Sewerage: $2,294,000
- Long Term Debt - Beginning Outstanding - Unspecified Public Purpose: $9,988,000
Outstanding Unspecified Public Purpose: $9,249,000
Beginning Outstanding - Unspecified Public Purpose: $5,041,000
Retired Unspecified Public Purpose: $3,453,000
Outstanding Unspecified Public Purpose: $1,588,000
Retired Unspecified Public Purpose: $739,000
- Miscellaneous - Interest Earnings: $1,293,000
General Revenue - Other: $481,000
General Revenue - Other: $460,000
Rents: $39,000
Rents: $28,000
- Other Capital Outlay - Sewerage: $2,028,000
Regular Highways: $349,000
Financial Administration: $180,000
Regular Highways: $175,000
Financial Administration: $129,000
Police Protection: $78,000
Public Welfare - Other: $66,000
Central Staff Services: $62,000
General Public Building: $52,000
Central Staff Services: $44,000
Public Welfare - Other: $44,000
Judicial and Legal Services: $28,000
Correctional Institutions: $27,000
Sewerage: $21,000
Judicial and Legal Services: $20,000
General Public Building: $16,000
Health - Other: $11,000
Health - Other: $7,000
Police Protection: $2,000
- State Intergovernmental - Public Welfare: $11,116,000
Public Welfare: $9,084,000
Health and Hospitals: $3,057,000
Highways: $2,959,000
Health and Hospitals: $2,527,000
Highways: $2,275,000
- Tax - Property: $24,253,000
General Sales and Gross Receipts: $17,938,000
General Sales and Gross Receipts: $17,615,000
Property: $16,740,000
Other: $747,000
Other License: $655,000
Other: $606,000
Other License: $590,000
Motor Vehicle License: $243,000
Motor Vehicle License: $234,000
- Total Salaries and Wages: $31,938,000
: $29,225,000
- Water Utilities - Interest on Debt: $535,000
Interest on Debt: $202,000
Belmont County government finances - Debt in 2020:
- Charges - Other: $3,406,000
Other: $3,244,000
- Construction - Sewerage: $106,000
- Current Operations - Public Welfare - Other: $18,281,000
Public Welfare - Other: $15,124,000
Correctional Institutions: $9,680,000
Correctional Institutions: $8,430,000
Regular Highways: $6,595,000
Regular Highways: $5,465,000
Judicial and Legal Services: $5,277,000
Judicial and Legal Services: $5,197,000
Central Staff Services: $3,792,000
Central Staff Services: $3,702,000
Sewerage: $3,032,000
Sewerage: $2,417,000
Financial Administration: $2,349,000
General Public Buildings: $2,178,000
General Public Buildings: $1,909,000
Financial Administration: $1,863,000
Health - Other: $1,808,000
Police Protection: $1,795,000
Police Protection: $1,613,000
Health - Other: $1,607,000
Natural Resources - Other: $571,000
Natural Resources - Other: $507,000
- Federal Intergovernmental - Other: $338,000
Other: $291,000
Highways: $3,000
- Intergovernmental to Local - Other - General - Other: $99,804,000
Other - General - Other: $66,225,000
Other - Water Utilities: $8,107,000
Other - Water Utilities: $6,635,000
Other - Regular Highways: $5,673,000
Other - Regular Highways: $4,270,000
- Local Intergovernmental - Water Utilities: $6,784,000
Water Utilities: $5,227,000
Sewerage: $2,776,000
Sewerage: $2,294,000
- Long Term Debt - Beginning Outstanding - Unspecified Public Purpose: $9,988,000
Outstanding Unspecified Public Purpose: $9,249,000
Beginning Outstanding - Unspecified Public Purpose: $5,041,000
Retired Unspecified Public Purpose: $3,453,000
Outstanding Unspecified Public Purpose: $1,588,000
Retired Unspecified Public Purpose: $739,000
- Miscellaneous - Interest Earnings: $1,293,000
General Revenue - Other: $481,000
General Revenue - Other: $460,000
Rents: $39,000
Rents: $28,000
- Other Capital Outlay - Sewerage: $2,028,000
Regular Highways: $349,000
Financial Administration: $180,000
Regular Highways: $175,000
Financial Administration: $129,000
Police Protection: $78,000
Public Welfare - Other: $66,000
Central Staff Services: $62,000
General Public Building: $52,000
Central Staff Services: $44,000
Public Welfare - Other: $44,000
Judicial and Legal Services: $28,000
Correctional Institutions: $27,000
Sewerage: $21,000
Judicial and Legal Services: $20,000
General Public Building: $16,000
Health - Other: $11,000
Health - Other: $7,000
Police Protection: $2,000
- State Intergovernmental - Public Welfare: $11,116,000
Public Welfare: $9,084,000
Health and Hospitals: $3,057,000
Highways: $2,959,000
Health and Hospitals: $2,527,000
Highways: $2,275,000
- Tax - Property: $24,253,000
General Sales and Gross Receipts: $17,938,000
General Sales and Gross Receipts: $17,615,000
Property: $16,740,000
Other: $747,000
Other License: $655,000
Other: $606,000
Other License: $590,000
Motor Vehicle License: $243,000
Motor Vehicle License: $234,000
- Total Salaries and Wages: $31,938,000
: $29,225,000
- Water Utilities - Interest on Debt: $535,000
Interest on Debt: $202,000
Belmont County government finances - Cash and Securities in 2020:
- Charges - Other: $3,406,000
Other: $3,244,000
- Construction - Sewerage: $106,000
- Current Operations - Public Welfare - Other: $18,281,000
Public Welfare - Other: $15,124,000
Correctional Institutions: $9,680,000
Correctional Institutions: $8,430,000
Regular Highways: $6,595,000
Regular Highways: $5,465,000
Judicial and Legal Services: $5,277,000
Judicial and Legal Services: $5,197,000
Central Staff Services: $3,792,000
Central Staff Services: $3,702,000
Sewerage: $3,032,000
Sewerage: $2,417,000
Financial Administration: $2,349,000
General Public Buildings: $2,178,000
General Public Buildings: $1,909,000
Financial Administration: $1,863,000
Health - Other: $1,808,000
Police Protection: $1,795,000
Police Protection: $1,613,000
Health - Other: $1,607,000
Natural Resources - Other: $571,000
Natural Resources - Other: $507,000
- Federal Intergovernmental - Other: $338,000
Other: $291,000
Highways: $3,000
- Intergovernmental to Local - Other - General - Other: $99,804,000
Other - General - Other: $66,225,000
Other - Water Utilities: $8,107,000
Other - Water Utilities: $6,635,000
Other - Regular Highways: $5,673,000
Other - Regular Highways: $4,270,000
- Local Intergovernmental - Water Utilities: $6,784,000
Water Utilities: $5,227,000
Sewerage: $2,776,000
Sewerage: $2,294,000
- Long Term Debt - Beginning Outstanding - Unspecified Public Purpose: $9,988,000
Outstanding Unspecified Public Purpose: $9,249,000
Beginning Outstanding - Unspecified Public Purpose: $5,041,000
Retired Unspecified Public Purpose: $3,453,000
Outstanding Unspecified Public Purpose: $1,588,000
Retired Unspecified Public Purpose: $739,000
- Miscellaneous - Interest Earnings: $1,293,000
General Revenue - Other: $481,000
General Revenue - Other: $460,000
Rents: $39,000
Rents: $28,000
- Other Capital Outlay - Sewerage: $2,028,000
Regular Highways: $349,000
Financial Administration: $180,000
Regular Highways: $175,000
Financial Administration: $129,000
Police Protection: $78,000
Public Welfare - Other: $66,000
Central Staff Services: $62,000
General Public Building: $52,000
Central Staff Services: $44,000
Public Welfare - Other: $44,000
Judicial and Legal Services: $28,000
Correctional Institutions: $27,000
Sewerage: $21,000
Judicial and Legal Services: $20,000
General Public Building: $16,000
Health - Other: $11,000
Health - Other: $7,000
Police Protection: $2,000
- State Intergovernmental - Public Welfare: $11,116,000
Public Welfare: $9,084,000
Health and Hospitals: $3,057,000
Highways: $2,959,000
Health and Hospitals: $2,527,000
Highways: $2,275,000
- Tax - Property: $24,253,000
General Sales and Gross Receipts: $17,938,000
General Sales and Gross Receipts: $17,615,000
Property: $16,740,000
Other: $747,000
Other License: $655,000
Other: $606,000
Other License: $590,000
Motor Vehicle License: $243,000
Motor Vehicle License: $234,000
- Total Salaries and Wages: $31,938,000
: $29,225,000
- Water Utilities - Interest on Debt: $535,000
Interest on Debt: $202,000
Supplemental Security Income (SSI) in 2006:
- Total number of recipients: 2,161
- Number of aged recipients: 121
- Number of blind and disabled recipients: 2,040
- Number of recipients under 18: 274
- Number of recipients between 18 and 64: 1,575
- Number of recipients older than 64: 312
- Number of recipients also receiving OASDI: 613
- Amount of payments (thousands of dollars): 1,026
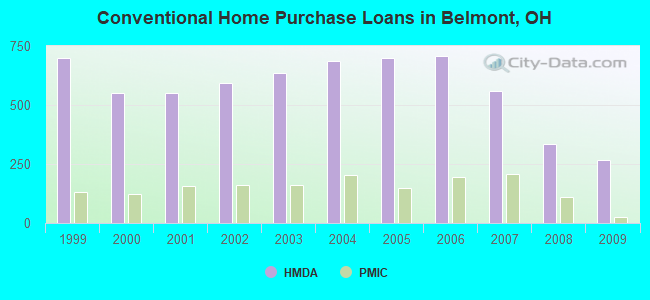
| Home Mortgage Disclosure Act Aggregated Statistics For Year 2009 (Based on 20 full tracts) | ||||||||||||
| A) FHA, FSA/RHS & VA Home Purchase Loans | B) Conventional Home Purchase Loans | C) Refinancings | D) Home Improvement Loans | F) Non-occupant Loans on < 5 Family Dwellings (A B C & D) | G) Loans On Manufactured Home Dwelling (A B C & D) | |||||||
|---|---|---|---|---|---|---|---|---|---|---|---|---|
| Number | Average Value | Number | Average Value | Number | Average Value | Number | Average Value | Number | Average Value | Number | Average Value | |
| LOANS ORIGINATED | 206 | $89,107 | 269 | $103,792 | 711 | $109,973 | 211 | $27,076 | 75 | $63,733 | 34 | $66,000 |
| APPLICATIONS APPROVED, NOT ACCEPTED | 8 | $89,625 | 19 | $95,526 | 44 | $100,455 | 16 | $46,062 | 3 | $155,000 | 8 | $46,750 |
| APPLICATIONS DENIED | 41 | $83,146 | 63 | $81,698 | 345 | $91,988 | 132 | $20,970 | 31 | $55,129 | 23 | $68,783 |
| APPLICATIONS WITHDRAWN | 18 | $85,778 | 29 | $139,103 | 146 | $130,877 | 16 | $51,000 | 6 | $184,833 | 3 | $60,000 |
| FILES CLOSED FOR INCOMPLETENESS | 6 | $92,333 | 3 | $36,000 | 39 | $103,410 | 1 | $47,000 | 3 | $43,667 | 1 | $49,000 |
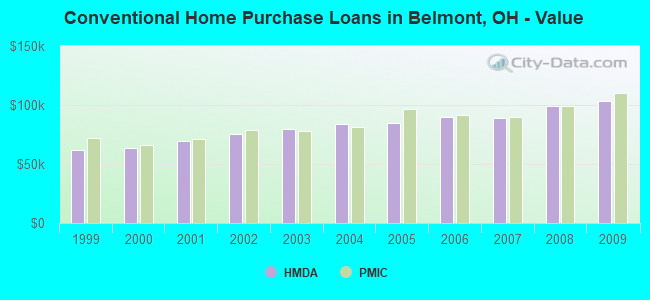
| Private Mortgage Insurance Companies Aggregated Statistics For Year 2009 (Based on 19 full tracts) | ||||
| A) Conventional Home Purchase Loans | B) Refinancings | |||
|---|---|---|---|---|
| Number | Average Value | Number | Average Value | |
| LOANS ORIGINATED | 25 | $110,360 | 22 | $156,545 |
| APPLICATIONS APPROVED, NOT ACCEPTED | 5 | $133,800 | 10 | $132,000 |
| APPLICATIONS DENIED | 8 | $137,125 | 5 | $138,200 |
| APPLICATIONS WITHDRAWN | 7 | $103,286 | 7 | $195,571 |
| FILES CLOSED FOR INCOMPLETENESS | 0 | $0 | 1 | $87,000 |
| Most common first names in Belmont County, OH among deceased individuals | ||
| Name | Count | Lived (average) |
|---|---|---|
| Mary | 1,175 | 80.9 years |
| John | 1,062 | 75.7 years |
| William | 879 | 74.9 years |
| Charles | 627 | 74.5 years |
| James | 551 | 72.7 years |
| Joseph | 526 | 75.4 years |
| George | 510 | 74.3 years |
| Robert | 499 | 71.0 years |
| Anna | 438 | 81.8 years |
| Helen | 429 | 79.8 years |
| Most common last names in Belmont County, OH among deceased individuals | ||
| Last name | Count | Lived (average) |
|---|---|---|
| Smith | 249 | 75.2 years |
| Brown | 217 | 77.1 years |
| Johnson | 209 | 77.1 years |
| Miller | 158 | 78.2 years |
| Davis | 141 | 74.9 years |
| Jones | 140 | 76.3 years |
| Moore | 135 | 75.8 years |
| Williams | 126 | 75.1 years |
| Wilson | 116 | 78.0 years |
| Carpenter | 111 | 75.5 years |
| Businesses in Belmont County, OH | ||||
| Name | Count | Name | Count | |
|---|---|---|---|---|
| ALDI | 1 | Macy's | 1 | |
| AT&T | 1 | Marriott | 1 | |
| Advance Auto Parts | 2 | MasterBrand Cabinets | 1 | |
| Aeropostale | 1 | McDonald's | 6 | |
| American Eagle Outfitters | 1 | Men's Wearhouse | 2 | |
| Applebee's | 1 | Motherhood Maternity | 1 | |
| Arby's | 2 | New Balance | 1 | |
| AutoZone | 2 | Nike | 1 | |
| Bath & Body Works | 1 | Outback | 1 | |
| Buffalo Wild Wings | 1 | Outback Steakhouse | 1 | |
| Burger King | 3 | Pac Sun | 1 | |
| CVS | 2 | Panera Bread | 1 | |
| Carson Pirie Scott | 1 | Papa John's Pizza | 1 | |
| Circle K | 1 | Payless | 2 | |
| Cracker Barrel | 1 | Penske | 1 | |
| Curves | 3 | Pier 1 Imports | 1 | |
| Dairy Queen | 6 | Pizza Hut | 2 | |
| Days Inn | 1 | Quiznos | 2 | |
| Deb | 1 | RadioShack | 2 | |
| Dennys | 1 | Red Lobster | 1 | |
| Domino's Pizza | 4 | Red Roof Inn | 1 | |
| Econo Lodge | 1 | Rite Aid | 3 | |
| Fashion Bug | 1 | Sam's Club | 1 | |
| FedEx | 5 | Sears | 2 | |
| Finish Line | 1 | Spencer Gifts | 1 | |
| Ford | 1 | Staples | 1 | |
| GNC | 2 | Starbucks | 1 | |
| GameStop | 1 | Steak 'n Shake | 1 | |
| Goodwill | 2 | Subway | 7 | |
| H&R Block | 6 | Super 8 | 1 | |
| Hilton | 1 | T-Mobile | 1 | |
| Holiday Inn | 1 | Taco Bell | 1 | |
| Jones New York | 3 | Toys"R"Us | 1 | |
| KFC | 2 | True Value | 3 | |
| Kmart | 1 | U-Haul | 7 | |
| Kroger | 4 | UPS | 9 | |
| La-Z-Boy | 3 | Value City Furniture | 1 | |
| Lane Furniture | 3 | Verizon Wireless | 3 | |
| LensCrafters | 1 | Victoria's Secret | 1 | |
| Little Caesars Pizza | 2 | Walmart | 1 | |
| Long John Silver's | 1 | Wendy's | 3 | |
| Lowe's | 1 | World Gym | 1 | |
Belmont County on our top lists:
- #19 on the list of "Top 101 counties with the highest number of deaths per 1000 residents 2007-2013 (pop. 50,000+)"
- #41 on the list of "Top 101 counties with the highest Sulfur Oxides Annual air pollution readings in 2012 (µg/m3)"
- #47 on the list of "Top 101 counties with the lowest percentage of residents relocating to other counties in 2011 (pop. 50,000+)"
- #70 on the list of "Top 101 counties with the lowest percentage of residents relocating to other counties in 2011"
- #85 on the list of "Top 101 counties with the lowest percentage of residents relocating from other counties between 2010 and 2011 (pop. 50,000+)"
- #96 on the list of "Top 101 counties with the lowest surface withdrawal of fresh water for public supply (pop. 50,000+)"