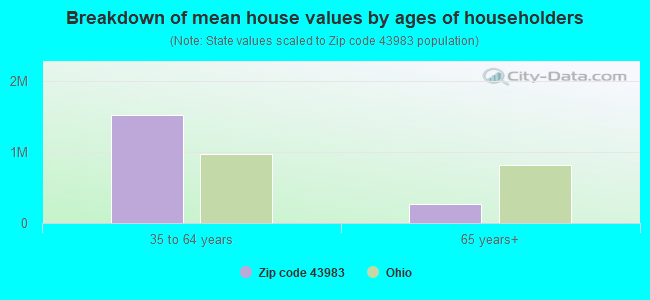
Estimated median house/condo value in 2022: $214,789
43983:
$214,789
Ohio:
$204,100
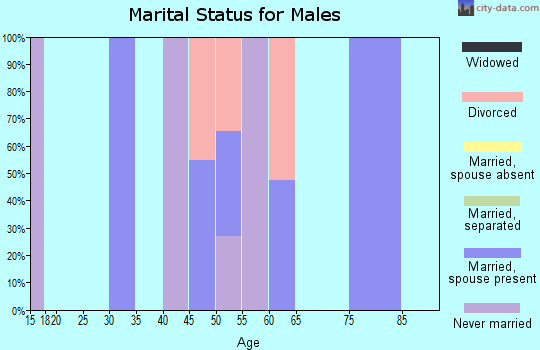
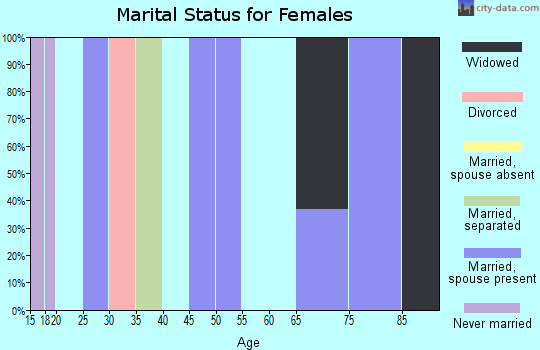
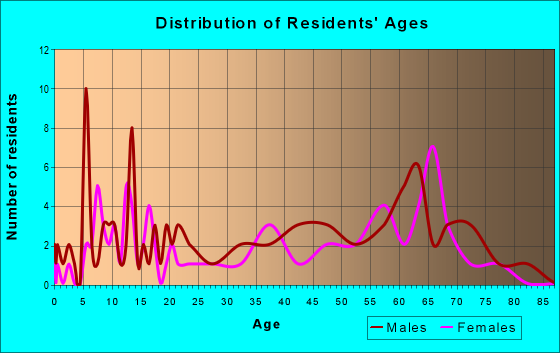
Median resident age:
This zip code:
17.6 years
Ohio median age:
39.9 years
Average household size:
This zip code:
3.7 people
Ohio:
2.4 people
Averages for the 2020 tax year for zip code 43983, filed in 2021:
Average Adjusted Gross Income (AGI) in 2020: $51,005 (Individual Income Tax Returns)
Here:
$51,005
State:
$67,288
Salary/wage: $46,443 (reported on 63.6% of returns)
Here:
$46,443
State:
$55,628
(% of AGI for various income ranges: 1042.5% for AGIs below $25k, 2546.0% for AGIs $25k-50k, 8476.7% for AGIs $50k-75k)
Taxable interest for individuals: $300 (reported on 22.7% of returns)
This zip code:
$300
Ohio:
$1,518
(% of AGI for various income ranges: 17.5% for AGIs below $25k, 26.7% for AGIs $50k-75k)
Ordinary dividends: $1,833 (reported on 13.6% of returns)
Here:
$1,833
State:
$7,167
(% of AGI for various income ranges: 110.0% for AGIs $25k-50k)
Net capital gain/loss in AGI: +$1,933 (reported on 13.6% of returns)
Here:
+$1,933
State:
+$18,919
(% of AGI for various income ranges: 116.0% for AGIs $25k-50k)
Profit/loss from business: +$18,650 (reported on 9.1% of returns)
Here:
+$18,650
State:
+$13,744
(% of AGI for various income ranges: 746.0% for AGIs $25k-50k)
Taxable individual retirement arrangement distribution: $9,300 (reported on 13.6% of returns)
43983:
$9,300
Ohio:
$18,876
(% of AGI for various income ranges: 558.0% for AGIs $25k-50k)
Earned income credit: $1,750 (reported on 9.1% of returns)
Here:
$1,750
State:
$2,304
(% of AGI for various income ranges: 87.5% for AGIs below $25k)
Percentage of individuals using paid preparers for their 2020 taxes: 95.5%
Here:
95%
State:
94%
(% for various income ranges: 83.3% for AGIs below $25k, 100.0% for AGIs $25k-50k, 100.0% for AGIs $50k-75k, 100.0% for AGIs $75k-100k, 100.0% for AGIs $100k-200k)
Averages for the 2012 tax year for zip code 43983, filed in 2013:
Average Adjusted Gross Income (AGI) in 2012: $48,433 (Individual Income Tax Returns)
Here:
$48,433
State:
$54,926
Salary/wage: $30,306 (reported on 76.2% of returns)
Here:
$30,306
State:
$45,869
(% of AGI for various income ranges: 63.4% for AGIs below $25k, 64.0% for AGIs $25k-50k, 59.9% for AGIs $50k-75k, 32.7% for AGIs $75k-100k)
Taxable interest for individuals: $800 (reported on 28.6% of returns)
This zip code:
$800
Ohio:
$1,297
(% of AGI for various income ranges: 1.6% for AGIs $25k-50k, 0.9% for AGIs $50k-75k)
Ordinary dividends: $1,300 (reported on 14.3% of returns)
Here:
$1,300
State:
$5,821
(% of AGI for various income ranges: 2.0% for AGIs $25k-50k)
Profit/loss from business: +$9,100 (reported on 14.3% of returns)
Here:
+$9,100
State:
+$12,773
(% of AGI for various income ranges: 20.1% for AGIs below $25k)
Taxable individual retirement arrangement distribution: $8,200 (reported on 9.5% of returns)
43983:
$8,200
Ohio:
$14,511
(% of AGI for various income ranges: 12.1% for AGIs below $25k)
Total itemized deductions: $15,467 (12% of AGI, reported on 14.3% of returns)
Here:
$15,467
State:
$21,278
Here:
11.7% of AGI
State:
18.8% of AGI
(% of AGI for various income ranges: 25.2% for AGIs $50k-75k)
Taxes paid: $5,867 (reported on 14.3% of returns)
43983:
$5,867
State:
$9,568
(% of AGI for various income ranges: 9.6% for AGIs $50k-75k)
Earned income credit: $2,067 (reported on 14.3% of returns)
Here:
$2,067
State:
$2,285
(% of AGI for various income ranges: 4.6% for AGIs below $25k)
Percentage of individuals using paid preparers for their 2012 taxes: 61.9%
Here:
62%
State:
51%
(% for various income ranges: 55.6% for AGIs below $25k, 50.0% for AGIs $25k-50k, 66.7% for AGIs $50k-75k, 100.0% for AGIs $75k-100k)
Averages for the 2004 tax year for zip code 43983, filed in 2005:
Average Adjusted Gross Income (AGI) in 2004: $30,068 (Individual Income Tax Returns)
Here:
$30,068
State:
$44,480
Salary/wage: $23,667 (reported on 79.1% of returns)
Here:
$23,667
State:
$39,198
(% of AGI for various income ranges: 66.7% for AGIs below $10k, 72.1% for AGIs $10k-25k, 71.3% for AGIs $25k-50k, 66.2% for AGIs $50k-75k, 38.7% for AGIs $75k-100k)
Taxable interest for individuals: $419 (reported on 39.6% of returns)
This zip code:
$419
Ohio:
$1,532
(% of AGI for various income ranges: 3.3% for AGIs below $10k, 0.7% for AGIs $10k-25k, 0.5% for AGIs $25k-50k, 0.5% for AGIs $50k-75k)
Taxable dividends: $964 (reported on 11.9% of returns)
Here:
$964
State:
$3,496
Net capital gain/loss: +$4,833 (reported on 7.7% of returns)
Here:
+$4,833
State:
+$8,582
Profit/loss from business: +$2,216 (reported on 15.7% of returns)
Here:
+$2,216
State:
+$10,813
Total itemized deductions: $12,864 (21% of AGI, reported on 9.4% of returns)
Here:
$12,864
State:
$17,503
Here:
20.5% of AGI
State:
20.8% of AGI
Charity contributions deductions: $1,083 (1% of AGI, reported on 5.1% of returns)
Here:
$1,083
State:
$3,087
Here:
1.3% of AGI
State:
3.4% of AGI
Total tax: $3,537 (reported on 69.8% of returns)
43983:
$3,537
State:
$6,781
(% of AGI for various income ranges: 1.3% for AGIs below $10k, 3.8% for AGIs $10k-25k, 5.6% for AGIs $25k-50k, 9.9% for AGIs $50k-75k, 14.6% for AGIs $75k-100k)
Earned income credit: $1,359 (reported on 16.6% of returns)
Here:
$1,359
State:
$1,696
Percentage of individuals using paid preparers for their 2004 taxes: 57.4%
Here:
57%
State:
55%
(% for various income ranges: 57.1% for AGIs below $10k, 59.4% for AGIs $10k-25k, 54.4% for AGIs $25k-50k, 57.7% for AGIs $50k-75k, 62.5% for AGIs $75k-100k)
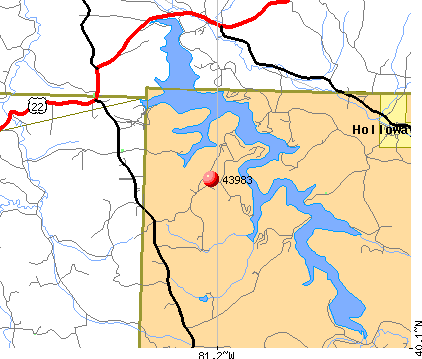
Notable locations in zip code 43983: Briar Hill Club (A), Harrison County Club (B), Hazelwood Hill Club (C), Piedmont Lake Marina (D), Camp Presmont (E), Briar Hill Farm (F), Moorefield Township Fire Department (G). Display/hide their locations on the map
Churches in zip code 43983 include: Oak Grove Methodist Episcopal Church (A), Belmont Ridge Methodist Episcopal Church (B). Display/hide their locations on the map
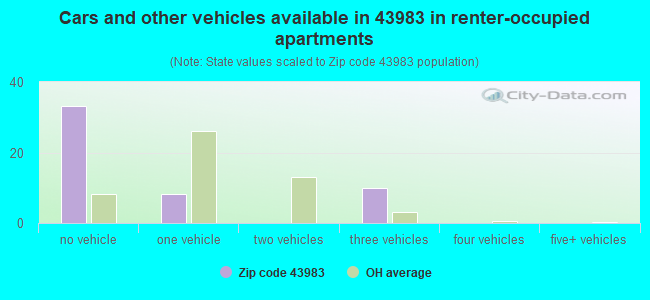
Size of family households: 63 2-persons, 2 3-persons, 33 7-or-more-persons
Size of nonfamily households: 45 1-person
279 married couples with children.
0 single-parent households ().
100.2% of residents of 43983 zip code speak English at home.
Foreign born population: 0 (0.0%)
:
0.0%
Whole state:
5.0%
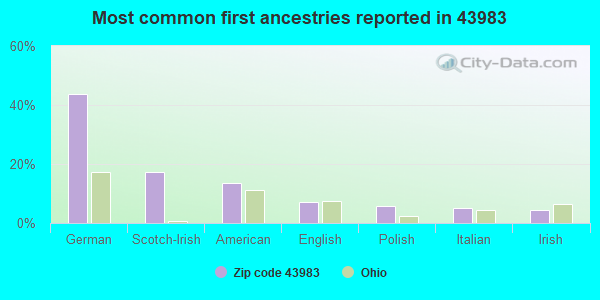
44%German
17%Scotch-Irish
14%American
7%English
6%Polish
5%Italian
4%Irish
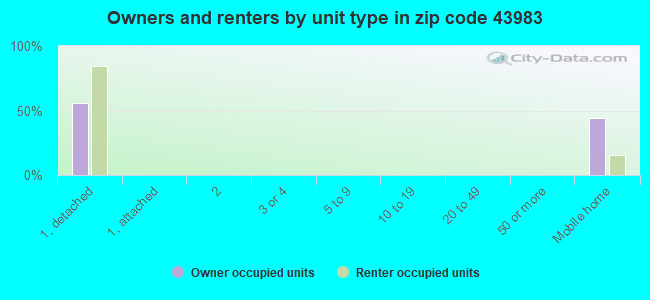
Housing units lacking complete plumbing facilities: 13.9% Housing units lacking complete kitchen facilities: 9.6%
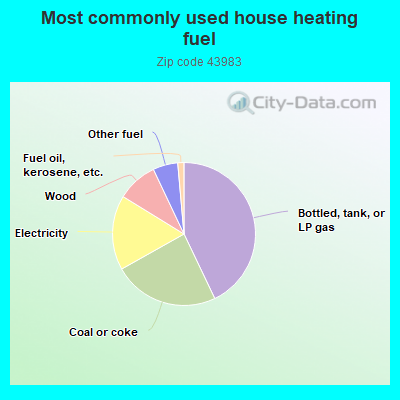
43.4%Bottled, tank, or LP gas
24.2%Coal or coke
17.1%Electricity
9.3%Wood
5.7%Other fuel
1.4%Fuel oil, kerosene, etc.
Population in 1990: 420. Population change in the 1990s: +13 (+3.1%).
Place of birth for U.S.-born residents:
This state: 85
Northeast: 74
Midwest: 21
South: 343
78% of the 43983 zip code residents lived in the same house 5 years ago. Out of people who lived in different houses, 0% lived in this county. Out of people who lived in different counties, 50% lived in Ohio.
101% of the 43983 zip code residents lived in the same house 1 year ago.
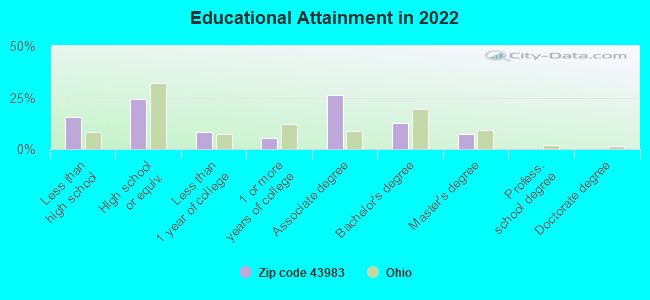
Private vs. public school enrollment:
Students in private schools in grades 1 to 8 (elementary and middle school):
Here:
0.0%
Ohio:
16.0%
Students in private schools in grades 9 to 12 (high school):
Here:
0.0%
Ohio:
13.1%
Top industries in this zip code by the number of employees in 2005:
Accommodation and Food Services: Snack and Nonalcoholic Beverage Bars (1-4 employees: 2 establishments)
Accommodation and Food Services: Recreational and Vacation Camps (except Campgrounds) (1-4: 2)
Finance and Insurance: Insurance Agencies and Brokerages (1-4: 1)
Construction: Residential Remodelers (1-4: 1)
Construction: Masonry Contractors (1-4: 1)
Home Mortgage Disclosure Act Aggregated Statistics For Year 2009 (Based on 2 partial tracts)
A) FHA, FSA/RHS & VA Home Purchase Loans
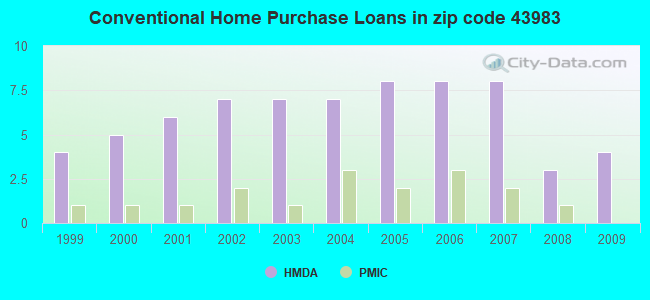
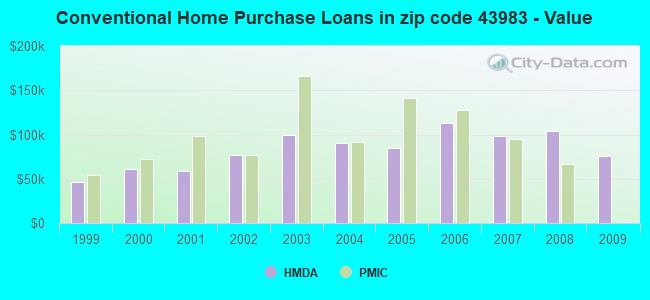
B) Conventional Home Purchase Loans
C) Refinancings
D) Home Improvement Loans
F) Non-occupant Loans on < 5 Family Dwellings (A B C & D)
G) Loans On Manufactured Home Dwelling (A B C & D)
Number
Average Value
Number
Average Value
Number
Average Value
Number
Average Value
Number
Average Value
Number
Average Value
LOANS ORIGINATED
2
$147,785
4
$75,712
9
$130,878
3
$17,193
2
$40,250
1
$40,770
APPLICATIONS APPROVED, NOT ACCEPTED
0
$0
1
$67,810
0
$0
0
$0
0
$0
0
$0
APPLICATIONS DENIED
0
$0
1
$46,590
2
$106,600
1
$38,270
0
$0
0
$0
APPLICATIONS WITHDRAWN
0
$0
0
$0
2
$210,600
0
$0
0
$0
0
$0
FILES CLOSED FOR INCOMPLETENESS
0
$0
0
$0
0
$0
0
$0
0
$0
0
$0
Aggregated Statistics For Year 2008 (Based on 2 partial tracts)
A) FHA, FSA/RHS & VA Home Purchase Loans
B) Conventional Home Purchase Loans
C) Refinancings
D) Home Improvement Loans
F) Non-occupant Loans on < 5 Family Dwellings (A B C & D)
G) Loans On Manufactured Home Dwelling (A B C & D)
Number
Average Value
Number
Average Value
Number
Average Value
Number
Average Value
Number
Average Value
Number
Average Value
LOANS ORIGINATED
2
$87,775
3
$103,860
8
$96,278
1
$22,260
1
$68,020
1
$68,430
APPLICATIONS APPROVED, NOT ACCEPTED
0
$0
0
$0
0
$0
0
$0
0
$0
0
$0
APPLICATIONS DENIED
1
$67,180
2
$89,650
5
$78,250
2
$33,070
0
$0
0
$0
APPLICATIONS WITHDRAWN
0
$0
1
$145,180
3
$139,847
0
$0
0
$0
0
$0
FILES CLOSED FOR INCOMPLETENESS
0
$0
0
$0
0
$0
0
$0
0
$0
0
$0
Aggregated Statistics For Year 2007 (Based on 2 partial tracts)
A) FHA, FSA/RHS & VA Home Purchase Loans
B) Conventional Home Purchase Loans
C) Refinancings
D) Home Improvement Loans
F) Non-occupant Loans on < 5 Family Dwellings (A B C & D)
G) Loans On Manufactured Home Dwelling (A B C & D)
Number
Average Value
Number
Average Value
Number
Average Value
Number
Average Value
Number
Average Value
Number
Average Value
LOANS ORIGINATED
1
$47,420
8
$98,228
9
$82,113
6
$46,903
2
$65,830
1
$51,580
APPLICATIONS APPROVED, NOT ACCEPTED
0
$0
1
$117,310
2
$126,465
0
$0
0
$0
0
$0
APPLICATIONS DENIED
0
$0
2
$111,905
11
$84,807
3
$25,583
1
$37,650
1
$46,380
APPLICATIONS WITHDRAWN
0
$0
1
$115,860
4
$92,195
1
$25,790
0
$0
0
$0
FILES CLOSED FOR INCOMPLETENESS
0
$0
0
$0
1
$137,490
0
$0
0
$0
0
$0
Aggregated Statistics For Year 2006 (Based on 2 partial tracts)
A) FHA, FSA/RHS & VA Home Purchase Loans
B) Conventional Home Purchase Loans
C) Refinancings
D) Home Improvement Loans
F) Non-occupant Loans on < 5 Family Dwellings (A B C & D)
G) Loans On Manufactured Home Dwelling (A B C & D)
Number
Average Value
Number
Average Value
Number
Average Value
Number
Average Value
Number
Average Value
Number
Average Value
LOANS ORIGINATED
1
$77,380
8
$112,658
9
$85,580
5
$24,460
1
$94,220
1
$24,750
APPLICATIONS APPROVED, NOT ACCEPTED
0
$0
1
$65,100
2
$81,430
0
$0
0
$0
0
$0
APPLICATIONS DENIED
0
$0
1
$77,170
9
$87,891
4
$35,985
0
$0
1
$54,910
APPLICATIONS WITHDRAWN
0
$0
1
$86,940
4
$79,092
1
$28,080
0
$0
0
$0
FILES CLOSED FOR INCOMPLETENESS
0
$0
1
$67,810
2
$94,430
0
$0
0
$0
0
$0
Aggregated Statistics For Year 2005 (Based on 2 partial tracts)
A) FHA, FSA/RHS & VA Home Purchase Loans
B) Conventional Home Purchase Loans
C) Refinancings
D) Home Improvement Loans
F) Non-occupant Loans on < 5 Family Dwellings (A B C & D)
G) Loans On Manufactured Home Dwelling (A B C & D)
Number
Average Value
Number
Average Value
Number
Average Value
Number
Average Value
Number
Average Value
Number
Average Value
LOANS ORIGINATED
2
$40,040
8
$85,202
8
$95,628
5
$36,566
2
$35,670
1
$67,390
APPLICATIONS APPROVED, NOT ACCEPTED
0
$0
1
$132,080
2
$65,000
0
$0
0
$0
1
$23,500
APPLICATIONS DENIED
0
$0
4
$65,572
11
$69,605
4
$27,925
0
$0
2
$53,250
APPLICATIONS WITHDRAWN
0
$0
1
$139,570
7
$92,590
0
$0
0
$0
0
$0
FILES CLOSED FOR INCOMPLETENESS
0
$0
0
$0
1
$58,030
0
$0
0
$0
0
$0
Aggregated Statistics For Year 2004 (Based on 2 partial tracts)
A) FHA, FSA/RHS & VA Home Purchase Loans
B) Conventional Home Purchase Loans
C) Refinancings
D) Home Improvement Loans
F) Non-occupant Loans on < 5 Family Dwellings (A B C & D)
G) Loans On Manufactured Home Dwelling (A B C & D)
Number
Average Value
Number
Average Value
Number
Average Value
Number
Average Value
Number
Average Value
Number
Average Value
LOANS ORIGINATED
1
$106,910
7
$90,094
12
$87,238
2
$29,430
2
$55,745
1
$87,780
APPLICATIONS APPROVED, NOT ACCEPTED
0
$0
1
$95,890
2
$64,170
1
$52,000
0
$0
0
$0
APPLICATIONS DENIED
0
$0
3
$66,907
7
$73,067
2
$15,495
0
$0
1
$56,990
APPLICATIONS WITHDRAWN
0
$0
1
$48,050
6
$66,525
0
$0
0
$0
0
$0
FILES CLOSED FOR INCOMPLETENESS
0
$0
0
$0
1
$132,290
0
$0
0
$0
0
$0
Aggregated Statistics For Year 2003 (Based on 2 partial tracts)
A) FHA, FSA/RHS & VA Home Purchase Loans
B) Conventional Home Purchase Loans
C) Refinancings
D) Home Improvement Loans
F) Non-occupant Loans on < 5 Family Dwellings (A B C & D)
Number
Average Value
Number
Average Value
Number
Average Value
Number
Average Value
Number
Average Value
LOANS ORIGINATED
1
$34,940
7
$99,424
20
$93,912
3
$10,817
1
$74,880
APPLICATIONS APPROVED, NOT ACCEPTED
0
$0
1
$16,850
5
$84,282
0
$0
0
$0
APPLICATIONS DENIED
0
$0
3
$44,233
9
$71,876
2
$8,320
0
$0
APPLICATIONS WITHDRAWN
0
$0
1
$91,730
5
$65,562
0
$0
0
$0
FILES CLOSED FOR INCOMPLETENESS
1
$42,020
0
$0
1
$95,060
0
$0
0
$0
Aggregated Statistics For Year 2002 (Based on 2 partial tracts)
A) FHA, FSA/RHS & VA Home Purchase Loans
B) Conventional Home Purchase Loans
C) Refinancings
D) Home Improvement Loans
F) Non-occupant Loans on < 5 Family Dwellings (A B C & D)
Number
Average Value
Number
Average Value
Number
Average Value
Number
Average Value
Number
Average Value
LOANS ORIGINATED
1
$86,530
7
$76,366
13
$68,736
2
$28,290
1
$28,080
APPLICATIONS APPROVED, NOT ACCEPTED
0
$0
1
$23,500
6
$58,622
1
$11,440
0
$0
APPLICATIONS DENIED
0
$0
2
$56,370
11
$53,835
1
$18,930
1
$22,460
APPLICATIONS WITHDRAWN
0
$0
0
$0
2
$67,080
0
$0
0
$0
FILES CLOSED FOR INCOMPLETENESS
1
$63,860
0
$0
1
$71,340
0
$0
0
$0
Aggregated Statistics For Year 2001 (Based on 2 partial tracts)
A) FHA, FSA/RHS & VA Home Purchase Loans
B) Conventional Home Purchase Loans
C) Refinancings
D) Home Improvement Loans
F) Non-occupant Loans on < 5 Family Dwellings (A B C & D)
Number
Average Value
Number
Average Value
Number
Average Value
Number
Average Value
Number
Average Value
LOANS ORIGINATED
1
$35,570
6
$59,072
14
$67,749
4
$14,300
1
$25,380
APPLICATIONS APPROVED, NOT ACCEPTED
0
$0
1
$42,640
4
$54,028
2
$15,390
0
$0
APPLICATIONS DENIED
0
$0
3
$32,587
7
$79,337
2
$8,010
0
$0
APPLICATIONS WITHDRAWN
0
$0
0
$0
4
$64,480
0
$0
0
$0
FILES CLOSED FOR INCOMPLETENESS
0
$0
0
$0
1
$103,790
0
$0
0
$0
Aggregated Statistics For Year 2000 (Based on 2 partial tracts)
A) FHA, FSA/RHS & VA Home Purchase Loans
B) Conventional Home Purchase Loans
C) Refinancings
D) Home Improvement Loans
F) Non-occupant Loans on < 5 Family Dwellings (A B C & D)
Number
Average Value
Number
Average Value
Number
Average Value
Number
Average Value
Number
Average Value
LOANS ORIGINATED
1
$59,700
5
$60,528
6
$56,403
4
$16,692
1
$28,910
APPLICATIONS APPROVED, NOT ACCEPTED
0
$0
1
$51,170
3
$62,887
1
$14,980
0
$0
APPLICATIONS DENIED
0
$0
5
$55,452
9
$46,477
1
$7,700
1
$31,620
APPLICATIONS WITHDRAWN
0
$0
1
$58,660
5
$55,660
0
$0
0
$0
FILES CLOSED FOR INCOMPLETENESS
0
$0
0
$0
1
$55,330
0
$0
0
$0
Aggregated Statistics For Year 1999 (Based on 1 partial tract)
A) FHA, FSA/RHS & VA Home Purchase Loans
B) Conventional Home Purchase Loans
C) Refinancings
D) Home Improvement Loans
F) Non-occupant Loans on < 5 Family Dwellings (A B C & D)
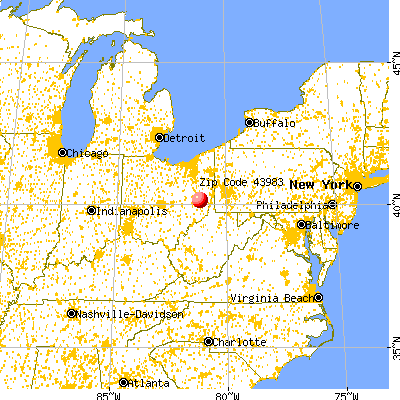


 Nearest zip codes: 43985, 43736, 43973, 43977, 43759, 43713.