Estimated zip code population in 2022: 21,540 Zip code population in 2010: 20,268 Zip code population in 2000: 21,122
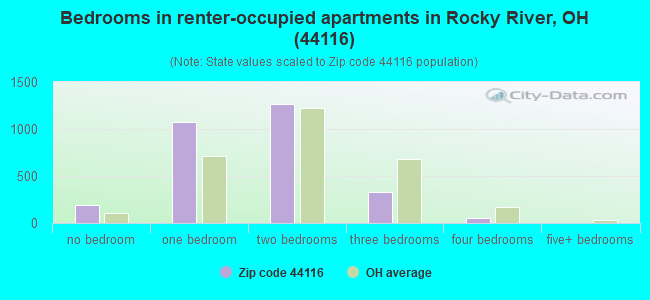
Houses and condos: 10,601 Renter-occupied apartments: 2,893
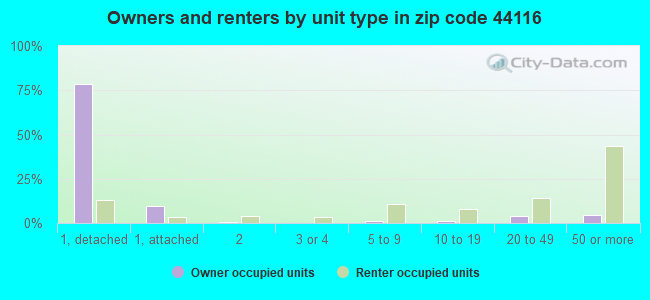
% of renters here:
29%
State:
33%
March 2022 cost of living index in zip code 44116: 96.5 (near average, U.S. average is 100)
Land area: 4.8 sq. mi. Water area: 0.9 sq. mi.
Population density: 4,493 people per square mile
(average).
OSM Map
General Map
Google Map
MSN Map
OSM Map
General Map
Google Map
MSN Map
OSM Map
General Map
Google Map
MSN Map
OSM Map
General Map
Google Map
MSN Map
Please wait while loading the map...
Real estate property taxes paid for housing units in 2022:
This zip code:
1.8% ($6,090)
Ohio:
1.3% ($2,639)
Median real estate property taxes paid for housing units with mortgages in 2022: $6,365 (1.7%) Median real estate property taxes paid for housing units with no mortgage in 2022: $5,730 (2.0%)
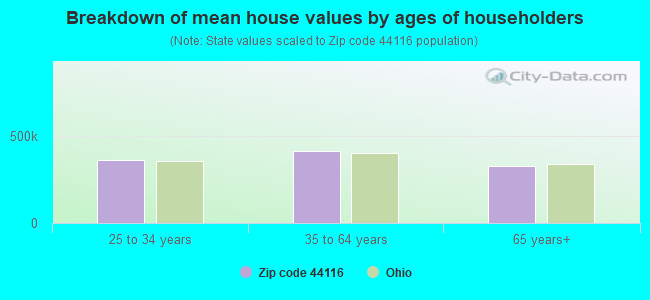
Estimated median house/condo value in 2022: $338,496
44116:
$338,496
Ohio:
$204,100
According to our research of Ohio and other state lists, there were 3 registered sex offenders living in 44116 zip code as of April 26, 2024. The ratio of all residents to sex offenders in zip code 44116 is 6,852 to 1. The ratio of registered sex offenders to all residents in this zip code is much lower than the state average.
Median resident age:
This zip code:
43.8 years
Ohio median age:
39.9 years
Average household size:
This zip code:
2.1 people
Ohio:
2.4 people
Averages for the 2020 tax year for zip code 44116, filed in 2021:
Average Adjusted Gross Income (AGI) in 2020: $125,098 (Individual Income Tax Returns)
Here:
$125,098
State:
$67,288
Salary/wage: $95,959 (reported on 76.0% of returns)
Here:
$95,959
State:
$55,628
(% of AGI for various income ranges: 1097.2% for AGIs below $25k, 3502.4% for AGIs $25k-50k, 6401.4% for AGIs $50k-75k, 9653.2% for AGIs $75k-100k, 19038.1% for AGIs $100k-200k, 100549.3% for AGIs over 200k)
Taxable interest for individuals: $2,964 (reported on 45.8% of returns)
This zip code:
$2,964
Ohio:
$1,518
(% of AGI for various income ranges: 35.3% for AGIs below $25k, 66.4% for AGIs $25k-50k, 88.3% for AGIs $50k-75k, 116.4% for AGIs $75k-100k, 233.6% for AGIs $100k-200k, 2346.3% for AGIs over 200k)
Ordinary dividends: $15,370 (reported on 39.6% of returns)
Here:
$15,370
State:
$7,167
(% of AGI for various income ranges: 76.7% for AGIs below $25k, 164.7% for AGIs $25k-50k, 265.3% for AGIs $50k-75k, 375.1% for AGIs $75k-100k, 942.8% for AGIs $100k-200k, 12218.8% for AGIs over 200k)
Net capital gain/loss in AGI: +$38,383 (reported on 35.5% of returns)
Here:
+$38,383
State:
+$18,919
(% of AGI for various income ranges: 36.3% for AGIs below $25k, 90.7% for AGIs $25k-50k, 198.1% for AGIs $50k-75k, 280.7% for AGIs $75k-100k, 930.6% for AGIs $100k-200k, 34219.3% for AGIs over 200k)
Profit/loss from business: +$24,692 (reported on 15.3% of returns)
Here:
+$24,692
State:
+$13,744
(% of AGI for various income ranges: 118.4% for AGIs below $25k, 205.4% for AGIs $25k-50k, 274.7% for AGIs $50k-75k, 410.7% for AGIs $75k-100k, 790.3% for AGIs $100k-200k, 5766.6% for AGIs over 200k)
Taxable individual retirement arrangement distribution: $23,623 (reported on 15.4% of returns)
44116:
$23,623
Ohio:
$18,876
(% of AGI for various income ranges: 142.9% for AGIs below $25k, 222.1% for AGIs $25k-50k, 442.1% for AGIs $50k-75k, 714.3% for AGIs $75k-100k, 1130.2% for AGIs $100k-200k, 3256.6% for AGIs over 200k)
Self-employed (Keogh) retirement plans: $25,985 (reported on 1.7% of returns)
44116:
$25,985
Ohio:
$24,898
(% of AGI for various income ranges: 33.3% for AGIs $50k-75k, 57.1% for AGIs $100k-200k, 1010.7% for AGIs over 200k)
Total itemized deductions: $40,365 (reported on 13.5% of returns)
Here:
$40,365
State:
$33,869
(% of AGI for various income ranges: 94.1% for AGIs below $25k, 222.9% for AGIs $25k-50k, 421.9% for AGIs $50k-75k, 629.6% for AGIs $75k-100k, 998.4% for AGIs $100k-200k, 9124.9% for AGIs over 200k)
Charity contributions: $20,029 (reported on 11.4% of returns)
Here:
$20,029
State:
$14,577
(% of AGI for various income ranges: 3.2% for AGIs below $25k, 24.4% for AGIs $25k-50k, 53.6% for AGIs $50k-75k, 108.0% for AGIs $75k-100k, 219.8% for AGIs $100k-200k, 5386.6% for AGIs over 200k)
Taxes paid: $8,551 (reported on 13.4% of returns)
44116:
$8,551
State:
$7,681
(% of AGI for various income ranges: 14.3% for AGIs below $25k, 43.1% for AGIs $25k-50k, 105.1% for AGIs $50k-75k, 208.7% for AGIs $75k-100k, 337.1% for AGIs $100k-200k, 1413.7% for AGIs over 200k)
Earned income credit: $1,763 (reported on 6.1% of returns)
Here:
$1,763
State:
$2,304
(% of AGI for various income ranges: 45.0% for AGIs below $25k, 38.6% for AGIs $25k-50k)
Percentage of individuals using paid preparers for their 2020 taxes: 91.6%
Here:
92%
State:
94%
(% for various income ranges: 89.2% for AGIs below $25k, 91.2% for AGIs $25k-50k, 92.1% for AGIs $50k-75k, 92.2% for AGIs $75k-100k, 92.3% for AGIs $100k-200k, 94.5% for AGIs over 200k)
Averages for the 2012 tax year for zip code 44116, filed in 2013:
Average Adjusted Gross Income (AGI) in 2012: $94,757 (Individual Income Tax Returns)
Here:
$94,757
State:
$54,926
Salary/wage: $73,032 (reported on 77.2% of returns)
Here:
$73,032
State:
$45,869
(% of AGI for various income ranges: 63.5% for AGIs below $25k, 67.5% for AGIs $25k-50k, 67.5% for AGIs $50k-75k, 68.9% for AGIs $75k-100k, 71.6% for AGIs $100k-200k, 47.9% for AGIs over 200k)
Taxable interest for individuals: $3,144 (reported on 48.2% of returns)
This zip code:
$3,144
Ohio:
$1,297
(% of AGI for various income ranges: 2.5% for AGIs below $25k, 1.3% for AGIs $25k-50k, 1.2% for AGIs $50k-75k, 1.0% for AGIs $75k-100k, 0.9% for AGIs $100k-200k, 2.1% for AGIs over 200k)
Ordinary dividends: $13,292 (reported on 38.9% of returns)
Here:
$13,292
State:
$5,821
(% of AGI for various income ranges: 4.5% for AGIs below $25k, 2.8% for AGIs $25k-50k, 3.5% for AGIs $50k-75k, 2.9% for AGIs $75k-100k, 3.8% for AGIs $100k-200k, 7.8% for AGIs over 200k)
Net capital gain/loss in AGI: +$23,146 (reported on 31.5% of returns)
Here:
+$23,146
State:
+$11,232
(% of AGI for various income ranges: 0.3% for AGIs $25k-50k, 0.4% for AGIs $50k-75k, 0.7% for AGIs $75k-100k, 1.9% for AGIs $100k-200k, 15.6% for AGIs over 200k)
Profit/loss from business: +$21,808 (reported on 14.3% of returns)
Here:
+$21,808
State:
+$12,773
(% of AGI for various income ranges: 6.7% for AGIs below $25k, 3.5% for AGIs $25k-50k, 2.9% for AGIs $50k-75k, 3.0% for AGIs $75k-100k, 3.5% for AGIs $100k-200k, 3.0% for AGIs over 200k)
Taxable individual retirement arrangement distribution: $19,348 (reported on 18.6% of returns)
44116:
$19,348
Ohio:
$14,511
(% of AGI for various income ranges: 8.5% for AGIs below $25k, 5.2% for AGIs $25k-50k, 4.6% for AGIs $50k-75k, 5.0% for AGIs $75k-100k, 4.6% for AGIs $100k-200k, 2.4% for AGIs over 200k)
Self-employment retirement plans: $21,041 (reported on 1.5% of returns)
44116:
$21,041
Ohio:
$20,257
(% of AGI for various income ranges: 0.3% for AGIs $50k-75k, 0.2% for AGIs $100k-200k, 0.5% for AGIs over 200k)
Total itemized deductions: $29,747 (18% of AGI, reported on 48.3% of returns)
Here:
$29,747
State:
$21,278
Here:
18.3% of AGI
State:
18.8% of AGI
(% of AGI for various income ranges: 15.2% for AGIs below $25k, 12.7% for AGIs $25k-50k, 14.5% for AGIs $50k-75k, 16.3% for AGIs $75k-100k, 16.8% for AGIs $100k-200k, 14.6% for AGIs over 200k)
Charity contributions: $5,328 (reported on 42.0% of returns)
Here:
$5,328
State:
$3,943
(% of AGI for various income ranges: 1.0% for AGIs below $25k, 1.3% for AGIs $25k-50k, 1.6% for AGIs $50k-75k, 1.7% for AGIs $75k-100k, 2.1% for AGIs $100k-200k, 3.1% for AGIs over 200k)
Taxes paid: $15,214 (reported on 48.0% of returns)
44116:
$15,214
State:
$9,568
(% of AGI for various income ranges: 4.2% for AGIs below $25k, 4.4% for AGIs $25k-50k, 6.3% for AGIs $50k-75k, 7.8% for AGIs $75k-100k, 9.0% for AGIs $100k-200k, 8.1% for AGIs over 200k)
Earned income credit: $1,712 (reported on 7.3% of returns)
Here:
$1,712
State:
$2,285
(% of AGI for various income ranges: 2.9% for AGIs below $25k, 0.4% for AGIs $25k-50k)
Percentage of individuals using paid preparers for their 2012 taxes: 56.5%
Here:
57%
State:
51%
(% for various income ranges: 47.8% for AGIs below $25k, 51.6% for AGIs $25k-50k, 60.8% for AGIs $50k-75k, 61.5% for AGIs $75k-100k, 61.4% for AGIs $100k-200k, 77.3% for AGIs over 200k)
Averages for the 2004 tax year for zip code 44116, filed in 2005:
Average Adjusted Gross Income (AGI) in 2004: $67,846 (Individual Income Tax Returns)
Here:
$67,846
State:
$44,480
Salary/wage: $58,557 (reported on 73.8% of returns)
Here:
$58,557
State:
$39,198
(% of AGI for various income ranges: 345.5% for AGIs below $10k, 53.2% for AGIs $10k-25k, 67.4% for AGIs $25k-50k, 69.2% for AGIs $50k-75k, 70.4% for AGIs $75k-100k, 59.3% for AGIs over 100k)
Taxable interest for individuals: $2,779 (reported on 65.3% of returns)
This zip code:
$2,779
Ohio:
$1,532
(% of AGI for various income ranges: 67.1% for AGIs below $10k, 7.2% for AGIs $10k-25k, 3.5% for AGIs $25k-50k, 2.5% for AGIs $50k-75k, 2.3% for AGIs $75k-100k, 1.9% for AGIs over 100k)
Taxable dividends: $6,667 (reported on 47.2% of returns)
Here:
$6,667
State:
$3,496
(% of AGI for various income ranges: 52.6% for AGIs below $10k, 5.3% for AGIs $10k-25k, 3.5% for AGIs $25k-50k, 3.4% for AGIs $50k-75k, 3.8% for AGIs $75k-100k, 5.1% for AGIs over 100k)
Net capital gain/loss: +$10,740 (reported on 38.2% of returns)
Here:
+$10,740
State:
+$8,582
(% of AGI for various income ranges: -13.7% for AGIs below $10k, 1.1% for AGIs $10k-25k, 0.7% for AGIs $25k-50k, 1.4% for AGIs $50k-75k, 2.1% for AGIs $75k-100k, 9.8% for AGIs over 100k)
Profit/loss from business: +$17,407 (reported on 14.0% of returns)
Here:
+$17,407
State:
+$10,813
(% of AGI for various income ranges: 9.7% for AGIs below $10k, 6.0% for AGIs $10k-25k, 3.1% for AGIs $25k-50k, 2.7% for AGIs $50k-75k, 3.3% for AGIs $75k-100k, 3.8% for AGIs over 100k)
IRA payment deduction: $3,241 (reported on 3.1% of returns)
44116:
$3,241
Ohio:
$2,794
(% of AGI for various income ranges: 2.6% for AGIs below $10k, 0.4% for AGIs $10k-25k, 0.4% for AGIs $25k-50k, 0.2% for AGIs $50k-75k, 0.1% for AGIs $75k-100k, 0.1% for AGIs over 100k)
Self-employed pension: $15,110 (reported on 2.0% of returns)
Here:
$15,110
Ohio:
$13,981
(% of AGI for various income ranges: 0.3% for AGIs $10k-25k, 0.1% for AGIs $25k-50k, 0.2% for AGIs $50k-75k, 0.2% for AGIs $75k-100k, 0.6% for AGIs over 100k)
Total itemized deductions: $22,383 (21% of AGI, reported on 51.4% of returns)
Here:
$22,383
State:
$17,503
Here:
20.5% of AGI
State:
20.8% of AGI
(% of AGI for various income ranges: 79.3% for AGIs below $10k, 18.2% for AGIs $10k-25k, 15.7% for AGIs $25k-50k, 18.1% for AGIs $50k-75k, 18.4% for AGIs $75k-100k, 16.2% for AGIs over 100k)
Charity contributions deductions: $3,771 (3% of AGI, reported on 46.8% of returns)
Here:
$3,771
State:
$3,087
Here:
3.3% of AGI
State:
3.4% of AGI
(% of AGI for various income ranges: 3.5% for AGIs below $10k, 1.5% for AGIs $10k-25k, 1.8% for AGIs $25k-50k, 2.2% for AGIs $50k-75k, 2.2% for AGIs $75k-100k, 3.1% for AGIs over 100k)
Total tax: $12,396 (reported on 82.1% of returns)
44116:
$12,396
State:
$6,781
(% of AGI for various income ranges: 11.1% for AGIs below $10k, 4.7% for AGIs $10k-25k, 8.3% for AGIs $25k-50k, 10.1% for AGIs $50k-75k, 11.1% for AGIs $75k-100k, 19.4% for AGIs over 100k)
Earned income credit: $1,234 (reported on 5.1% of returns)
Here:
$1,234
State:
$1,696
Percentage of individuals using paid preparers for their 2004 taxes: 58.2%
Here:
58%
State:
55%
(% for various income ranges: 51.6% for AGIs below $10k, 57.8% for AGIs $10k-25k, 56.8% for AGIs $25k-50k, 60.5% for AGIs $50k-75k, 58.6% for AGIs $75k-100k, 65.5% for AGIs over 100k)
Likely homosexual households (counted as self-reported same-sex unmarried-partner households)
Lesbian couples: 0.0% of all households
Gay men: 0.3% of all households
Household received Food Stamps/SNAP in the past 12 months: 583 Household did not receive Food Stamps/SNAP in the past 12 months: 9,292
Women who had a birth in the past 12 months: 346 (347 now married, 6 unmarried) Women who did not have a birth in the past 12 months: 4,336 (1,737 now married, 2,599 unmarried)
Housing units in zip code 44116 with a mortgage: 4,133 (504 second mortgage, 425 both second mortgage and home equity loan) Houses without a mortgage: 256
Median monthly owner costs for units with a mortgage: $1,875 Median monthly owner costs for units without a mortgage: $847
Residents with income below the poverty level in 2022:
This zip code:
5.2%
Whole state:
13.4%
Residents with income below 50% of the poverty level in 2022:
This zip code:
3.4%
Whole state:
7.0%
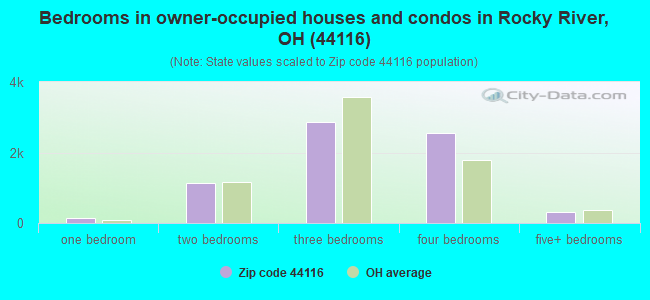
Median number of rooms in houses and condos:
Here:
7.2
State:
6.7
Median number of rooms in apartments:
Here:
3.9
State:
4.4
Notable locations in this zip code not listed on our city pages
Notable locations in zip code 44116: Cleveland Yacht Club (A), Westlake Yachting Club (B), Sea Shell Marina (C), Westwood Country Club (D), Rocky River Fire Department (E), Rocky River Public Library (F), Rocky River City Hall (G). Display/hide their locations on the map
Shopping Centers: River Plaza Shopping Center (1), Westwood Town Center Shopping Center (2), Rockport Shopping Center (3), Detroit-Linda Shopping Center (4), Rocky River Shopping Center (5), Beachcliff Market Square Shopping Center (6). Display/hide their locations on the map
Churches in zip code 44116 include: Saint Christopher Catholic Church (A), Buna Vistire Romanian Orthodox Church (B), Our Saviors Lutheran Church (C), Rockport United Methodist Church (D), Rocky River First Church of Christ Scientist (E), Rocky River Presbyterian Church (F), Rocky River United Methodist Church (G), Saint Thomas Lutheran Church (H), West Shore Unitarian Church (I). Display/hide their locations on the map
Parks in zip code 44116 include: Memorial Field Park (1), Elmwood Playground (2), Tri-City Park (3), Linden Park (4). Display/hide their locations on the map
In group quarters: 304 (-1 institutionalized population)
Size of family households: 2,716 2-persons, 1,259 3-persons, 1,142 4-persons, 236 5-persons, 208 6-persons, 45 7-or-more-persons
Size of nonfamily households: 3,799 1-person, 483 2-persons
3,871 married couples with children.
687 single-parent households (204 men, 483 women).
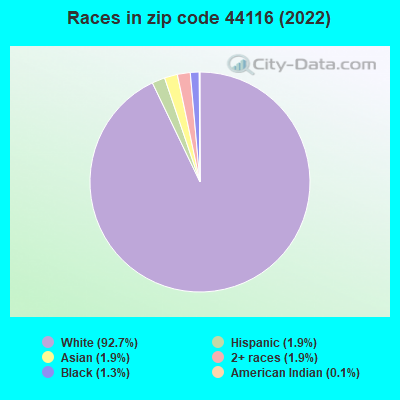
88.1% of residents of 44116 zip code speak English at home.
0.2% of residents speak Spanish at home (100% very well).
8.2% of residents speak other Indo-European language at home (71% very well, 18% well, 8% not well, 2% not at all).
0.5% of residents speak Asian or Pacific Island language at home (73% very well, 24% well, 3% not well).
3.8% of residents speak other language at home (79% very well, 14% well, 7% not well).
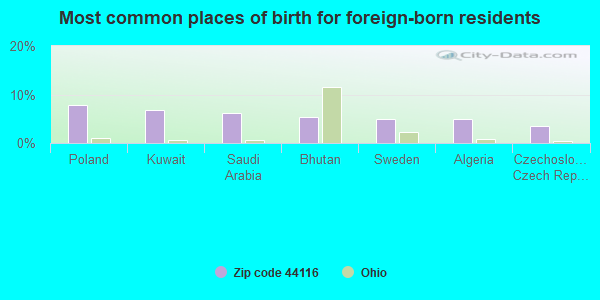
Foreign born population: 2,181 (10.1%) (75.1% of them are naturalized citizens)
This zip code:
10.1%
Whole state:
5.0%
8%Poland
7%Kuwait
6%Saudi Arabia
5%Bhutan
5%Sweden
5%Algeria
4%Czechoslovakia (includes Czech Republic and Slovakia)
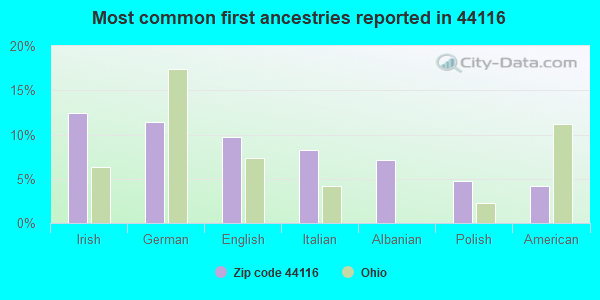
12%Irish
11%German
10%English
8%Italian
7%Albanian
5%Polish
4%American
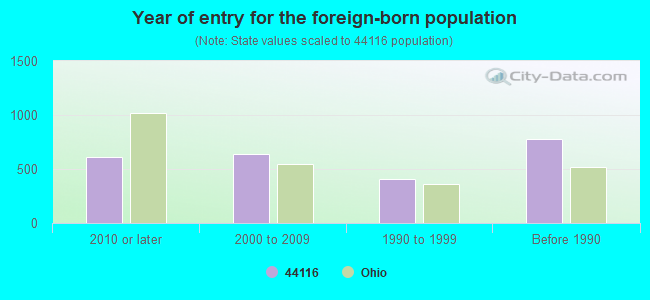
Year of entry for the foreign-born population
6152010 or later
6382000 to 2009
4111990 to 1999
782Before 1990
Facilities with environmental interests located in this zip code:
BP OIL CO SITE 04891 * (19933 LAKE RD in ROCKY RIVER, OH)
STATE MASTER (Ohio general info) - AIR MAJOR, -18-5541-168-40, EPCRA STATE MASTER (Ohio general info) - RCRA-OHD987026259, HAZARDOUS WASTE PROGRAM Conditionally Exempt Small Quantity Generators, less than 100 kg/month of hazardous waste (Resource Conservation and Recovery Act (tracking hazardous waste)) - notification Business SIC classification: GASOLINE SERVICE STATIONS Organizations: BP OIL COMPANY (CONTACT/OWNER)
, ROCKY RIVER BP (CONTACT/OWNER)
Alternative names: ROCKY RIVER BP NO 10489144 *, SOHIO OIL CO 04891 *
BP AMOCO CO 22446 (19400 HILLIARD BLVD. in ROCKY RIVER, OH)
AIR MINOR (AIRS/AFS) STATE MASTER (Ohio general info) - RCRA-OHD987026267, HAZARDOUS WASTE PROGRAM, AIR MAJOR, -18-5541-168-12, EPCRA Conditionally Exempt Small Quantity Generators, less than 100 kg/month of hazardous waste (Resource Conservation and Recovery Act (tracking hazardous waste)) - notification Business SIC classification: GASOLINE SERVICE STATIONS Organizations: BP OIL CO (CONTACT/OWNER)
, BP OIL COMPANY (CONTACT/OWNER)
Alternative names: BP AMOCO #22446 WAS #05021, BP OIL COMPANY #05021/22446, BP OIL CO SITE 05021
AMERICAN ELECTRO COATINGS (2911 BARBER AVE in CLEVELAND, OH)
(Resource Conservation and Recovery Act (tracking hazardous waste)) Organizations: KEY RICHARD MECAS (CONTACT/OWNER)
BP OIL CO (22200 CENTER RIDGE RD in ROCKY RIVER, OH)
(Resource Conservation and Recovery Act (tracking hazardous waste))
BP OIL CO SITE 04896 (3010 WOOSTER RD in ROCKY RIVER, OH)
(Resource Conservation and Recovery Act (tracking hazardous waste)) Organizations: BP OIL COMPANY (CONTACT/OWNER)
A-BRITE PLATING CO. (3000 W 121ST ST in CLEVELAND, OH)
AIR MINOR (AIRS/AFS) Business SIC classification: ELECTROPLATING, PLATING, POLISHING, ANODIZING, AND COLORING
Housing units lacking complete plumbing facilities: 0.4% Housing units lacking complete kitchen facilities: 2.0%
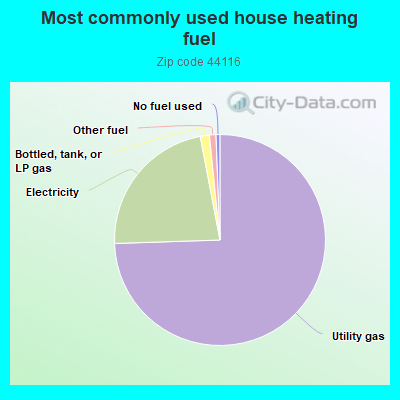
74.4%Utility gas
22.5%Electricity
1.4%Bottled, tank, or LP gas
1.0%Other fuel
0.6%No fuel used
Population in 1990: 20,410. Population change in the 1990s: +712 (+3.5%).
Place of birth for U.S.-born residents:
This state: 14,838
Northeast: 1,485
Midwest: 1,208
South: 926
West: 615
62% of the 44116 zip code residents lived in the same house 5 years ago. Out of people who lived in different houses, 74% lived in this county. Out of people who lived in different counties, 50% lived in Ohio.
89% of the 44116 zip code residents lived in the same house 1 year ago. Out of people who lived in different houses, 68% moved from this county. Out of people who lived in different houses, 11% moved from different county within same state. Out of people who lived in different houses, 15% moved from different state. Out of people who lived in different houses, 2% moved from abroad.
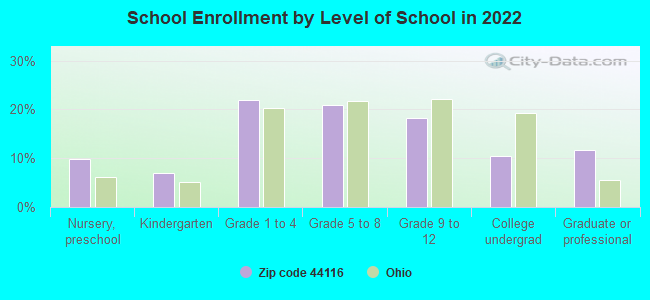
Private vs. public school enrollment:
Students in private schools in grades 1 to 8 (elementary and middle school): 316
Here:
16.2%
Ohio:
16.0%
Students in private schools in grades 9 to 12 (high school): 243
Here:
29.2%
Ohio:
13.1%
Students in private undergraduate colleges: 75
Here:
15.8%
Ohio:
22.3%
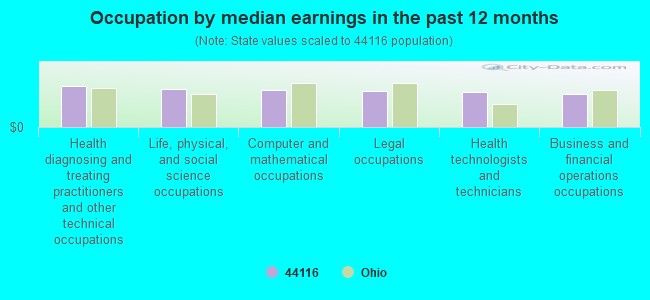
Occupation by median earnings in the past 12 months ($)
105,010Health diagnosing and treating practitioners and other technical occupations
97,606Life, physical, and social science occupations
96,705Computer and mathematical occupations
92,009Legal occupations
91,005Health technologists and technicians
84,013Business and financial operations occupations
Companies with federal contracts located in this zip code:
NATIONAL FUSE PRODUCTS INC (19100 DETROIT AVE in ROCKY RIVER, OH; small business) : $617,132 in 82 contractsfrom 2003 to 2006
Contracts for Circuit Breakers, Switches, Miscellaneous Electrical and Electronic Components, Fuses, Arresters, Absorbers, and Protectors, and moreby Defense Logistics Agency, Navy, Air Force Signed by year:2000: $0; 2001: $0; 2002: $0; 2003: $0; 2004: $223,798; 2005: $284,308; 2006: $109,026.
Biggest contracts:
$36,465 with Defense Logistics Agency for Circuit Breakers. Taking place in CA. Signed on 2005-04-29. Completion date: 2005-05-29.
$25,370 with Navy for Switches. Signed on 2004-06-03. Completion date: 2004-08-02.
$19,872 with Defense Logistics Agency for Circuit Breakers. Signed on 2004-12-27. Completion date: 2005-01-24.
$19,872, same as above.Signed on 2004-12-27. Completion date: 2005-01-24.
HILTEBRANT INDUSTRIAL SALES CO (1369 DEPOT ST in CLEVELAND, OH; small business) : $111,290 in 2 contractsin 2001
$57,440 with Defense Logistics Agency for Electric Portable and Hand Lighting Equipment. Signed on 2001-03-28. Completion date: 2001-06-03.
$53,850, same as above.Signed on 2001-02-16. Completion date: 2001-03-28.
AMERICAN TECHNICAL COATINGS IN (19915 LAKE RD in ROCKY RIVER, OH; small business)
$77,753 with Navy for Defense Electronics and Communication Equipment -- Basic Research (R&D). Signed on 2005-05-12. Completion date: 2005-11-12.
T J FREEMAN & ASSOCIATES (22340 HILLIARD BLVD in ROCKY RIVER, OH; small business)
$14,750 with Army for Miscellaneous Vehicular Components. Signed on 2005-12-20. Completion date: 2006-01-20.
Top industries in this zip code by the number of employees in 2005:
2002 - 2018 National Fire Incident Reporting System (NFIRS) incidents
Based on the data from the years 2002 - 2018 the average number of fire incidents per year is 54. The highest number of reported fires - 84 took place in 2008, and the least - 14 in 2004. The data has a growing trend.
When looking into fire subcategories, the most reports belonged to: Structure Fires (64.7%), and Outside Fires (24.8%).
Fire incident types reported to NFIRS in Zip Code 44116

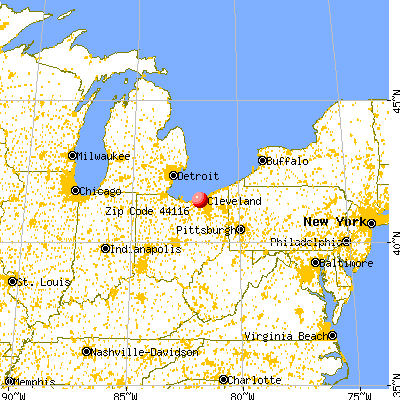


 Nearest zip codes: 44126, 44107, 44135, 44111, 44142, 44140.
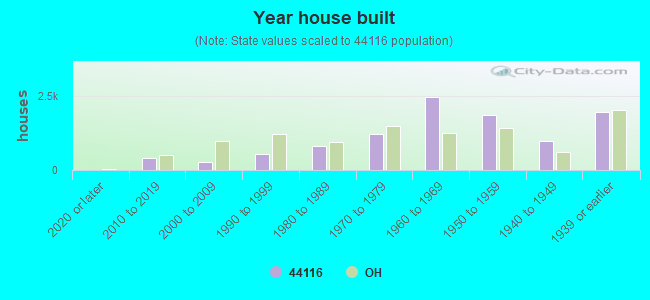


 Based on the data from the years 2002 - 2018 the average number of fire incidents per year is 54. The highest number of reported fires - 84 took place in 2008, and the least - 14 in 2004. The data has a growing trend.
 When looking into fire subcategories, the most reports belonged to: Structure Fires (64.7%), and Outside Fires (24.8%).