Estimated zip code population in 2022: 29,630 Zip code population in 2010: 29,587 Zip code population in 2000: 30,748
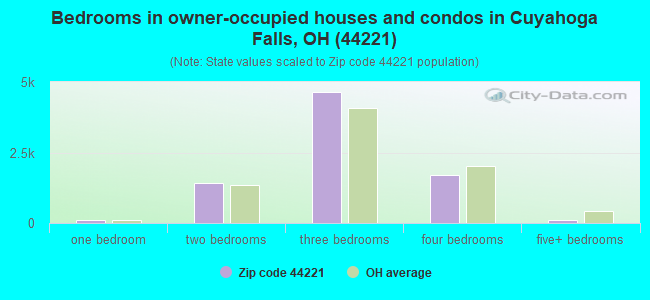
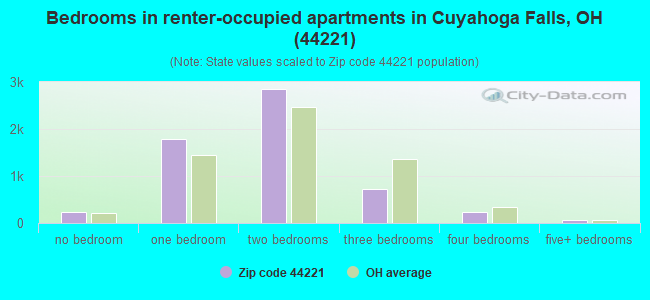
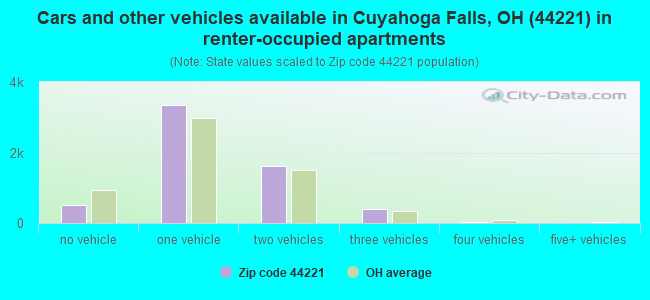
Houses and condos: 14,545 Renter-occupied apartments: 5,848
% of renters here:
42%
State:
33%
March 2022 cost of living index in zip code 44221: 95.9 (near average, U.S. average is 100)
Land area: 6.5 sq. mi. Water area: 0.0 sq. mi.
Population density: 4,554 people per square mile
(average).
OSM Map
General Map
Google Map
MSN Map
OSM Map
General Map
Google Map
MSN Map
OSM Map
General Map
Google Map
MSN Map
OSM Map
General Map
Google Map
MSN Map
Please wait while loading the map...
Real estate property taxes paid for housing units in 2022:
This zip code:
1.5% ($2,342)
Ohio:
1.3% ($2,639)
Median real estate property taxes paid for housing units with mortgages in 2022: $2,333 (1.4%) Median real estate property taxes paid for housing units with no mortgage in 2022: $2,377 (1.5%)
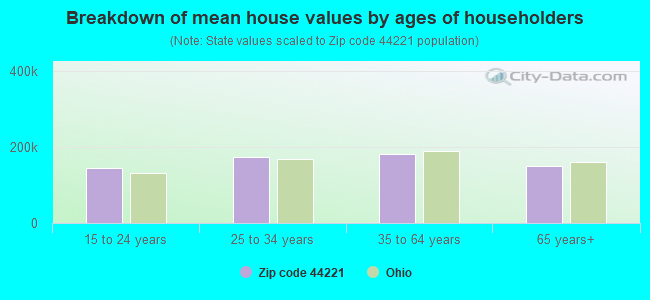
Estimated median house/condo value in 2022: $160,340
44221:
$160,340
Ohio:
$204,100
According to our research of Ohio and other state lists, there were 15 registered sex offenders living in 44221 zip code as of April 27, 2024. The ratio of all residents to sex offenders in zip code 44221 is 1,998 to 1. The ratio of registered sex offenders to all residents in this zip code is much lower than the state average.
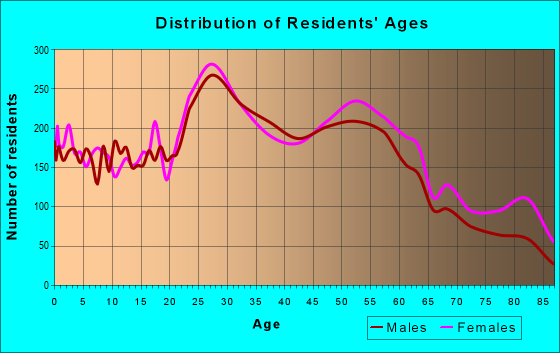
Median resident age:
This zip code:
36.1 years
Ohio median age:
39.9 years
Average household size:
This zip code:
2.1 people
Ohio:
2.4 people
Averages for the 2020 tax year for zip code 44221, filed in 2021:
Average Adjusted Gross Income (AGI) in 2020: $46,883 (Individual Income Tax Returns)
Here:
$46,883
State:
$67,288
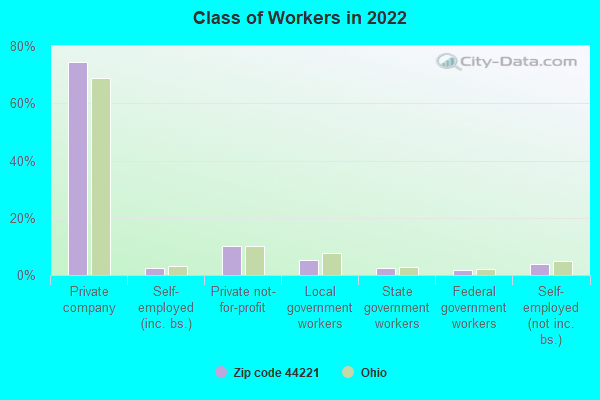
Salary/wage: $43,916 (reported on 84.9% of returns)
Here:
$43,916
State:
$55,628
(% of AGI for various income ranges: 1169.3% for AGIs below $25k, 3721.8% for AGIs $25k-50k, 6483.9% for AGIs $50k-75k, 9570.5% for AGIs $75k-100k, 15178.4% for AGIs $100k-200k, 53880.0% for AGIs over 200k)
Taxable interest for individuals: $727 (reported on 19.9% of returns)
This zip code:
$727
Ohio:
$1,518
(% of AGI for various income ranges: 9.6% for AGIs below $25k, 10.1% for AGIs $25k-50k, 24.8% for AGIs $50k-75k, 34.9% for AGIs $75k-100k, 62.9% for AGIs $100k-200k, 190.0% for AGIs over 200k)
Ordinary dividends: $2,117 (reported on 12.8% of returns)
Here:
$2,117
State:
$7,167
(% of AGI for various income ranges: 15.9% for AGIs below $25k, 16.2% for AGIs $25k-50k, 42.4% for AGIs $50k-75k, 71.5% for AGIs $75k-100k, 132.0% for AGIs $100k-200k, 683.3% for AGIs over 200k)
Net capital gain/loss in AGI: +$4,135 (reported on 11.1% of returns)
Here:
+$4,135
State:
+$18,919
(% of AGI for various income ranges: 5.5% for AGIs below $25k, 17.5% for AGIs $25k-50k, 54.5% for AGIs $50k-75k, 90.6% for AGIs $75k-100k, 265.1% for AGIs $100k-200k, 6606.7% for AGIs over 200k)
Profit/loss from business: +$8,727 (reported on 11.2% of returns)
Here:
+$8,727
State:
+$13,744
(% of AGI for various income ranges: 70.3% for AGIs below $25k, 89.9% for AGIs $25k-50k, 115.8% for AGIs $50k-75k, 182.7% for AGIs $75k-100k, 559.8% for AGIs $100k-200k)
Taxable individual retirement arrangement distribution: $12,862 (reported on 7.4% of returns)
44221:
$12,862
Ohio:
$18,876
(% of AGI for various income ranges: 55.6% for AGIs below $25k, 71.9% for AGIs $25k-50k, 127.8% for AGIs $50k-75k, 238.3% for AGIs $75k-100k, 572.5% for AGIs $100k-200k)
Total itemized deductions: $24,278 (reported on 2.3% of returns)
Here:
$24,278
State:
$33,869
(% of AGI for various income ranges: 21.1% for AGIs below $25k, 24.1% for AGIs $25k-50k, 89.3% for AGIs $50k-75k, 195.7% for AGIs $75k-100k, 367.4% for AGIs $100k-200k)
Charity contributions: $6,615 (reported on 1.7% of returns)
Here:
$6,615
State:
$14,577
(% of AGI for various income ranges: 4.7% for AGIs $25k-50k, 15.8% for AGIs $50k-75k, 34.0% for AGIs $75k-100k, 105.9% for AGIs $100k-200k)
Taxes paid: $6,197 (reported on 2.3% of returns)
44221:
$6,197
State:
$7,681
(% of AGI for various income ranges: 1.6% for AGIs below $25k, 4.1% for AGIs $25k-50k, 23.1% for AGIs $50k-75k, 57.9% for AGIs $75k-100k, 110.6% for AGIs $100k-200k)
Earned income credit: $1,911 (reported on 13.4% of returns)
Here:
$1,911
State:
$2,304
(% of AGI for various income ranges: 58.9% for AGIs below $25k, 44.3% for AGIs $25k-50k, 0.9% for AGIs $50k-75k)
Percentage of individuals using paid preparers for their 2020 taxes: 94.6%
Here:
95%
State:
94%
(% for various income ranges: 93.6% for AGIs below $25k, 95.6% for AGIs $25k-50k, 94.5% for AGIs $50k-75k, 94.6% for AGIs $75k-100k, 95.0% for AGIs $100k-200k, 88.9% for AGIs over 200k)
Averages for the 2012 tax year for zip code 44221, filed in 2013:
Average Adjusted Gross Income (AGI) in 2012: $40,135 (Individual Income Tax Returns)
Here:
$40,135
State:
$54,926
Salary/wage: $37,605 (reported on 86.3% of returns)
Here:
$37,605
State:
$45,869
(% of AGI for various income ranges: 75.5% for AGIs below $25k, 83.1% for AGIs $25k-50k, 83.6% for AGIs $50k-75k, 84.1% for AGIs $75k-100k, 80.7% for AGIs $100k-200k, 41.9% for AGIs over 200k)
Taxable interest for individuals: $642 (reported on 26.4% of returns)
This zip code:
$642
Ohio:
$1,297
(% of AGI for various income ranges: 0.8% for AGIs below $25k, 0.4% for AGIs $25k-50k, 0.4% for AGIs $50k-75k, 0.4% for AGIs $75k-100k, 0.3% for AGIs $100k-200k, 0.2% for AGIs over 200k)
Ordinary dividends: $1,983 (reported on 14.1% of returns)
Here:
$1,983
State:
$5,821
(% of AGI for various income ranges: 1.2% for AGIs below $25k, 0.6% for AGIs $25k-50k, 0.6% for AGIs $50k-75k, 0.4% for AGIs $75k-100k, 0.8% for AGIs $100k-200k, 1.5% for AGIs over 200k)
Net capital gain/loss in AGI: +$1,777 (reported on 9.1% of returns)
Here:
+$1,777
State:
+$11,232
(% of AGI for various income ranges: 0.2% for AGIs $50k-75k, 0.2% for AGIs $75k-100k, 1.0% for AGIs $100k-200k, 6.1% for AGIs over 200k)
Profit/loss from business: +$8,830 (reported on 10.8% of returns)
Here:
+$8,830
State:
+$12,773
(% of AGI for various income ranges: 5.5% for AGIs below $25k, 1.6% for AGIs $25k-50k, 1.1% for AGIs $50k-75k, 1.5% for AGIs $75k-100k, 5.3% for AGIs $100k-200k)
Taxable individual retirement arrangement distribution: $10,030 (reported on 8.9% of returns)
44221:
$10,030
Ohio:
$14,511
(% of AGI for various income ranges: 2.9% for AGIs below $25k, 1.7% for AGIs $25k-50k, 2.1% for AGIs $50k-75k, 2.5% for AGIs $75k-100k, 3.0% for AGIs $100k-200k)
Total itemized deductions: $14,139 (21% of AGI, reported on 24.2% of returns)
Here:
$14,139
State:
$21,278
Here:
21.0% of AGI
State:
18.8% of AGI
(% of AGI for various income ranges: 4.9% for AGIs below $25k, 6.9% for AGIs $25k-50k, 8.9% for AGIs $50k-75k, 10.7% for AGIs $75k-100k, 11.5% for AGIs $100k-200k, 10.7% for AGIs over 200k)
Charity contributions: $2,275 (reported on 17.2% of returns)
Here:
$2,275
State:
$3,943
(% of AGI for various income ranges: 0.4% for AGIs below $25k, 0.7% for AGIs $25k-50k, 1.0% for AGIs $50k-75k, 1.3% for AGIs $75k-100k, 1.6% for AGIs $100k-200k, 1.4% for AGIs over 200k)
Taxes paid: $5,551 (reported on 24.2% of returns)
44221:
$5,551
State:
$9,568
(% of AGI for various income ranges: 1.1% for AGIs below $25k, 2.4% for AGIs $25k-50k, 3.3% for AGIs $50k-75k, 4.4% for AGIs $75k-100k, 5.7% for AGIs $100k-200k, 5.8% for AGIs over 200k)
Earned income credit: $1,857 (reported on 15.8% of returns)
Here:
$1,857
State:
$2,285
(% of AGI for various income ranges: 4.2% for AGIs below $25k, 0.7% for AGIs $25k-50k)
Percentage of individuals using paid preparers for their 2012 taxes: 42.7%
Here:
43%
State:
51%
(% for various income ranges: 39.2% for AGIs below $25k, 43.9% for AGIs $25k-50k, 45.7% for AGIs $50k-75k, 45.1% for AGIs $75k-100k, 47.8% for AGIs $100k-200k, 80.0% for AGIs over 200k)
Averages for the 2004 tax year for zip code 44221, filed in 2005:
Average Adjusted Gross Income (AGI) in 2004: $34,453 (Individual Income Tax Returns)
Here:
$34,453
State:
$44,480
Salary/wage: $33,071 (reported on 86.9% of returns)
Here:
$33,071
State:
$39,198
(% of AGI for various income ranges: 81.6% for AGIs below $10k, 76.2% for AGIs $10k-25k, 84.7% for AGIs $25k-50k, 87.5% for AGIs $50k-75k, 86.7% for AGIs $75k-100k, 71.7% for AGIs over 100k)
Taxable interest for individuals: $1,055 (reported on 38.2% of returns)
This zip code:
$1,055
Ohio:
$1,532
(% of AGI for various income ranges: 3.5% for AGIs below $10k, 2.2% for AGIs $10k-25k, 0.9% for AGIs $25k-50k, 0.8% for AGIs $50k-75k, 0.9% for AGIs $75k-100k, 1.9% for AGIs over 100k)
Taxable dividends: $1,377 (reported on 18.7% of returns)
Here:
$1,377
State:
$3,496
(% of AGI for various income ranges: 2.1% for AGIs below $10k, 1.3% for AGIs $10k-25k, 0.6% for AGIs $25k-50k, 0.6% for AGIs $50k-75k, 0.4% for AGIs $75k-100k, 1.2% for AGIs over 100k)
Net capital gain/loss: +$1,688 (reported on 12.4% of returns)
Here:
+$1,688
State:
+$8,582
(% of AGI for various income ranges: -1.3% for AGIs below $10k, 0.1% for AGIs $10k-25k, 0.2% for AGIs $25k-50k, 0.3% for AGIs $50k-75k, 0.8% for AGIs $75k-100k, 4.1% for AGIs over 100k)
Profit/loss from business: +$5,829 (reported on 10.4% of returns)
Here:
+$5,829
State:
+$10,813
(% of AGI for various income ranges: 5.3% for AGIs below $10k, 2.8% for AGIs $10k-25k, 1.7% for AGIs $25k-50k, 1.1% for AGIs $50k-75k, 2.0% for AGIs $75k-100k, 1.0% for AGIs over 100k)
IRA payment deduction: $2,439 (reported on 1.9% of returns)
44221:
$2,439
Ohio:
$2,794
(% of AGI for various income ranges: 0.2% for AGIs $10k-25k, 0.2% for AGIs $25k-50k, 0.1% for AGIs $50k-75k, 0.1% for AGIs $75k-100k, 0.1% for AGIs over 100k)
Self-employed pension: $5,500 (reported on 0.1% of returns)
Here:
$5,500
Ohio:
$13,981
Total itemized deductions: $12,398 (22% of AGI, reported on 30.4% of returns)
Here:
$12,398
State:
$17,503
Here:
22.4% of AGI
State:
20.8% of AGI
(% of AGI for various income ranges: 5.6% for AGIs below $10k, 6.6% for AGIs $10k-25k, 10.0% for AGIs $25k-50k, 12.8% for AGIs $50k-75k, 13.9% for AGIs $75k-100k, 12.4% for AGIs over 100k)
Charity contributions deductions: $1,758 (3% of AGI, reported on 24.6% of returns)
Here:
$1,758
State:
$3,087
Here:
3.1% of AGI
State:
3.4% of AGI
(% of AGI for various income ranges: 0.5% for AGIs below $10k, 0.8% for AGIs $10k-25k, 1.0% for AGIs $25k-50k, 1.4% for AGIs $50k-75k, 1.7% for AGIs $75k-100k, 2.0% for AGIs over 100k)
Total tax: $3,725 (reported on 79.5% of returns)
44221:
$3,725
State:
$6,781
(% of AGI for various income ranges: 2.0% for AGIs below $10k, 4.5% for AGIs $10k-25k, 7.6% for AGIs $25k-50k, 9.0% for AGIs $50k-75k, 10.8% for AGIs $75k-100k, 15.8% for AGIs over 100k)
Earned income credit: $1,389 (reported on 11.4% of returns)
Here:
$1,389
State:
$1,696
Percentage of individuals using paid preparers for their 2004 taxes: 45.4%
Here:
45%
State:
55%
(% for various income ranges: 37.0% for AGIs below $10k, 45.3% for AGIs $10k-25k, 49.0% for AGIs $25k-50k, 46.2% for AGIs $50k-75k, 43.3% for AGIs $75k-100k, 58.8% for AGIs over 100k)
Likely homosexual households (counted as self-reported same-sex unmarried-partner households)
Lesbian couples: 0.0% of all households
Gay men: 0.2% of all households
Household received Food Stamps/SNAP in the past 12 months: 1,746 Household did not receive Food Stamps/SNAP in the past 12 months: 12,122
Women who had a birth in the past 12 months: 458 (343 now married, 118 unmarried) Women who did not have a birth in the past 12 months: 7,499 (3,123 now married, 4,374 unmarried)
Housing units in zip code 44221 with a mortgage: 5,572 (543 second mortgage, 27 home equity loan, 351 both second mortgage and home equity loan) Houses without a mortgage: 264
Median monthly owner costs for units with a mortgage: $1,115 Median monthly owner costs for units without a mortgage: $469
Residents with income below the poverty level in 2022:
This zip code:
10.4%
Whole state:
13.4%
Residents with income below 50% of the poverty level in 2022:
This zip code:
7.2%
Whole state:
7.0%
Median number of rooms in houses and condos:
Here:
6.3
State:
6.7
Median number of rooms in apartments:
Here:
4.0
State:
4.4
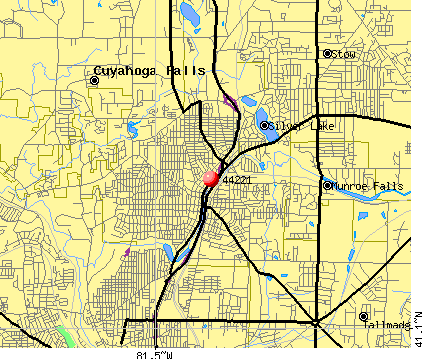
Notable locations in this zip code not listed on our city pages
Notable locations in zip code 44221: Breathnach Country Club (A), Brookledge Golf Course (B), Cuyahoga Falls Fire Department Station 1 (C), Cuyahoga Falls City Hall (D), Cuyahoga Falls Fire Department Station 2 (E), Taylor Memorial Public Library (F). Display/hide their locations on the map
Shopping Centers: Graham Square Plaza Shopping Center (1), The Plaza at Chapel Hills Shopping Center (2), Chapel Hill Square Shopping Center (3). Display/hide their locations on the map
Churches in zip code 44221 include: First Christian Church (A), First Church of Christ Scientist (B), First United Methodist Church of Cuyahoga Falls (C), Saint Johns Episcopal Church (D), United Presbyterian Church of Cuyahoga Falls (E), Pilgrim United Church of Christ (F), Redeemer Lutheran Church (G), Saint Joseph Catholic Church (H). Display/hide their locations on the map
Parks in zip code 44221 include: Harrington Field (1), Lions Park (2), Linden Park (3), Ross Park (4), Indian Mount Park (5), Waterworks Park (6), Preston Park (7), Trails End Park (8), Kennedy Park (9). Display/hide their locations on the map
3,461 married couples with children.
1,492 single-parent households (512 men, 980 women).
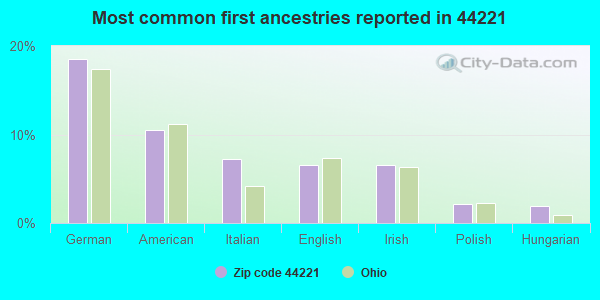
89.5% of residents of 44221 zip code speak English at home.
1.1% of residents speak Spanish at home (83% very well, 13% well, 5% not well).
6.5% of residents speak other Indo-European language at home (36% very well, 33% well, 18% not well, 13% not at all).
1.6% of residents speak Asian or Pacific Island language at home (40% very well, 35% well, 23% not well, 1% not at all).
1.1% of residents speak other language at home (71% very well, 21% well, 4% not well, 4% not at all).
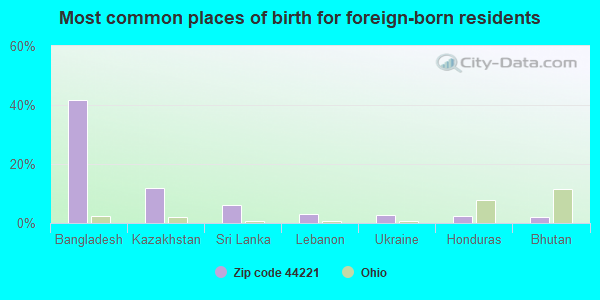
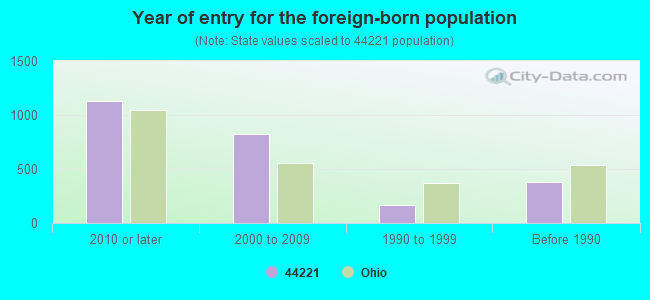
Foreign born population: 2,207 (7.4%) (72.7% of them are naturalized citizens)
Facilities with environmental interests located in this zip code:
BOLICH JUNIOR HIGH SCHOOL (2630 13TH ST in CUYAHOGA FALLS, OH)
(Geographic Names Information System) (National Center for Education Statistics) - STATE ID-003103 STATE MASTER (Ohio general info) - AIR MAJOR Organizations: CUYAHOGA FALLS CITY SD (SCHOOL DISTRICT)
Alternative names: BOLICH MIDDLE SCHOOL
AMERICHEM INC BROADWAY (225 BROADWAY E. in CUYAHOGA FALLS, OH)
COMPLIANCE ACTIVITY (Tracking inspections of insecticide, fungicide, and rodenticide, and toxic substances) CRITERIA AND HAZARDOUS AIR POLLUTANT INVENTORY (Inventory of air pollution sources) STATE MASTER (Ohio general info) - AIR MAJOR, -77-3089-996-3, EPCRA, TRIS-44221MRCHM225BR, TRI REPORTER TSD (Resource Conservation and Recovery Act (tracking hazardous waste)) TRI REPORTER (Tracking of toxic chemicals releasing facilities) Business SIC classification: CUSTOM COMPOUNDING OF PURCHASED PLASTICS RESINS Business NAICS classification: CUSTOM COMPOUNDING OF PURCHASED RESINS.
AMERICHEM INC (2038 MAIN ST. in CUYAHOGA FALLS, OH)
STATE MASTER (Ohio general info) - RCRA-OHD004467387, HAZARDOUS WASTE PROGRAM Small Quantity Generators, between 100 kg and 1000 kg of hazardous waste/month (Resource Conservation and Recovery Act (tracking hazardous waste)) - notification TRI REPORTER (Tracking of toxic chemicals releasing facilities)
BP OIL CO NO 05689 (1205 MAIN ST in CUYAHOGA FALLS, OH)
STATE MASTER (Ohio general info) - AIR MAJOR, -77-5541-168-22, EPCRA Small Quantity Generators, between 100 kg and 1000 kg of hazardous waste/month (Resource Conservation and Recovery Act (tracking hazardous waste)) - notification Business SIC classification: GASOLINE SERVICE STATIONS Organizations: SOHIO OIL CO (CONTACT/OWNER)
, BP PRODUCTS NORTH AMERICA INC. (CONTACT/OWNER)
Alternative names: BP OIL CO 05689
CENTRAL WELDING AND SUPPLY CO (230 E PORTAGE TRAIL in CUYAHOGA FALLS, OH)
STATE MASTER (Ohio general info) - RCRA-OHD017937905, HAZARDOUS WASTE PROGRAM Small Quantity Generators, between 100 kg and 1000 kg of hazardous waste/month (Resource Conservation and Recovery Act (tracking hazardous waste)) - notification
AEROSPACE INDUSTRIES INC (2101 FRONT ST in CUYAHOGA FALLS, OH)
STATE MASTER (Ohio general info) - RCRA-OHD987007481, HAZARDOUS WASTE PROGRAM Small Quantity Generators, between 100 kg and 1000 kg of hazardous waste/month (Resource Conservation and Recovery Act (tracking hazardous waste)) - notification Organizations: LINEK STEPHAN J (CONTACT/OWNER)
AKROMOLD INC (1100 MAIN ST in CUYAHOGA FALLS, OH)
STATE MASTER (Ohio general info) - RCRA-OHD004192530, HAZARDOUS WASTE PROGRAM Small Quantity Generators, between 100 kg and 1000 kg of hazardous waste/month (Resource Conservation and Recovery Act (tracking hazardous waste)) - notification Organizations: MONTEITH WILLIAM H JR (CONTACT/OWNER)
BAILEY ROAD CLEANERS (1907 E BAILEY RD in CUYAHOGA FALLS, OH)
STATE MASTER (Ohio general info) - AIR MAJOR Conditionally Exempt Small Quantity Generators, less than 100 kg/month of hazardous waste (Resource Conservation and Recovery Act (tracking hazardous waste)) Organizations: YEE DENNY (CONTACT/OWNER)
BP OIL CO SITE 05681 (1948 SECOND ST in CUYAHOGA FALLS, OH)
STATE MASTER (Ohio general info) - RCRA-OHD987025202, HAZARDOUS WASTE PROGRAM, AIR MAJOR, -77-5541-905-2, EPCRA Conditionally Exempt Small Quantity Generators, less than 100 kg/month of hazardous waste (Resource Conservation and Recovery Act (tracking hazardous waste)) - notification Organizations: BP OIL COMPANY (CONTACT/OWNER)
CHARLES NETTLE RESIDENCE (2364 SECOND ST in CUYAHOGA FALLS, OH)
STATE MASTER (Ohio general info) - RCRA-OHR000028043, HAZARDOUS WASTE PROGRAM Small Quantity Generators, between 100 kg and 1000 kg of hazardous waste/month (Resource Conservation and Recovery Act (tracking hazardous waste)) - notification
BP OIL & EXPLORATION INCORPORATED (1241 MAIN STREET in CUYAHOGA FALLS, OH)
Large Quantity Generators, more that 1000 kg of hazardous waste/month (Resource Conservation and Recovery Act (tracking hazardous waste)) - notification
AAMCO TRANSMISSIONS (1745 FRONT ST in CUYAHOGA FALLS, OH)
Small Quantity Generators, between 100 kg and 1000 kg of hazardous waste/month (Resource Conservation and Recovery Act (tracking hazardous waste)) - notification Organizations: KEN LOU INC (CONTACT/OWNER)
APARTMENTS ON SECOND STREET (2550 2ND STREET in CUYAHOGA FALLS, OH)
ENFORCEMENT/COMPLIANCE ACTIVITY (Integrated Compliance Information System) COMPLIANCE ACTIVITY (Tracking inspections of insecticide, fungicide, and rodenticide, and toxic substances)
Housing units lacking complete plumbing facilities: 0.1% Housing units lacking complete kitchen facilities: 0.8%
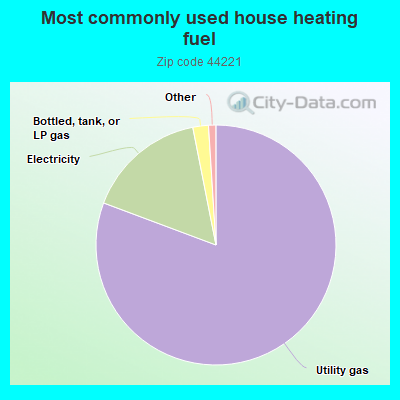
80.7%Utility gas
16.2%Electricity
2.1%Bottled, tank, or LP gas
Population in 1990: 32,009.
Place of birth for U.S.-born residents:
This state: 22,055
Northeast: 1,718
Midwest: 1,215
South: 1,365
West: 863
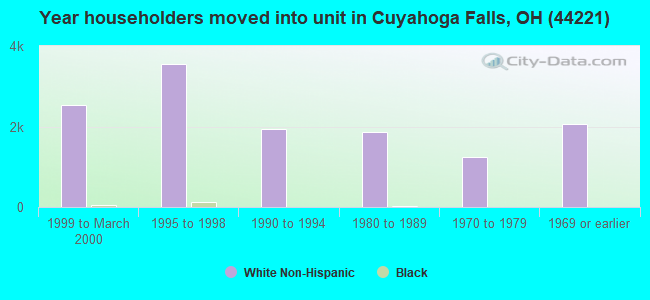
59% of the 44221 zip code residents lived in the same house 5 years ago. Out of people who lived in different houses, 68% lived in this county. Out of people who lived in different counties, 50% lived in Ohio.
86% of the 44221 zip code residents lived in the same house 1 year ago. Out of people who lived in different houses, 49% moved from this county. Out of people who lived in different houses, 33% moved from different county within same state. Out of people who lived in different houses, 13% moved from different state. Out of people who lived in different houses, 3% moved from abroad.
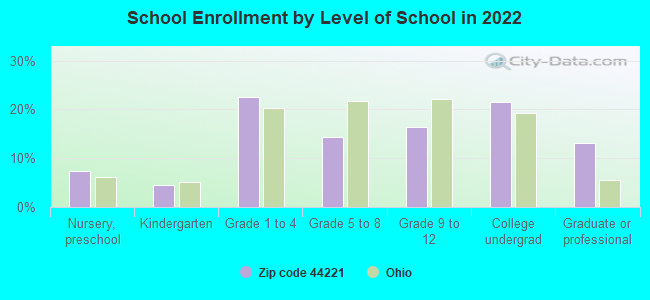
Private vs. public school enrollment:
Students in private schools in grades 1 to 8 (elementary and middle school): 338
Here:
16.0%
Ohio:
16.0%
Students in private schools in grades 9 to 12 (high school): 85
Here:
9.0%
Ohio:
13.1%
Students in private undergraduate colleges: 173
Here:
14.0%
Ohio:
22.3%
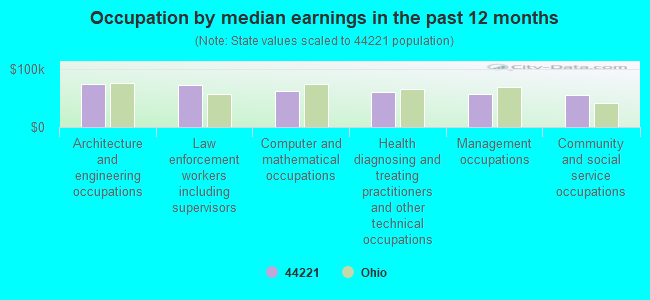
Occupation by median earnings in the past 12 months ($)
74,145Architecture and engineering occupations
72,759Law enforcement workers including supervisors
61,703Computer and mathematical occupations
60,152Health diagnosing and treating practitioners and other technical occupations
57,020Management occupations
55,690Community and social service occupations
Companies with federal contracts located in this zip code (CUYAHOGA FALLS, OH):
CIRCLE PRIME MANUFACTURING INC (2114 FRONT ST; small business) : $3,457,736 in 70 contractsfrom 1999 to 2006
Contracts for Amplifiers, Miscellaneous Electrical and Electronic Components, Electrical and Electronic assemblies, Boards, Cards, and Associated Hardware, Oscillators and Piezoelectric Crystals, and moreby Defense Logistics Agency, Navy Signed by year:2000: $416,744; 2001: $897,677; 2002: $150,248; 2003: $560,366; 2004: $688,147; 2005: $453,271; 2006: $256,783.
Biggest contracts:
$358,944 with Defense Logistics Agency for Amplifiers. Signed on 2000-06-30. Completion date: 2001-01-26.
$249,204, same as above.Signed on 2003-10-23. Completion date: 2004-06-19.
$195,890, same as above.Signed on 2004-03-01. Completion date: 2004-09-27.
$121,600 with Defense Logistics Agency for Miscellaneous Electrical and Electronic Components. Signed on 2001-09-14. Completion date: 2002-07-23.
REUTHER MOLD & MFG CO INC (1225 MUNROE FALLS AVE; small business) : $138,450 in 2 contractsin 2005
$120,950 with Army for Miscellaneous Maintenance and Repair Shop Specialized Equipment. Signed on 2005-12-07. Completion date: 2006-03-22.
$17,500 with Army for Maintenance, Repair and Rebuilding of Equipment -- Special Industry Machinery. Signed on 2005-08-10. Completion date: 2005-09-02.
VITAL IMAGE TECHNOLOGYNC. (450 PORTAGE TRAIL; small business)
$68,715 with Army for Cameras, Still Picture. Signed on 2000-08-07. Completion date: 2000-09-15.
RIVERSIDE COMMUNITY URBAN REDE (1989 FRONT ST)
$9,606 with Army for Lodging - Hotel/Motel. Signed on 2003-01-28. Completion date: 2003-01-24.
ADVANCED EQUIPMENT INC (2104 FRONT ST; small business)
$3,462 with Army for Kitchen Equipment and Appliances. Signed on 2005-08-05. Completion date: 2005-08-04.
POLYMERICS INC (2828 2ND ST)
$2,635 with Navy for Preservative and Sealing Compounds. Signed on 2005-04-20. Completion date: 2005-06-13.
Top industries in this zip code by the number of employees in 2005:
2002 - 2018 National Fire Incident Reporting System (NFIRS) incidents
Based on the data from the years 2002 - 2018 the average number of fires per year is 101. The highest number of fire incidents - 144 took place in 2006, and the least - 66 in 2018. The data has a declining trend.
When looking into fire subcategories, the most reports belonged to: Structure Fires (56.2%), and Outside Fires (28.5%).
Fire incident types reported to NFIRS in Zip Code 44221
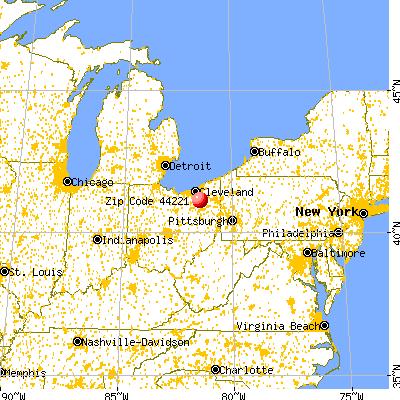


 Nearest zip codes: 44262, 44310, 44224, 44278, 44223, 44304.
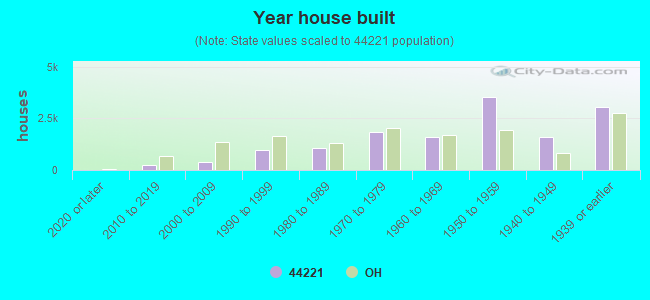


 Based on the data from the years 2002 - 2018 the average number of fires per year is 101. The highest number of fire incidents - 144 took place in 2006, and the least - 66 in 2018. The data has a declining trend.
 When looking into fire subcategories, the most reports belonged to: Structure Fires (56.2%), and Outside Fires (28.5%).