Estimated zip code population in 2022: 24,852 Zip code population in 2010: 22,786 Zip code population in 2000: 23,833
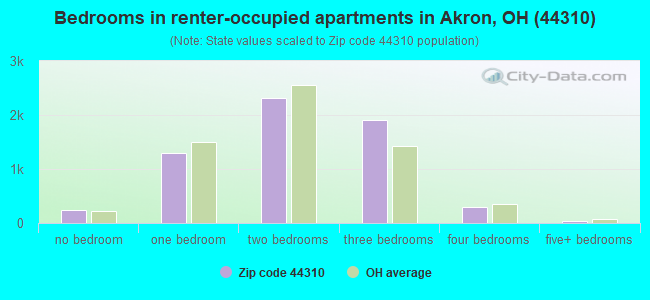
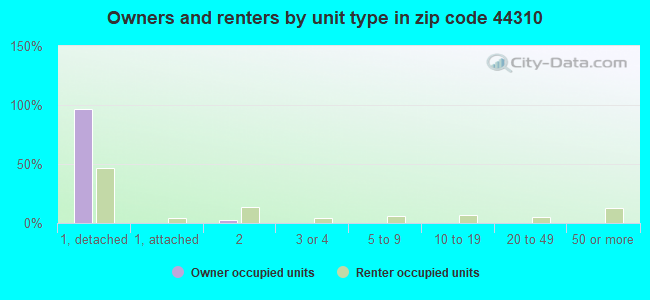
Houses and condos: 11,220 Renter-occupied apartments: 6,128
% of renters here:
60%
State:
33%
March 2022 cost of living index in zip code 44310: 95.5 (near average, U.S. average is 100)
Land area: 6.0 sq. mi. Water area: 0.0 sq. mi.
Population density: 4,136 people per square mile
(average).
OSM Map
General Map
Google Map
MSN Map
OSM Map
General Map
Google Map
MSN Map
OSM Map
General Map
Google Map
MSN Map
OSM Map
General Map
Google Map
MSN Map
Please wait while loading the map...
Real estate property taxes paid for housing units in 2022:
This zip code:
1.7% ($1,662)
Ohio:
1.3% ($2,639)
Median real estate property taxes paid for housing units with mortgages in 2022: $1,734 (1.6%) Median real estate property taxes paid for housing units with no mortgage in 2022: $1,568 (1.8%)
Averages for the 2020 tax year for zip code 44310, filed in 2021:
Average Adjusted Gross Income (AGI) in 2020: $32,675 (Individual Income Tax Returns)
Here:
$32,675
State:
$67,288
Salary/wage: $30,353 (reported on 87.6% of returns)
Here:
$30,353
State:
$55,628
(% of AGI for various income ranges: 1288.3% for AGIs below $25k, 3649.2% for AGIs $25k-50k, 6519.2% for AGIs $50k-75k, 10467.5% for AGIs $75k-100k, 17812.1% for AGIs $100k-200k)
Taxable interest for individuals: $707 (reported on 9.3% of returns)
This zip code:
$707
Ohio:
$1,518
(% of AGI for various income ranges: 3.0% for AGIs below $25k, 4.6% for AGIs $25k-50k, 25.2% for AGIs $50k-75k, 47.1% for AGIs $75k-100k, 58.6% for AGIs $100k-200k)
Ordinary dividends: $2,091 (reported on 4.9% of returns)
Here:
$2,091
State:
$7,167
(% of AGI for various income ranges: 3.3% for AGIs below $25k, 8.2% for AGIs $25k-50k, 29.4% for AGIs $50k-75k, 80.0% for AGIs $75k-100k, 157.1% for AGIs $100k-200k)
Net capital gain/loss in AGI: +$2,384 (reported on 4.5% of returns)
Here:
+$2,384
State:
+$18,919
(% of AGI for various income ranges: 3.0% for AGIs below $25k, 3.6% for AGIs $25k-50k, 27.7% for AGIs $50k-75k, 99.6% for AGIs $75k-100k, 281.4% for AGIs $100k-200k)
Profit/loss from business: +$7,086 (reported on 11.9% of returns)
Here:
+$7,086
State:
+$13,744
(% of AGI for various income ranges: 84.9% for AGIs below $25k, 92.2% for AGIs $25k-50k, 140.9% for AGIs $50k-75k, 245.7% for AGIs $75k-100k, 524.3% for AGIs $100k-200k)
Taxable individual retirement arrangement distribution: $9,448 (reported on 3.6% of returns)
44310:
$9,448
Ohio:
$18,876
(% of AGI for various income ranges: 21.9% for AGIs below $25k, 27.3% for AGIs $25k-50k, 89.7% for AGIs $50k-75k, 409.3% for AGIs $75k-100k)
Total itemized deductions: $24,536 (reported on 1.0% of returns)
Here:
$24,536
State:
$33,869
(% of AGI for various income ranges: 25.6% for AGIs $25k-50k, 74.7% for AGIs $50k-75k, 400.7% for AGIs $75k-100k)
Charity contributions: $5,962 (reported on 0.7% of returns)
Here:
$5,962
State:
$14,577
(% of AGI for various income ranges: 7.5% for AGIs $25k-50k, 75.0% for AGIs $75k-100k)
Taxes paid: $4,836 (reported on 1.0% of returns)
44310:
$4,836
State:
$7,681
(% of AGI for various income ranges: 3.9% for AGIs $25k-50k, 12.8% for AGIs $50k-75k, 99.3% for AGIs $75k-100k)
Earned income credit: $2,613 (reported on 33.2% of returns)
Here:
$2,613
State:
$2,304
(% of AGI for various income ranges: 134.3% for AGIs below $25k, 119.9% for AGIs $25k-50k, 3.2% for AGIs $50k-75k)
Percentage of individuals using paid preparers for their 2020 taxes: 95.3%
Here:
95%
State:
94%
(% for various income ranges: 94.4% for AGIs below $25k, 96.3% for AGIs $25k-50k, 95.8% for AGIs $50k-75k, 93.0% for AGIs $75k-100k, 96.0% for AGIs $100k-200k)
Averages for the 2012 tax year for zip code 44310, filed in 2013:
Average Adjusted Gross Income (AGI) in 2012: $28,429 (Individual Income Tax Returns)
Here:
$28,429
State:
$54,926
Salary/wage: $26,675 (reported on 88.5% of returns)
Here:
$26,675
State:
$45,869
(% of AGI for various income ranges: 81.3% for AGIs below $25k, 86.6% for AGIs $25k-50k, 84.0% for AGIs $50k-75k, 86.5% for AGIs $75k-100k, 64.4% for AGIs $100k-200k)
Taxable interest for individuals: $613 (reported on 14.0% of returns)
This zip code:
$613
Ohio:
$1,297
(% of AGI for various income ranges: 0.3% for AGIs below $25k, 0.2% for AGIs $25k-50k, 0.4% for AGIs $50k-75k, 0.3% for AGIs $75k-100k, 0.3% for AGIs $100k-200k)
Ordinary dividends: $2,255 (reported on 6.2% of returns)
Here:
$2,255
State:
$5,821
(% of AGI for various income ranges: 0.3% for AGIs below $25k, 0.4% for AGIs $25k-50k, 0.5% for AGIs $50k-75k, 0.4% for AGIs $75k-100k, 1.7% for AGIs $100k-200k)
Net capital gain/loss in AGI: +$1,756 (reported on 3.0% of returns)
Here:
+$1,756
State:
+$11,232
(% of AGI for various income ranges: 0.2% for AGIs $50k-75k, 2.2% for AGIs $100k-200k)
Profit/loss from business: +$7,055 (reported on 10.9% of returns)
Here:
+$7,055
State:
+$12,773
(% of AGI for various income ranges: 7.3% for AGIs below $25k, 1.2% for AGIs $25k-50k, 1.3% for AGIs $50k-75k, 0.9% for AGIs $75k-100k, 0.8% for AGIs $100k-200k)
Taxable individual retirement arrangement distribution: $8,453 (reported on 4.3% of returns)
44310:
$8,453
Ohio:
$14,511
(% of AGI for various income ranges: 1.2% for AGIs below $25k, 1.1% for AGIs $25k-50k, 1.6% for AGIs $50k-75k, 2.2% for AGIs $75k-100k)
Total itemized deductions: $13,334 (24% of AGI, reported on 13.0% of returns)
Here:
$13,334
State:
$21,278
Here:
24.5% of AGI
State:
18.8% of AGI
(% of AGI for various income ranges: 2.9% for AGIs below $25k, 6.0% for AGIs $25k-50k, 7.6% for AGIs $50k-75k, 8.8% for AGIs $75k-100k, 9.7% for AGIs $100k-200k)
Charity contributions: $2,400 (reported on 8.7% of returns)
Here:
$2,400
State:
$3,943
(% of AGI for various income ranges: 0.3% for AGIs below $25k, 0.6% for AGIs $25k-50k, 1.0% for AGIs $50k-75k, 1.3% for AGIs $75k-100k, 1.4% for AGIs $100k-200k)
Taxes paid: $4,349 (reported on 12.7% of returns)
44310:
$4,349
State:
$9,568
(% of AGI for various income ranges: 0.5% for AGIs below $25k, 1.6% for AGIs $25k-50k, 2.7% for AGIs $50k-75k, 3.4% for AGIs $75k-100k, 4.7% for AGIs $100k-200k)
Earned income credit: $2,476 (reported on 32.5% of returns)
Here:
$2,476
State:
$2,285
(% of AGI for various income ranges: 9.1% for AGIs below $25k, 1.3% for AGIs $25k-50k)
Percentage of individuals using paid preparers for their 2012 taxes: 47.6%
Here:
48%
State:
51%
(% for various income ranges: 48.1% for AGIs below $25k, 45.7% for AGIs $25k-50k, 46.9% for AGIs $50k-75k, 48.6% for AGIs $75k-100k, 66.7% for AGIs $100k-200k)
Averages for the 2004 tax year for zip code 44310, filed in 2005:
Average Adjusted Gross Income (AGI) in 2004: $27,679 (Individual Income Tax Returns)
Here:
$27,679
State:
$44,480
Salary/wage: $26,312 (reported on 89.7% of returns)
Here:
$26,312
State:
$39,198
(% of AGI for various income ranges: 86.9% for AGIs below $10k, 82.4% for AGIs $10k-25k, 88.7% for AGIs $25k-50k, 88.4% for AGIs $50k-75k, 86.9% for AGIs $75k-100k, 51.1% for AGIs over 100k)
Taxable interest for individuals: $974 (reported on 25.2% of returns)
This zip code:
$974
Ohio:
$1,532
(% of AGI for various income ranges: 1.9% for AGIs below $10k, 1.3% for AGIs $10k-25k, 0.7% for AGIs $25k-50k, 0.6% for AGIs $50k-75k, 0.8% for AGIs $75k-100k, 1.6% for AGIs over 100k)
Taxable dividends: $1,127 (reported on 10.4% of returns)
Here:
$1,127
State:
$3,496
(% of AGI for various income ranges: 1.0% for AGIs below $10k, 0.6% for AGIs $10k-25k, 0.3% for AGIs $25k-50k, 0.4% for AGIs $50k-75k, 0.3% for AGIs $75k-100k, 0.8% for AGIs over 100k)
Net capital gain/loss: +$2,344 (reported on 6.5% of returns)
Here:
+$2,344
State:
+$8,582
(% of AGI for various income ranges: -0.4% for AGIs below $10k, -0.0% for AGIs $10k-25k, 0.1% for AGIs $25k-50k, 0.4% for AGIs $50k-75k, 0.7% for AGIs $75k-100k, 7.2% for AGIs over 100k)
Profit/loss from business: +$5,612 (reported on 9.4% of returns)
Here:
+$5,612
State:
+$10,813
(% of AGI for various income ranges: 5.3% for AGIs below $10k, 3.6% for AGIs $10k-25k, 1.4% for AGIs $25k-50k, 1.4% for AGIs $50k-75k, 1.0% for AGIs $75k-100k, 0.4% for AGIs over 100k)
IRA payment deduction: $2,034 (reported on 1.4% of returns)
44310:
$2,034
Ohio:
$2,794
Total itemized deductions: $10,916 (23% of AGI, reported on 21.6% of returns)
Here:
$10,916
State:
$17,503
Here:
22.7% of AGI
State:
20.8% of AGI
(% of AGI for various income ranges: 4.0% for AGIs below $10k, 4.6% for AGIs $10k-25k, 8.6% for AGIs $25k-50k, 10.9% for AGIs $50k-75k, 13.0% for AGIs $75k-100k, 9.1% for AGIs over 100k)
Charity contributions deductions: $1,838 (4% of AGI, reported on 16.1% of returns)
Here:
$1,838
State:
$3,087
Here:
3.5% of AGI
State:
3.4% of AGI
(% of AGI for various income ranges: 0.3% for AGIs below $10k, 0.6% for AGIs $10k-25k, 1.0% for AGIs $25k-50k, 1.3% for AGIs $50k-75k, 2.1% for AGIs $75k-100k, 1.4% for AGIs over 100k)
Total tax: $3,013 (reported on 69.7% of returns)
44310:
$3,013
State:
$6,781
(% of AGI for various income ranges: 1.8% for AGIs below $10k, 4.1% for AGIs $10k-25k, 7.2% for AGIs $25k-50k, 9.0% for AGIs $50k-75k, 11.1% for AGIs $75k-100k, 17.0% for AGIs over 100k)
Earned income credit: $1,672 (reported on 24.2% of returns)
Here:
$1,672
State:
$1,696
Percentage of individuals using paid preparers for their 2004 taxes: 52.4%
Here:
52%
State:
55%
(% for various income ranges: 50.1% for AGIs below $10k, 54.6% for AGIs $10k-25k, 52.3% for AGIs $25k-50k, 50.3% for AGIs $50k-75k, 52.1% for AGIs $75k-100k, 56.8% for AGIs over 100k)
Likely homosexual households (counted as self-reported same-sex unmarried-partner households)
Lesbian couples: 0.1% of all households
Gay men: 0.2% of all households
Household received Food Stamps/SNAP in the past 12 months: 3,297 Household did not receive Food Stamps/SNAP in the past 12 months: 7,089
Women who had a birth in the past 12 months: 526 (215 now married, 304 unmarried) Women who did not have a birth in the past 12 months: 6,077 (2,488 now married, 3,589 unmarried)
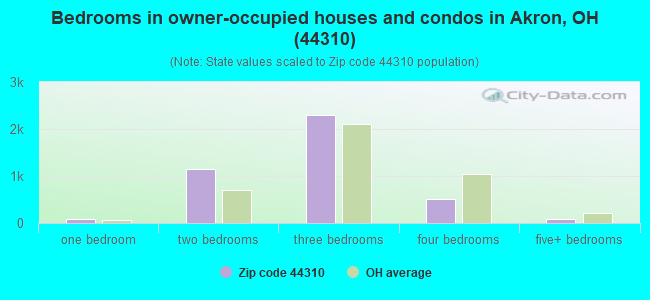
Housing units in zip code 44310 with a mortgage: 2,452 (112 second mortgage, 92 both second mortgage and home equity loan) Houses without a mortgage: 66
Median monthly owner costs for units with a mortgage: $949 Median monthly owner costs for units without a mortgage: $416
Residents with income below the poverty level in 2022:
This zip code:
29.8%
Whole state:
13.4%
Residents with income below 50% of the poverty level in 2022:
This zip code:
18.2%
Whole state:
7.0%
Median number of rooms in houses and condos:
Here:
6.2
State:
6.7
Median number of rooms in apartments:
Here:
4.6
State:
4.4
Notable locations in this zip code not listed on our city pages
Notable locations in zip code 44310: Evans Avenue Industrial Park (A), Walsh Industrial Park (B), Chapel Centre Industrial Park (C), North Branch Library (D), Akron Fire Department Station 7 (E), Portage Path Behavioral Health Services (F). Display/hide their locations on the map
Churches in zip code 44310 include: Christ the King Convent (A), Evangel Temple (B), Shelton Temple Church of God in Christ (C), Zion Apostolic Church (D), North Hill Christian Church (E), Holiness Church of God (F), North Hill United Methodist Church (G), Thayer Street Church of Christ (H), Saint Anthonys Catholic Church (I). Display/hide their locations on the map
Parks in zip code 44310 include: Avon Park (1), Lookout Park (2), Waters Park (3), Patterson Park (4), Cascade Valley Park (5), Bettes Park (6). Display/hide their locations on the map
Tourist attractions (not listed on the city page) : Flare Game Technology Inc (Amusement & Theme Parks; 316 Boyle Street), George Music CO (Amusement & Theme Parks; 316 Boyle Street).
2,811 married couples with children.
2,140 single-parent households (324 men, 1,816 women).
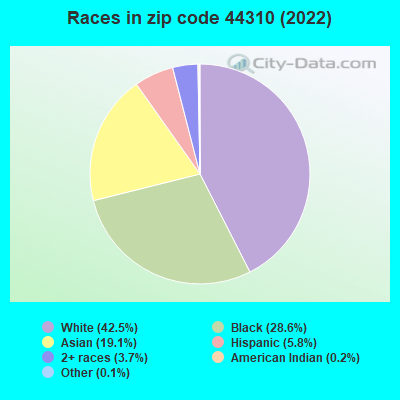
72.9% of residents of 44310 zip code speak English at home.
4.0% of residents speak Spanish at home (30% very well, 29% well, 32% not well, 9% not at all).
15.7% of residents speak other Indo-European language at home (39% very well, 28% well, 20% not well, 13% not at all).
5.2% of residents speak Asian or Pacific Island language at home (31% very well, 12% well, 47% not well, 9% not at all).
1.9% of residents speak other language at home (13% very well, 4% well, 75% not well, 8% not at all).
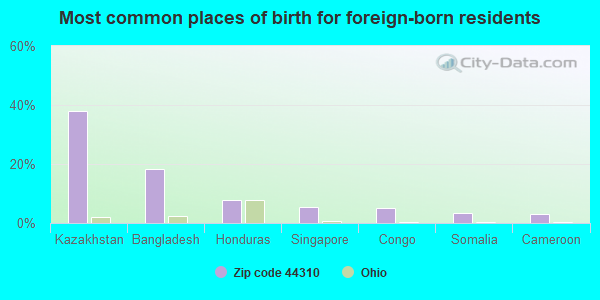
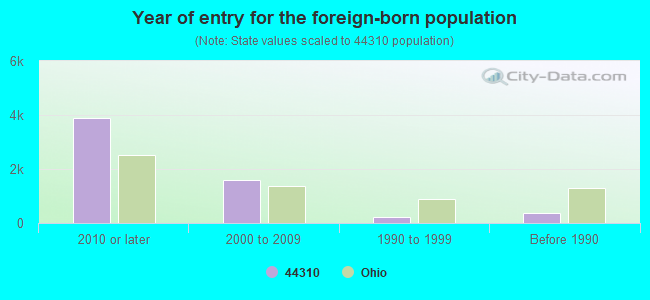
Foreign born population: 5,528 (22.2%) (43.3% of them are naturalized citizens)
Major facilities with environmental interests located in this zip code:
A SCHULMAN INC (790 E. TALLMADGE AVE. in AKRON, OH)
CRITERIA AND HAZARDOUS AIR POLLUTANT INVENTORY (Inventory of air pollution sources) STATE MASTER (Ohio general info) - RCRA-OHD155913114, HAZARDOUS WASTE PROGRAM, AIR MAJOR, EPCRA, TRIS-44310SCHLM790ET, TRI REPORTER HAZARDOUS WASTE BIENNIAL REPORTER (Resource Conservation and Recovery Act (tracking hazardous waste)) Large Quantity Generators, more that 1000 kg of hazardous waste/month (Resource Conservation and Recovery Act (tracking hazardous waste)) - notification TSD (Resource Conservation and Recovery Act (tracking hazardous waste)) TRI REPORTER (Tracking of toxic chemicals releasing facilities) Business SIC classification: CUSTOM COMPOUNDING OF PURCHASED PLASTICS RESINS Business NAICS classification: CUSTOM COMPOUNDING OF PURCHASED RESINS. Alternative names: A SCHULMAN INCORPORATED AKRON PLANT
BETTES ELEMENTARY SCHOOL (1333 BETANA AVE in AKRON, OH)
(Geographic Names Information System) (National Center for Education Statistics) - STATE ID-002600 STATE MASTER (Ohio general info) - AIR MAJOR Organizations: AKRON CITY SD (SCHOOL DISTRICT)
BERINGER PLATING INC (1211 DEVALERA AVE in AKRON, OH)
STATE MASTER (Ohio general info) - RCRA-OHD004190815, HAZARDOUS WASTE PROGRAM, AIR MAJOR, EPCRA HAZARDOUS WASTE BIENNIAL REPORTER (Resource Conservation and Recovery Act (tracking hazardous waste)) Large Quantity Generators, more that 1000 kg of hazardous waste/month (Resource Conservation and Recovery Act (tracking hazardous waste)) Business NAICS classification: ELECTROPLATING, PLATING, POLISHING, ANODIZING, AND COLORING. Organizations: JAMES BERINGER JR (CONTACT/OPERATOR)
ALBRECHT INC (546 E TALLMADGE AVE in AKRON, OH)
STATE MASTER (Ohio general info) - RCRA-OHR000034504, HAZARDOUS WASTE PROGRAM HAZARDOUS WASTE BIENNIAL REPORTER (Resource Conservation and Recovery Act (tracking hazardous waste)) (Resource Conservation and Recovery Act (tracking hazardous waste)) Business SIC classification: DRYCLEANING PLANTS, EXCEPT RUG CLEANING
ACE PRECISION INDUSTRIES INC (850 MOE DR in AKRON, OH)
STATE MASTER (Ohio general info) - RCRA-OHD987056066, HAZARDOUS WASTE PROGRAM Conditionally Exempt Small Quantity Generators, less than 100 kg/month of hazardous waste (Resource Conservation and Recovery Act (tracking hazardous waste)) - notification TSD (Resource Conservation and Recovery Act (tracking hazardous waste)) - notification Organizations: DECLAN SMITH (CONTACT/OWNER)
, JEROME S WOLFE (CONTACT/OWNER)
Alternative names: EXTRUSION SERVICE INC
AKRON TALLMADGE TANK CITY OF (1370 BLACKSTONE AVE in AKRON, OH)
STATE MASTER (Ohio general info) - RCRA-OHR000032243, HAZARDOUS WASTE PROGRAM Large Quantity Generators, more that 1000 kg of hazardous waste/month (Resource Conservation and Recovery Act (tracking hazardous waste)) - notification Business SIC classification: WATER SUPPLY Organizations: CITY OF AKRON (CONTACT/OWNER)
ALEXANDER BODY & FENDER CO INC (611 N MAIN ST in AKRON, OH)
STATE MASTER (Ohio general info) - AIR MAJOR, RCRA-OHD017468208, HAZARDOUS WASTE PROGRAM Conditionally Exempt Small Quantity Generators, less than 100 kg/month of hazardous waste (Resource Conservation and Recovery Act (tracking hazardous waste)) - notification Organizations: ALEXANDER N AND SHANE C (CONTACT/OWNER)
, N ALEXANDER & C SHANE (CONTACT/OWNER)
AMERICAN AUTO BODY (1875 BRITTAIN RD in AKRON, OH)
(Integrated Compliance Information System) - ICIS-HQ-1977-0006, FORMAL ENFORCEMENT ACTION (Resource Conservation and Recovery Act (tracking hazardous waste)) Business SIC classification: TOP, BODY, AND UPHOLSTERY REPAIR SHOPS AND PAINT SHOPS Organizations: PISCAZZI JOE (CONTACT/OWNER)
7UP BOTTLING CO * (1505 INDUSTRIAL PKWY in AKRON, OH)
STATE MASTER (Ohio general info) - RCRA-OHD987009693, HAZARDOUS WASTE PROGRAM Small Quantity Generators, between 100 kg and 1000 kg of hazardous waste/month (Resource Conservation and Recovery Act (tracking hazardous waste)) - notification
A SCHULMAN INC PTC (1183 HOME AVE in AKRON, OH)
STATE MASTER (Ohio general info) - RCRA-OHR000038802, HAZARDOUS WASTE PROGRAM Conditionally Exempt Small Quantity Generators, less than 100 kg/month of hazardous waste (Resource Conservation and Recovery Act (tracking hazardous waste)) - notification
ARTZ LITTLE SCOT CLEANERS (1600 HOME AVE in AKRON, OH)
STATE MASTER (Ohio general info) - AIR MAJOR Small Quantity Generators, between 100 kg and 1000 kg of hazardous waste/month (Resource Conservation and Recovery Act (tracking hazardous waste)) - notification Organizations: ROGER HAMAD (CONTACT/OWNER)
Alternative names: LITTLE SCOTT CLEANERS
BP OIL CO NO 05545 (1450 BRITTAIN RD in AKRON, OH)
STATE MASTER (Ohio general info) - AIR MAJOR, -77-5541-905-19, EPCRA Conditionally Exempt Small Quantity Generators, less than 100 kg/month of hazardous waste (Resource Conservation and Recovery Act (tracking hazardous waste)) - notification Alternative names: BP OIL CO SITE 05545
7UP OF AKRON (1550 INDUSTRIAL PARKWAY in AKRON, OH)
COMPLIANCE ACTIVITY (Tracking inspections of insecticide, fungicide, and rodenticide, and toxic substances) STATE MASTER (Ohio general info) - EPCRA TRI REPORTER (Tracking of toxic chemicals releasing facilities) Business SIC classification: BOTTLED AND CANNED SOFT DRINKS AND CARBONATED WATERS Alternative names: AMERICAN BOTTLING COMPANY OF AKRON, ROYAL CROWN BOTTLING CO
Housing units lacking complete plumbing facilities: 2.5% Housing units lacking complete kitchen facilities: 3.4%
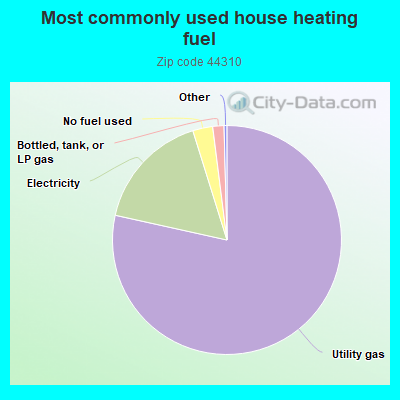
78.4%Utility gas
16.7%Electricity
2.8%No fuel used
1.6%Bottled, tank, or LP gas
Population in 1990: 25,482.
Place of birth for U.S.-born residents:
This state: 15,666
Northeast: 773
Midwest: 761
South: 1,690
West: 321
59% of the 44310 zip code residents lived in the same house 5 years ago. Out of people who lived in different houses, 77% lived in this county. Out of people who lived in different counties, 50% lived in Ohio.
86% of the 44310 zip code residents lived in the same house 1 year ago. Out of people who lived in different houses, 65% moved from this county. Out of people who lived in different houses, 20% moved from different county within same state. Out of people who lived in different houses, 9% moved from different state. Out of people who lived in different houses, 1% moved from abroad.
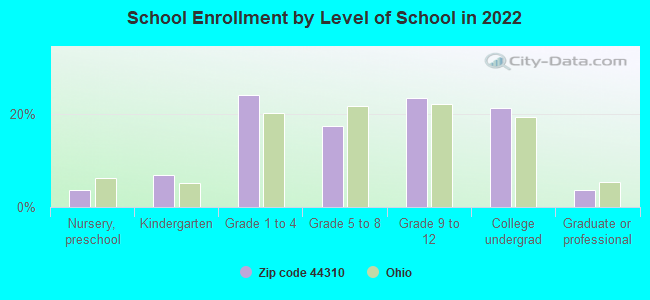
Private vs. public school enrollment:
Students in private schools in grades 1 to 8 (elementary and middle school): 357
Here:
15.2%
Ohio:
16.0%
Students in private schools in grades 9 to 12 (high school): 165
Here:
12.4%
Ohio:
13.1%
Students in private undergraduate colleges: 147
Here:
12.2%
Ohio:
22.3%
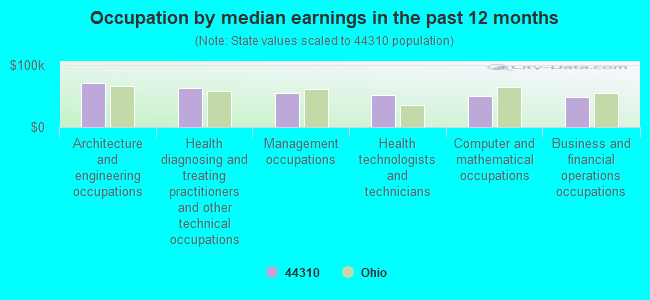
Occupation by median earnings in the past 12 months ($)
71,542Architecture and engineering occupations
63,494Health diagnosing and treating practitioners and other technical occupations
55,966Management occupations
52,626Health technologists and technicians
51,143Computer and mathematical occupations
48,764Business and financial operations occupations
Companies with federal contracts located in this zip code (AKRON, OH):
TYRES INTERNATIONAL INC (619 E TALLMADGE AVE; small business)
$191,840 with Army for Miscellaneous Vehicular Components. Signed on 2003-07-31. Completion date: 2003-08-14.
LOGAN MACHINE COMPANY (1405 HOME AVENUE; small business)
$82,593 with Defense Logistics Agency for Aircraft Wheel and Brake Systems. Signed on 2001-03-23. Completion date: 2001-09-22.
PALMER INDUSTRIES INC (920 MOE DR; small business)
$9,336 with Army for Ship and Boat Propulsion Components. Signed on 2005-12-08. Completion date: 2005-12-20.
GENERAL METALS POWDER COMPANY (1195 HOME AVE; small business)
$5,288 with Navy for Maintenance, Repair and Rebuilding of Equipment -- Materials Handling Equipment. Signed on 2006-03-23. Completion date: 2006-04-24.
LENTINE MUSIC INC (844 N MAIN ST; small business)
$4,313 with Army for ADP Software. Signed on 2004-09-30. Completion date: 2004-10-15.
GOACHER, VIVIAN C (1504 BREIDING RD; small business)
$2,800 with Army for Laundry and DryCleaning Services. Signed on 2005-04-21. Completion date: 2005-06-25.
Top industries in this zip code by the number of employees in 2005:
Health Care and Social Assistance: General Medical and Surgical Hospitals (over 1000 employees: 1 establishment)
Administrative and Support and Waste Management and Remediation Services: Temporary Help Services (500-999: 1, 100-249: 1, 50-99: 3)
Management of Companies and Enterprises: Corporate, Subsidiary, and Regional Managing Offices (500-999: 1, 50-99: 1, 5-9: 1, 1-4: 1)
2003 - 2018 National Fire Incident Reporting System (NFIRS) incidents
According to the data from the years 2003 - 2018 the average number of fires per year is 87. The highest number of reported fire incidents - 124 took place in 2007, and the least - 64 in 2017. The data has a decreasing trend.
When looking into fire subcategories, the most reports belonged to: Structure Fires (46.1%), and Outside Fires (28.0%).
Fire incident types reported to NFIRS in Zip Code 44310

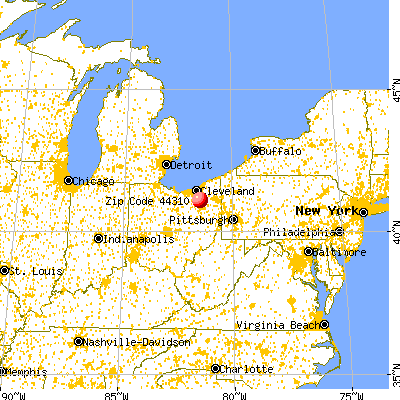


 Nearest zip codes: 44304, 44308, 44221, 44303, 44305, 44302.


 According to the data from the years 2003 - 2018 the average number of fires per year is 87. The highest number of reported fire incidents - 124 took place in 2007, and the least - 64 in 2017. The data has a decreasing trend.
 When looking into fire subcategories, the most reports belonged to: Structure Fires (46.1%), and Outside Fires (28.0%).