Estimated zip code population in 2022: 5,035 Zip code population in 2010: 5,524 Zip code population in 2000: 6,211
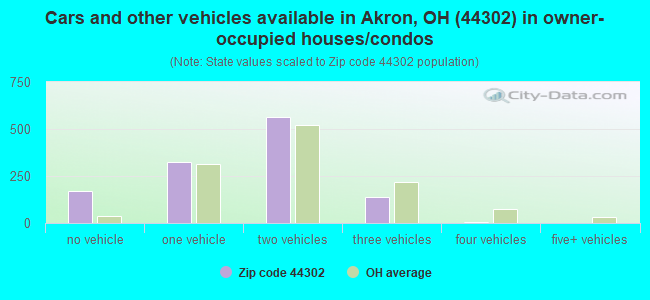
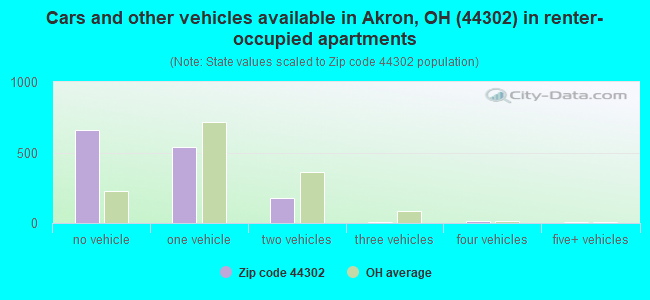
Houses and condos: 2,926 Renter-occupied apartments: 1,424
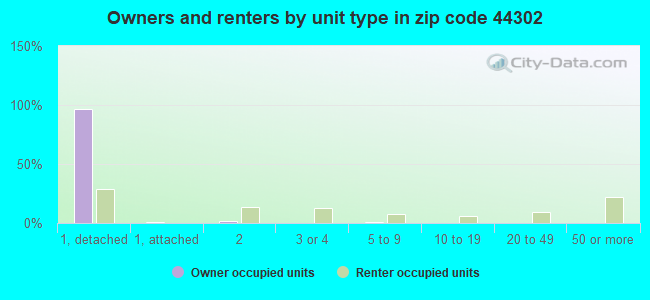
% of renters here:
54%
State:
33%
March 2022 cost of living index in zip code 44302: 95.0 (less than average, U.S. average is 100)
Land area: 0.9 sq. mi. Water area: 0.0 sq. mi.
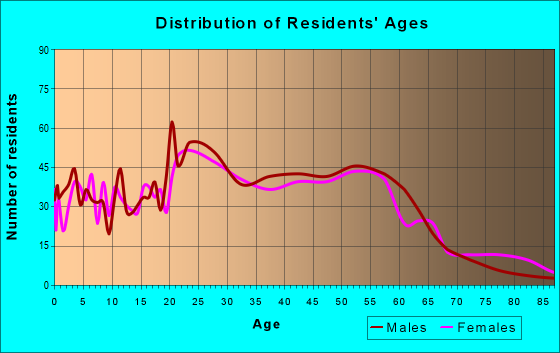
Population density: 5,363 people per square mile
(average).
OSM Map
General Map
Google Map
MSN Map
OSM Map
General Map
Google Map
MSN Map
OSM Map
General Map
Google Map
MSN Map
OSM Map
General Map
Google Map
MSN Map
Please wait while loading the map...
Real estate property taxes paid for housing units in 2022:
This zip code:
1.6% ($1,919)
Ohio:
1.3% ($2,639)
Median real estate property taxes paid for housing units with mortgages in 2022: $2,036 (1.6%) Median real estate property taxes paid for housing units with no mortgage in 2022: $1,809 (2.5%)
Averages for the 2020 tax year for zip code 44302, filed in 2021:
Average Adjusted Gross Income (AGI) in 2020: $37,008 (Individual Income Tax Returns)
Here:
$37,008
State:
$67,288
Salary/wage: $33,708 (reported on 87.6% of returns)
Here:
$33,708
State:
$55,628
(% of AGI for various income ranges: 1199.7% for AGIs below $25k, 3805.8% for AGIs $25k-50k, 6880.0% for AGIs $50k-75k, 10223.8% for AGIs $75k-100k, 23508.3% for AGIs $100k-200k)
Taxable interest for individuals: $380 (reported on 12.8% of returns)
This zip code:
$380
Ohio:
$1,518
(% of AGI for various income ranges: 3.3% for AGIs below $25k, 5.6% for AGIs $25k-50k, 9.5% for AGIs $50k-75k, 28.7% for AGIs $75k-100k, 16.7% for AGIs $100k-200k)
Ordinary dividends: $1,455 (reported on 9.4% of returns)
Here:
$1,455
State:
$7,167
(% of AGI for various income ranges: 4.4% for AGIs below $25k, 11.6% for AGIs $25k-50k, 23.3% for AGIs $50k-75k, 111.2% for AGIs $75k-100k, 128.3% for AGIs $100k-200k)
Net capital gain/loss in AGI: +$5,005 (reported on 8.1% of returns)
Here:
+$5,005
State:
+$18,919
(% of AGI for various income ranges: 6.0% for AGIs below $25k, 23.9% for AGIs $25k-50k, 48.6% for AGIs $50k-75k, 188.8% for AGIs $75k-100k, 848.3% for AGIs $100k-200k)
Profit/loss from business: +$5,923 (reported on 16.7% of returns)
Here:
+$5,923
State:
+$13,744
(% of AGI for various income ranges: 93.9% for AGIs below $25k, 107.4% for AGIs $25k-50k, 165.7% for AGIs $50k-75k, 198.8% for AGIs $75k-100k, 591.7% for AGIs $100k-200k)
Taxable individual retirement arrangement distribution: $12,960 (reported on 4.3% of returns)
44302:
$12,960
Ohio:
$18,876
(% of AGI for various income ranges: 17.1% for AGIs below $25k, 115.8% for AGIs $25k-50k, 605.0% for AGIs $75k-100k)
Total itemized deductions: $22,820 (reported on 2.1% of returns)
Here:
$22,820
State:
$33,869
(% of AGI for various income ranges: 93.2% for AGIs $25k-50k, 1016.7% for AGIs $100k-200k)
Charity contributions: $6,625 (reported on 1.7% of returns)
Here:
$6,625
State:
$14,577
(% of AGI for various income ranges: 331.2% for AGIs $75k-100k)
Taxes paid: $5,783 (reported on 2.6% of returns)
44302:
$5,783
State:
$7,681
(% of AGI for various income ranges: 21.9% for AGIs $25k-50k, 370.0% for AGIs $100k-200k)
Earned income credit: $2,088 (reported on 24.8% of returns)
Here:
$2,088
State:
$2,304
(% of AGI for various income ranges: 96.3% for AGIs below $25k, 62.1% for AGIs $25k-50k)
Percentage of individuals using paid preparers for their 2020 taxes: 94.0%
Here:
94%
State:
94%
(% for various income ranges: 93.6% for AGIs below $25k, 95.8% for AGIs $25k-50k, 93.1% for AGIs $50k-75k, 91.7% for AGIs $75k-100k, 91.7% for AGIs $100k-200k)
Averages for the 2012 tax year for zip code 44302, filed in 2013:
Average Adjusted Gross Income (AGI) in 2012: $30,100 (Individual Income Tax Returns)
Here:
$30,100
State:
$54,926
Salary/wage: $28,713 (reported on 88.4% of returns)
Here:
$28,713
State:
$45,869
(% of AGI for various income ranges: 81.4% for AGIs below $25k, 88.7% for AGIs $25k-50k, 84.7% for AGIs $50k-75k, 83.4% for AGIs $75k-100k, 78.8% for AGIs $100k-200k)
Taxable interest for individuals: $444 (reported on 15.5% of returns)
This zip code:
$444
Ohio:
$1,297
(% of AGI for various income ranges: 0.4% for AGIs below $25k, 0.3% for AGIs $25k-50k, 0.1% for AGIs $50k-75k, 0.1% for AGIs $75k-100k, 0.1% for AGIs $100k-200k)
Ordinary dividends: $1,652 (reported on 9.1% of returns)
Here:
$1,652
State:
$5,821
(% of AGI for various income ranges: 0.7% for AGIs below $25k, 0.4% for AGIs $25k-50k, 0.4% for AGIs $50k-75k, 0.3% for AGIs $75k-100k, 0.7% for AGIs $100k-200k)
Profit/loss from business: +$6,691 (reported on 14.7% of returns)
Here:
+$6,691
State:
+$12,773
(% of AGI for various income ranges: 9.7% for AGIs below $25k, 1.8% for AGIs $25k-50k, 1.4% for AGIs $50k-75k, 1.5% for AGIs $75k-100k)
Taxable individual retirement arrangement distribution: $8,845 (reported on 4.7% of returns)
44302:
$8,845
Ohio:
$14,511
(% of AGI for various income ranges: 1.1% for AGIs below $25k, 1.1% for AGIs $25k-50k, 1.3% for AGIs $50k-75k, 4.3% for AGIs $75k-100k)
Total itemized deductions: $13,215 (22% of AGI, reported on 16.8% of returns)
Here:
$13,215
State:
$21,278
Here:
21.6% of AGI
State:
18.8% of AGI
(% of AGI for various income ranges: 2.9% for AGIs below $25k, 6.2% for AGIs $25k-50k, 9.0% for AGIs $50k-75k, 9.7% for AGIs $75k-100k, 13.4% for AGIs $100k-200k)
Charity contributions: $2,763 (reported on 11.6% of returns)
Here:
$2,763
State:
$3,943
(% of AGI for various income ranges: 0.8% for AGIs $25k-50k, 1.2% for AGIs $50k-75k, 1.3% for AGIs $75k-100k, 3.3% for AGIs $100k-200k)
Taxes paid: $5,023 (reported on 16.8% of returns)
44302:
$5,023
State:
$9,568
(% of AGI for various income ranges: 0.5% for AGIs below $25k, 2.0% for AGIs $25k-50k, 3.5% for AGIs $50k-75k, 4.0% for AGIs $75k-100k, 6.8% for AGIs $100k-200k)
Earned income credit: $2,215 (reported on 29.3% of returns)
Here:
$2,215
State:
$2,285
(% of AGI for various income ranges: 8.0% for AGIs below $25k, 1.0% for AGIs $25k-50k)
Percentage of individuals using paid preparers for their 2012 taxes: 37.9%
Here:
38%
State:
51%
(% for various income ranges: 34.9% for AGIs below $25k, 37.7% for AGIs $25k-50k, 44.0% for AGIs $50k-75k, 50.0% for AGIs $75k-100k, 57.1% for AGIs $100k-200k)
Averages for the 2004 tax year for zip code 44302, filed in 2005:
Average Adjusted Gross Income (AGI) in 2004: $27,836 (Individual Income Tax Returns)
Here:
$27,836
State:
$44,480
Salary/wage: $26,304 (reported on 91.5% of returns)
Here:
$26,304
State:
$39,198
(% of AGI for various income ranges: 94.0% for AGIs below $10k, 88.0% for AGIs $10k-25k, 90.5% for AGIs $25k-50k, 88.9% for AGIs $50k-75k, 87.9% for AGIs $75k-100k, 59.2% for AGIs over 100k)
Taxable interest for individuals: $808 (reported on 22.1% of returns)
This zip code:
$808
Ohio:
$1,532
(% of AGI for various income ranges: 1.8% for AGIs below $10k, 1.0% for AGIs $10k-25k, 0.5% for AGIs $25k-50k, 0.4% for AGIs $50k-75k, 0.1% for AGIs $75k-100k, 0.6% for AGIs over 100k)
Taxable dividends: $1,171 (reported on 10.4% of returns)
Here:
$1,171
State:
$3,496
(% of AGI for various income ranges: 0.6% for AGIs below $10k, 0.5% for AGIs $10k-25k, 0.3% for AGIs $25k-50k, 0.4% for AGIs $50k-75k, 0.5% for AGIs $75k-100k, 0.6% for AGIs over 100k)
Net capital gain/loss: +$1,063 (reported on 7.1% of returns)
Here:
+$1,063
State:
+$8,582
(% of AGI for various income ranges: 1.5% for AGIs below $10k, -0.1% for AGIs $10k-25k, 0.3% for AGIs $25k-50k, 0.3% for AGIs $50k-75k, 0.4% for AGIs $75k-100k, 0.2% for AGIs over 100k)
Profit/loss from business: +$5,065 (reported on 12.0% of returns)
Here:
+$5,065
State:
+$10,813
(% of AGI for various income ranges: 5.7% for AGIs below $10k, 3.8% for AGIs $10k-25k, 1.5% for AGIs $25k-50k, 2.0% for AGIs $50k-75k, 2.4% for AGIs $75k-100k)
IRA payment deduction: $1,875 (reported on 1.6% of returns)
44302:
$1,875
Ohio:
$2,794
Total itemized deductions: $12,757 (23% of AGI, reported on 22.6% of returns)
Here:
$12,757
State:
$17,503
Here:
23.1% of AGI
State:
20.8% of AGI
(% of AGI for various income ranges: 5.1% for AGIs $10k-25k, 9.5% for AGIs $25k-50k, 16.1% for AGIs $50k-75k, 15.0% for AGIs $75k-100k, 13.8% for AGIs over 100k)
Charity contributions deductions: $2,527 (4% of AGI, reported on 18.0% of returns)
Here:
$2,527
State:
$3,087
Here:
4.3% of AGI
State:
3.4% of AGI
(% of AGI for various income ranges: 0.4% for AGIs $10k-25k, 1.1% for AGIs $25k-50k, 2.7% for AGIs $50k-75k, 3.2% for AGIs $75k-100k, 3.5% for AGIs over 100k)
Total tax: $3,185 (reported on 67.2% of returns)
44302:
$3,185
State:
$6,781
(% of AGI for various income ranges: 1.8% for AGIs below $10k, 4.3% for AGIs $10k-25k, 7.7% for AGIs $25k-50k, 9.9% for AGIs $50k-75k, 10.8% for AGIs $75k-100k, 10.5% for AGIs over 100k)
Earned income credit: $1,727 (reported on 28.6% of returns)
Here:
$1,727
State:
$1,696
Percentage of individuals using paid preparers for their 2004 taxes: 46.7%
Here:
47%
State:
55%
(% for various income ranges: 44.8% for AGIs below $10k, 51.4% for AGIs $10k-25k, 41.5% for AGIs $25k-50k, 51.4% for AGIs $50k-75k, 39.1% for AGIs $75k-100k, 52.6% for AGIs over 100k)
Household received Food Stamps/SNAP in the past 12 months: 670 Household did not receive Food Stamps/SNAP in the past 12 months: 1,972
Women who did not have a birth in the past 12 months: 1,176 (535 now married, 640 unmarried)
Housing units in zip code 44302 with a mortgage: 802 (151 second mortgage, 155 both second mortgage and home equity loan) Median monthly owner costs for units with a mortgage: $1,108 Median monthly owner costs for units without a mortgage: $343
Residents with income below the poverty level in 2022:
This zip code:
23.7%
Whole state:
13.4%
Residents with income below 50% of the poverty level in 2022:
This zip code:
13.6%
Whole state:
7.0%
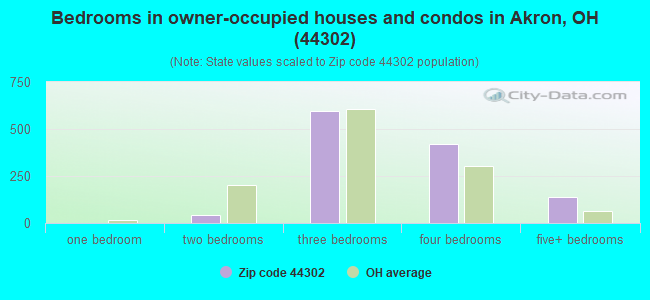
Median number of rooms in houses and condos:
Here:
7.9
State:
6.7
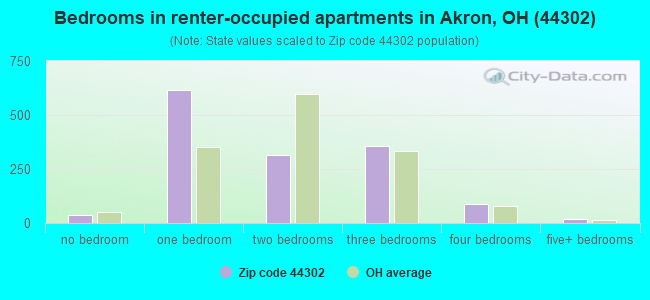
Median number of rooms in apartments:
Here:
4.3
State:
4.4
Notable locations in this zip code not listed on our city pages
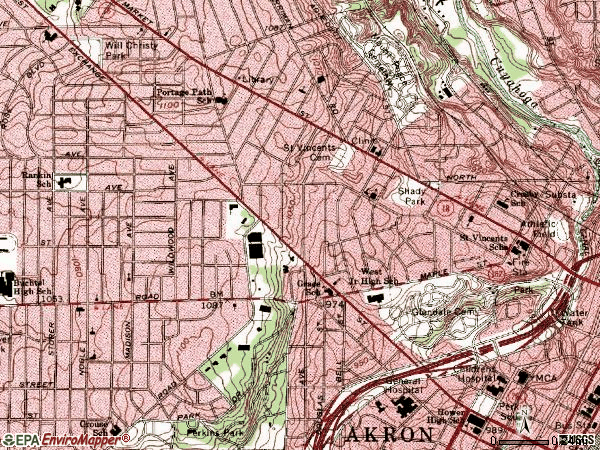
Churches in zip code 44302 include: Saint Joseph Melkite Greek Catholic Church (A), Church of Our Savior (B), House of Prayer for All People (C), River of Life Church (D), Friendship Apostolic Church of Christ (E). Display/hide their locations on the map
Parks in zip code 44302 include: Will Christy Park (1), Glendale Park (2), Hall Park Allotment Historic District (3). Display/hide their locations on the map
481 married couples with children.
388 single-parent households (388 women).
92.5% of residents of 44302 zip code speak English at home.
2.4% of residents speak Spanish at home (79% very well, 4% not well, 17% not at all).
3.8% of residents speak other Indo-European language at home (55% very well, 3% not well, 41% not at all).
0.6% of residents speak Asian or Pacific Island language at home (100% very well).
0.6% of residents speak other language at home (33% very well, 67% well).
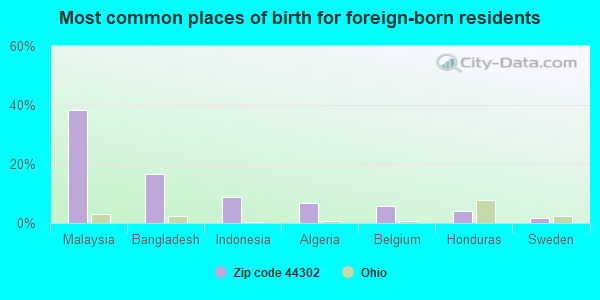
Foreign born population: 405 (8.0%) (38.7% of them are naturalized citizens)
Facilities with environmental interests located in this zip code:
BALCH STREET COMMUNITY CENTER (220 SOUTH BALCH STREET in AKRON, OH)
(Integrated Compliance Information System) - ICIS-05-1993-0539, FORMAL ENFORCEMENT ACTION, ICIS-05-1993-0540,
AKRON RUBBER DEVELOPMENT LAB (300 KENMORE BLVD in AKRON, OH)
(Resource Conservation and Recovery Act (tracking hazardous waste)) Organizations: HALSEY RUSSELL (CONTACT/OWNER)
Housing units lacking complete plumbing facilities: 0.6% Housing units lacking complete kitchen facilities: 1.6%
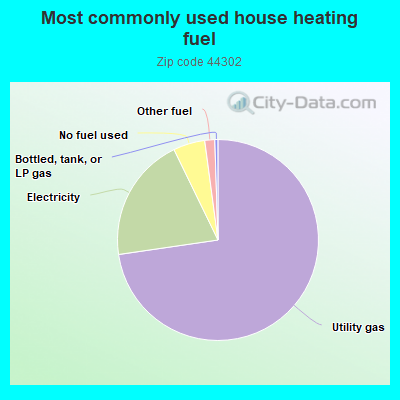
72.7%Utility gas
20.1%Electricity
5.1%No fuel used
1.6%Other fuel
0.5%Bottled, tank, or LP gas
Population in 1990: 6,835.
Place of birth for U.S.-born residents:
This state: 3,640
Northeast: 226
Midwest: 164
South: 491
West: 91
51% of the 44302 zip code residents lived in the same house 5 years ago. Out of people who lived in different houses, 74% lived in this county. Out of people who lived in different counties, 50% lived in Ohio.
94% of the 44302 zip code residents lived in the same house 1 year ago. Out of people who lived in different houses, 86% moved from this county. Out of people who lived in different houses, 4% moved from different county within same state. Out of people who lived in different houses, 6% moved from different state. Out of people who lived in different houses, 5% moved from abroad.
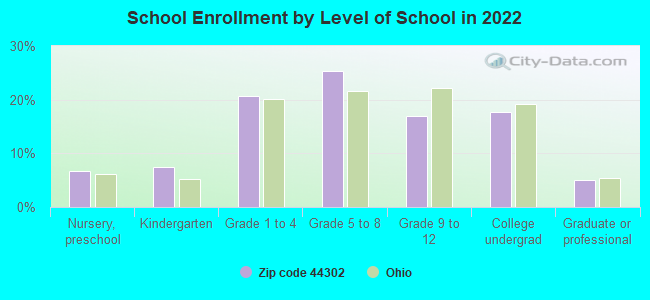
Private vs. public school enrollment:
Students in private schools in grades 1 to 8 (elementary and middle school): 228
Here:
48.5%
Ohio:
16.0%
Students in private schools in grades 9 to 12 (high school): 9
Here:
5.5%
Ohio:
13.1%
Students in private undergraduate colleges: 7
Here:
4.2%
Ohio:
22.3%
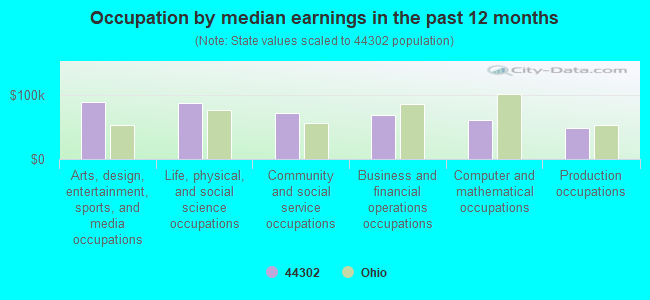
Occupation by median earnings in the past 12 months ($)
88,757Arts, design, entertainment, sports, and media occupations
86,772Life, physical, and social science occupations
71,837Community and social service occupations
68,292Business and financial operations occupations
60,315Computer and mathematical occupations
48,557Production occupations
Top industries in this zip code by the number of employees in 2005:
Health Care and Social Assistance: Offices of Physicians (except Mental Health Specialists) (50-99 employees: 2 establishments, 20-49 employees: 4 establishments, 10-19 employees: 5 establishments, 5-9 employees: 7 establishments, 1-4 employees: 7 establishments)
Health Care and Social Assistance: Residential Mental Retardation Facilities (100-249: 1, 5-9: 2, 1-4: 1)
Health Care and Social Assistance: Vocational Rehabilitation Services (100-249: 1)
Health Care and Social Assistance: Child and Youth Services (50-99: 1)
Other Services (except Public Administration): Civic and Social Organizations (20-49: 2)
Health Care and Social Assistance: Child Day Care Services (20-49: 1, 10-19: 1, 5-9: 1)
Construction: Commercial and Institutional Building Construction (10-19: 2, 5-9: 1)
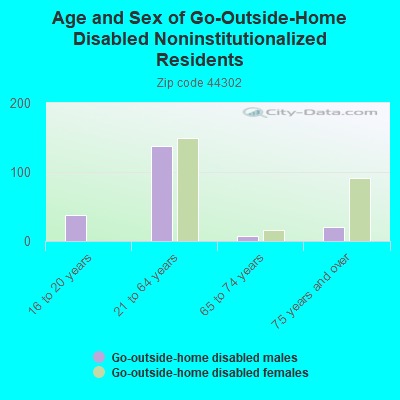
People in group quarters in 2010:
49 people in other noninstitutional facilities
8 people in emergency and transitional shelters (with sleeping facilities) for people experiencing homelessness
4 people in group homes intended for adults
3 people in residential treatment centers for adults
People in group quarters in 2000:
34 people in other noninstitutional group quarters
11 people in homes for the mentally retarded
5 people in homes or halfway houses for drug/alcohol abuse
4 people in other nonhousehold living situations
3 people in hospitals/wards and hospices for chronically ill
3 people in hospices or homes for chronically ill
Fatal accident statistics in 2010:
Fatal accident count: 1
Vehicles involved in fatal accidents: 2
Fatal accidents caused by drunken drivers: 0
Fatalities: 1
Persons involved in fatal accidents: 9
Pedestrians involved in fatal accidents: 0
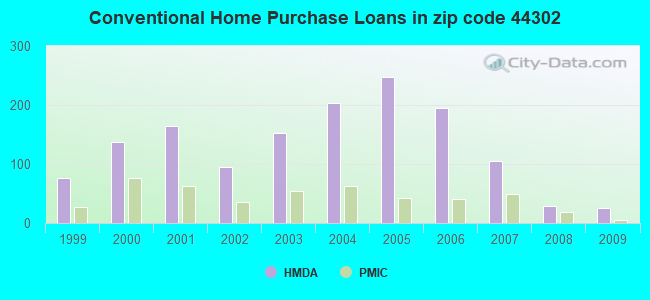
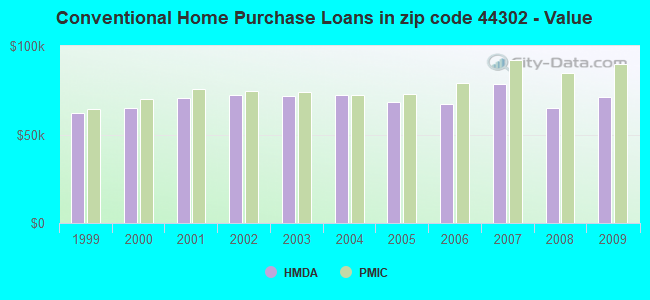
Home Mortgage Disclosure Act Aggregated Statistics For Year 2009 (Based on 2 full and 8 partial tracts)
A) FHA, FSA/RHS & VA Home Purchase Loans
B) Conventional Home Purchase Loans
C) Refinancings
D) Home Improvement Loans
F) Non-occupant Loans on < 5 Family Dwellings (A B C & D)
Number
Average Value
Number
Average Value
Number
Average Value
Number
Average Value
Number
Average Value
LOANS ORIGINATED
42
$77,983
26
$70,926
47
$88,831
10
$21,836
21
$61,645
APPLICATIONS APPROVED, NOT ACCEPTED
0
$0
0
$0
18
$81,243
2
$7,420
0
$0
APPLICATIONS DENIED
16
$103,742
5
$46,644
40
$76,567
16
$26,527
10
$59,145
APPLICATIONS WITHDRAWN
10
$102,339
5
$44,532
30
$76,095
0
$0
5
$47,950
FILES CLOSED FOR INCOMPLETENESS
2
$82,655
1
$20,960
7
$97,971
2
$80,505
1
$33,810
Aggregated Statistics For Year 2008 (Based on 2 full and 8 partial tracts)
A) FHA, FSA/RHS & VA Home Purchase Loans
B) Conventional Home Purchase Loans
C) Refinancings
D) Home Improvement Loans
E) Loans on Dwellings For 5+ Families
F) Non-occupant Loans on < 5 Family Dwellings (A B C & D)
Number
Average Value
Number
Average Value
Number
Average Value
Number
Average Value
Number
Average Value
Number
Average Value
LOANS ORIGINATED
26
$89,523
29
$65,122
71
$81,700
14
$44,084
4
$358,688
34
$49,791
APPLICATIONS APPROVED, NOT ACCEPTED
4
$62,942
5
$60,388
8
$88,729
1
$11,180
0
$0
2
$74,220
APPLICATIONS DENIED
10
$88,299
16
$56,186
110
$84,513
59
$23,489
0
$0
33
$60,312
APPLICATIONS WITHDRAWN
2
$79,280
6
$49,703
19
$82,849
2
$92,875
0
$0
6
$59,807
FILES CLOSED FOR INCOMPLETENESS
0
$0
2
$71,920
9
$83,859
2
$18,770
0
$0
0
$0
Aggregated Statistics For Year 2007 (Based on 2 full and 8 partial tracts)
A) FHA, FSA/RHS & VA Home Purchase Loans
B) Conventional Home Purchase Loans
C) Refinancings
D) Home Improvement Loans
E) Loans on Dwellings For 5+ Families
F) Non-occupant Loans on < 5 Family Dwellings (A B C & D)
G) Loans On Manufactured Home Dwelling (A B C & D)
Number
Average Value
Number
Average Value
Number
Average Value
Number
Average Value
Number
Average Value
Number
Average Value
Number
Average Value
LOANS ORIGINATED
11
$105,440
105
$78,635
113
$74,489
25
$26,238
8
$152,135
61
$65,980
2
$48,945
APPLICATIONS APPROVED, NOT ACCEPTED
2
$102,050
17
$70,551
28
$75,931
12
$21,553
0
$0
10
$62,182
0
$0
APPLICATIONS DENIED
2
$134,100
64
$63,944
177
$84,688
56
$41,464
0
$0
62
$64,507
2
$21,085
APPLICATIONS WITHDRAWN
2
$80,965
16
$72,138
54
$78,300
3
$9,560
2
$500,450
16
$79,535
0
$0
FILES CLOSED FOR INCOMPLETENESS
0
$0
6
$79,988
13
$107,843
0
$0
0
$0
2
$66,530
0
$0
Aggregated Statistics For Year 2006 (Based on 2 full and 8 partial tracts)
A) FHA, FSA/RHS & VA Home Purchase Loans
B) Conventional Home Purchase Loans
C) Refinancings
D) Home Improvement Loans
E) Loans on Dwellings For 5+ Families
F) Non-occupant Loans on < 5 Family Dwellings (A B C & D)
Number
Average Value
Number
Average Value
Number
Average Value
Number
Average Value
Number
Average Value
Number
Average Value
LOANS ORIGINATED
14
$100,626
195
$67,029
190
$75,609
28
$40,251
2
$107,880
122
$62,927
APPLICATIONS APPROVED, NOT ACCEPTED
2
$88,555
32
$68,200
54
$77,760
5
$42,126
0
$0
16
$86,590
APPLICATIONS DENIED
2
$83,910
105
$74,827
226
$80,561
47
$27,660
4
$100,890
90
$73,258
APPLICATIONS WITHDRAWN
3
$84,583
44
$82,973
81
$94,097
11
$39,687
4
$89,072
34
$81,446
FILES CLOSED FOR INCOMPLETENESS
0
$0
4
$92,412
36
$89,098
0
$0
0
$0
7
$42,921
Aggregated Statistics For Year 2005 (Based on 2 full and 8 partial tracts)
A) FHA, FSA/RHS & VA Home Purchase Loans
B) Conventional Home Purchase Loans
C) Refinancings
D) Home Improvement Loans
E) Loans on Dwellings For 5+ Families
F) Non-occupant Loans on < 5 Family Dwellings (A B C & D)
G) Loans On Manufactured Home Dwelling (A B C & D)
Number
Average Value
Number
Average Value
Number
Average Value
Number
Average Value
Number
Average Value
Number
Average Value
Number
Average Value
LOANS ORIGINATED
12
$88,713
247
$68,149
266
$86,561
46
$28,272
6
$213,657
191
$73,220
0
$0
APPLICATIONS APPROVED, NOT ACCEPTED
0
$0
49
$66,412
71
$73,057
17
$38,551
0
$0
35
$67,090
0
$0
APPLICATIONS DENIED
0
$0
122
$68,345
283
$80,033
88
$33,599
0
$0
119
$61,459
6
$57,270
APPLICATIONS WITHDRAWN
5
$104,952
187
$122,691
133
$88,970
25
$85,260
0
$0
49
$79,768
0
$0
FILES CLOSED FOR INCOMPLETENESS
0
$0
8
$94,059
29
$100,671
6
$31,798
0
$0
4
$60,228
0
$0
Aggregated Statistics For Year 2004 (Based on 2 full and 8 partial tracts)
A) FHA, FSA/RHS & VA Home Purchase Loans
B) Conventional Home Purchase Loans
C) Refinancings
D) Home Improvement Loans
E) Loans on Dwellings For 5+ Families
F) Non-occupant Loans on < 5 Family Dwellings (A B C & D)
G) Loans On Manufactured Home Dwelling (A B C & D)
Number
Average Value
Number
Average Value
Number
Average Value
Number
Average Value
Number
Average Value
Number
Average Value
Number
Average Value
LOANS ORIGINATED
29
$93,819
204
$72,503
282
$78,567
39
$40,602
2
$623,340
159
$65,038
2
$5,060
APPLICATIONS APPROVED, NOT ACCEPTED
0
$0
57
$65,808
103
$73,258
3
$57,520
0
$0
49
$69,666
0
$0
APPLICATIONS DENIED
0
$0
60
$72,092
201
$83,037
44
$27,830
0
$0
37
$66,866
2
$72,925
APPLICATIONS WITHDRAWN
5
$99,224
29
$88,462
143
$85,185
6
$73,043
0
$0
19
$65,104
0
$0
FILES CLOSED FOR INCOMPLETENESS
0
$0
7
$83,189
38
$80,006
0
$0
0
$0
11
$71,447
0
$0
Aggregated Statistics For Year 2003 (Based on 2 full and 8 partial tracts)
A) FHA, FSA/RHS & VA Home Purchase Loans
B) Conventional Home Purchase Loans
C) Refinancings
D) Home Improvement Loans
E) Loans on Dwellings For 5+ Families
F) Non-occupant Loans on < 5 Family Dwellings (A B C & D)
Number
Average Value
Number
Average Value
Number
Average Value
Number
Average Value
Number
Average Value
Number
Average Value
LOANS ORIGINATED
29
$97,109
152
$71,782
456
$73,816
10
$18,042
6
$219,758
173
$57,077
APPLICATIONS APPROVED, NOT ACCEPTED
0
$0
23
$52,355
81
$71,312
6
$16,442
0
$0
22
$56,076
APPLICATIONS DENIED
3
$78,933
40
$69,719
227
$71,699
45
$17,690
2
$188,920
33
$60,360
APPLICATIONS WITHDRAWN
7
$105,141
21
$90,552
115
$78,567
10
$38,029
0
$0
18
$64,883
FILES CLOSED FOR INCOMPLETENESS
0
$0
10
$60,762
48
$83,060
0
$0
0
$0
12
$56,448
Aggregated Statistics For Year 2002 (Based on 2 full and 8 partial tracts)
A) FHA, FSA/RHS & VA Home Purchase Loans
B) Conventional Home Purchase Loans
C) Refinancings
D) Home Improvement Loans
E) Loans on Dwellings For 5+ Families
F) Non-occupant Loans on < 5 Family Dwellings (A B C & D)
Number
Average Value
Number
Average Value
Number
Average Value
Number
Average Value
Number
Average Value
Number
Average Value
LOANS ORIGINATED
33
$84,977
95
$72,568
356
$74,676
23
$22,969
0
$0
119
$77,053
APPLICATIONS APPROVED, NOT ACCEPTED
2
$47,230
29
$54,167
92
$75,634
16
$22,853
4
$119,368
27
$62,315
APPLICATIONS DENIED
2
$87,905
41
$55,756
253
$71,672
35
$12,509
2
$54,940
46
$58,405
APPLICATIONS WITHDRAWN
7
$96,357
14
$75,059
143
$73,288
8
$15,616
0
$0
20
$71,282
FILES CLOSED FOR INCOMPLETENESS
2
$96,150
6
$60,462
29
$79,580
0
$0
0
$0
8
$48,032
Aggregated Statistics For Year 2001 (Based on 2 full and 8 partial tracts)
A) FHA, FSA/RHS & VA Home Purchase Loans
B) Conventional Home Purchase Loans
C) Refinancings
D) Home Improvement Loans
E) Loans on Dwellings For 5+ Families
F) Non-occupant Loans on < 5 Family Dwellings (A B C & D)
Number
Average Value
Number
Average Value
Number
Average Value
Number
Average Value
Number
Average Value
Number
Average Value
LOANS ORIGINATED
46
$83,502
164
$70,855
367
$64,535
30
$19,090
5
$285,410
137
$54,983
APPLICATIONS APPROVED, NOT ACCEPTED
4
$69,230
11
$54,994
100
$70,285
6
$11,898
0
$0
12
$70,921
APPLICATIONS DENIED
4
$69,422
54
$73,908
327
$62,987
58
$16,036
0
$0
58
$62,908
APPLICATIONS WITHDRAWN
2
$76,555
15
$66,785
115
$70,649
6
$27,352
0
$0
16
$63,791
FILES CLOSED FOR INCOMPLETENESS
0
$0
4
$48,732
25
$62,974
0
$0
0
$0
2
$47,230
Aggregated Statistics For Year 2000 (Based on 2 full and 8 partial tracts)
A) FHA, FSA/RHS & VA Home Purchase Loans
B) Conventional Home Purchase Loans
C) Refinancings
D) Home Improvement Loans
E) Loans on Dwellings For 5+ Families
F) Non-occupant Loans on < 5 Family Dwellings (A B C & D)
Number
Average Value
Number
Average Value
Number
Average Value
Number
Average Value
Number
Average Value
Number
Average Value
LOANS ORIGINATED
23
$70,418
137
$65,099
198
$57,763
45
$21,438
7
$271,643
79
$53,683
APPLICATIONS APPROVED, NOT ACCEPTED
4
$80,380
21
$51,234
63
$58,102
21
$15,162
0
$0
11
$56,809
APPLICATIONS DENIED
10
$81,539
69
$59,813
311
$61,052
102
$10,965
1
$341,500
54
$58,796
APPLICATIONS WITHDRAWN
8
$55,705
26
$59,215
84
$59,444
10
$31,668
0
$0
20
$52,066
FILES CLOSED FOR INCOMPLETENESS
2
$52,940
4
$64,090
30
$63,017
4
$34,120
0
$0
2
$45,785
Aggregated Statistics For Year 1999 (Based on 1 full and 4 partial tracts)
A) FHA, FSA/RHS & VA Home Purchase Loans
B) Conventional Home Purchase Loans
C) Refinancings
D) Home Improvement Loans
E) Loans on Dwellings For 5+ Families
F) Non-occupant Loans on < 5 Family Dwellings (A B C & D)
2003 - 2018 National Fire Incident Reporting System (NFIRS) incidents
Based on the data from the years 2003 - 2018 the average number of fire incidents per year is 28. The highest number of reported fire incidents - 45 took place in 2003, and the least - 15 in 2015. The data has a dropping trend.
When looking into fire subcategories, the most reports belonged to: Structure Fires (51.6%), and Outside Fires (22.0%).
Fire incident types reported to NFIRS in Zip Code 44302
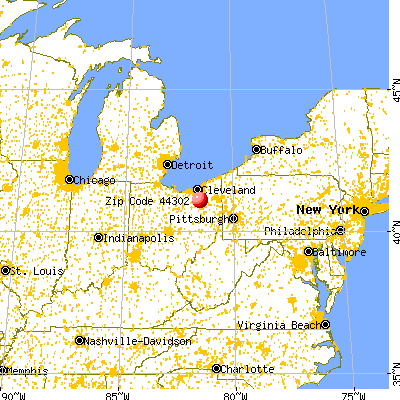


 Nearest zip codes: 44303, 44307, 44308, 44311, 44304, 44320.
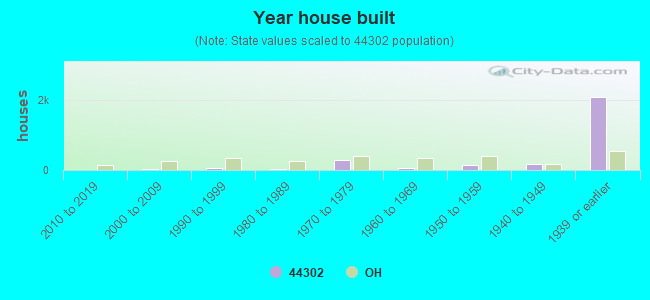


 Based on the data from the years 2003 - 2018 the average number of fire incidents per year is 28. The highest number of reported fire incidents - 45 took place in 2003, and the least - 15 in 2015. The data has a dropping trend.
 When looking into fire subcategories, the most reports belonged to: Structure Fires (51.6%), and Outside Fires (22.0%).