Estimated zip code population in 2022: 17,757
Zip code population in 2010: 19,937
Zip code population in 2000: 22,951
Houses and condos: 9,547
Renter-occupied apartments: 4,126
% of renters here:
47%State:
33%
March 2022 cost of living index in zip code 44320: 95.7
(near average, U.S. average is 100)
Land area: 9.8
sq. mi.
Water area: 0.1
sq. mi.
Population density: 1,821 people per square mile (low).
OSM Map
General Map
Google Map
MSN Map
OSM Map
General Map
Google Map
MSN Map
OSM Map
General Map
Google Map
MSN Map
OSM Map
General Map
Google Map
MSN Map
Please wait while loading the map...
Real estate property taxes paid for housing units in 2022:
This zip code:
1.7% ($1,744)Ohio:
1.3% ($2,639)
Median real estate property taxes paid for housing units with mortgages in 2022: $2,032 (1.8%)
Median real estate property taxes paid for housing units with no mortgage in 2022: $1,515 (1.6%)
Profiles of local businesses
Business Search - 14 Million verified businesses
Males: 8,056 Females: 9,699
For population 25 years and over in 44320:
High school or higher: 90.4%Bachelor's degree or higher: 20.1%Graduate or professional degree: 7.1%Unemployed: 3.8%Mean travel time to work (commute): 21.2 minutes
For population 15 years and over in 44320:
Never married: 41.2%Now married: 32.0%Separated: 4.8%Widowed: 7.2%Divorced: 14.8%
Zip code 44320 compared to state average:
Median household income below state average. Median house value below state average. Black race population percentage significantly above state average. Foreign-born population percentage below state average. Length of stay since moving in significantly above state average. Percentage of population with a bachelor's degree or higher below state average. 11,528 64.9% Black 4,678 26.3% White 912 5.1% Two or more races 505 2.8% Hispanic or Latino 112 0.6% Asian 19 0.1% American Indian
Data:
Median household income ($)
Median household income (% change since 2000)
Household income diversity
Ratio of average income to average house value (%)
Ratio of average income to average rent
Median household income ($) - White
Median household income ($) - Black or African American
Median household income ($) - Asian
Median household income ($) - Hispanic or Latino
Median household income ($) - American Indian and Alaska Native
Median household income ($) - Multirace
Median household income ($) - Other Race
Median household income for houses/condos with a mortgage ($)
Median household income for apartments without a mortgage ($)
Races - White alone (%)
Races - White alone (% change since 2000)
Races - Black alone (%)
Races - Black alone (% change since 2000)
Races - American Indian alone (%)
Races - American Indian alone (% change since 2000)
Races - Asian alone (%)
Races - Asian alone (% change since 2000)
Races - Hispanic (%)
Races - Hispanic (% change since 2000)
Races - Native Hawaiian and Other Pacific Islander alone (%)
Races - Native Hawaiian and Other Pacific Islander alone (% change since 2000)
Races - Two or more races (%)
Races - Two or more races (% change since 2000)
Races - Other race alone (%)
Races - Other race alone (% change since 2000)
Racial diversity
Unemployment (%)
Unemployment (% change since 2000)
Unemployment (%) - White
Unemployment (%) - Black or African American
Unemployment (%) - Asian
Unemployment (%) - Hispanic or Latino
Unemployment (%) - American Indian and Alaska Native
Unemployment (%) - Multirace
Unemployment (%) - Other Race
Population density (people per square mile)
Population - Males (%)
Population - Females (%)
Population - Males (%) - White
Population - Males (%) - Black or African American
Population - Males (%) - Asian
Population - Males (%) - Hispanic or Latino
Population - Males (%) - American Indian and Alaska Native
Population - Males (%) - Multirace
Population - Males (%) - Other Race
Population - Females (%) - White
Population - Females (%) - Black or African American
Population - Females (%) - Asian
Population - Females (%) - Hispanic or Latino
Population - Females (%) - American Indian and Alaska Native
Population - Females (%) - Multirace
Population - Females (%) - Other Race
Coronavirus confirmed cases (Apr 27, 2024)
Deaths caused by coronavirus (Apr 27, 2024)
Coronavirus confirmed cases (per 100k population) (Apr 27, 2024)
Deaths caused by coronavirus (per 100k population) (Apr 27, 2024)
Daily increase in number of cases (Apr 27, 2024)
Weekly increase in number of cases (Apr 27, 2024)
Cases doubled (in days) (Apr 27, 2024)
Hospitalized patients (Apr 18, 2022)
Negative test results (Apr 18, 2022)
Total test results (Apr 18, 2022)
COVID Vaccine doses distributed (per 100k population) (Sep 19, 2023)
COVID Vaccine doses administered (per 100k population) (Sep 19, 2023)
COVID Vaccine doses distributed (Sep 19, 2023)
COVID Vaccine doses administered (Sep 19, 2023)
Likely homosexual households (%)
Likely homosexual households (% change since 2000)
Likely homosexual households - Lesbian couples (%)
Likely homosexual households - Lesbian couples (% change since 2000)
Likely homosexual households - Gay men (%)
Likely homosexual households - Gay men (% change since 2000)
Cost of living index
Median gross rent ($)
Median contract rent ($)
Median monthly housing costs ($)
Median house or condo value ($)
Median house or condo value ($ change since 2000)
Mean house or condo value by units in structure - 1, detached ($)
Mean house or condo value by units in structure - 1, attached ($)
Mean house or condo value by units in structure - 2 ($)
Mean house or condo value by units in structure by units in structure - 3 or 4 ($)
Mean house or condo value by units in structure - 5 or more ($)
Mean house or condo value by units in structure - Boat, RV, van, etc. ($)
Mean house or condo value by units in structure - Mobile home ($)
Median house or condo value ($) - White
Median house or condo value ($) - Black or African American
Median house or condo value ($) - Asian
Median house or condo value ($) - Hispanic or Latino
Median house or condo value ($) - American Indian and Alaska Native
Median house or condo value ($) - Multirace
Median house or condo value ($) - Other Race
Median resident age
Resident age diversity
Median resident age - Males
Median resident age - Females
Median resident age - White
Median resident age - Black or African American
Median resident age - Asian
Median resident age - Hispanic or Latino
Median resident age - American Indian and Alaska Native
Median resident age - Multirace
Median resident age - Other Race
Median resident age - Males - White
Median resident age - Males - Black or African American
Median resident age - Males - Asian
Median resident age - Males - Hispanic or Latino
Median resident age - Males - American Indian and Alaska Native
Median resident age - Males - Multirace
Median resident age - Males - Other Race
Median resident age - Females - White
Median resident age - Females - Black or African American
Median resident age - Females - Asian
Median resident age - Females - Hispanic or Latino
Median resident age - Females - American Indian and Alaska Native
Median resident age - Females - Multirace
Median resident age - Females - Other Race
Commute - mean travel time to work (minutes)
Travel time to work - Less than 5 minutes (%)
Travel time to work - Less than 5 minutes (% change since 2000)
Travel time to work - 5 to 9 minutes (%)
Travel time to work - 5 to 9 minutes (% change since 2000)
Travel time to work - 10 to 19 minutes (%)
Travel time to work - 10 to 19 minutes (% change since 2000)
Travel time to work - 20 to 29 minutes (%)
Travel time to work - 20 to 29 minutes (% change since 2000)
Travel time to work - 30 to 39 minutes (%)
Travel time to work - 30 to 39 minutes (% change since 2000)
Travel time to work - 40 to 59 minutes (%)
Travel time to work - 40 to 59 minutes (% change since 2000)
Travel time to work - 60 to 89 minutes (%)
Travel time to work - 60 to 89 minutes (% change since 2000)
Travel time to work - 90 or more minutes (%)
Travel time to work - 90 or more minutes (% change since 2000)
Marital status - Never married (%)
Marital status - Now married (%)
Marital status - Separated (%)
Marital status - Widowed (%)
Marital status - Divorced (%)
Median family income ($)
Median family income (% change since 2000)
Median non-family income ($)
Median non-family income (% change since 2000)
Median per capita income ($)
Median per capita income (% change since 2000)
Median family income ($) - White
Median family income ($) - Black or African American
Median family income ($) - Asian
Median family income ($) - Hispanic or Latino
Median family income ($) - American Indian and Alaska Native
Median family income ($) - Multirace
Median family income ($) - Other Race
Median year house/condo built
Median year apartment built
Year house built - Built 2005 or later (%)
Year house built - Built 2000 to 2004 (%)
Year house built - Built 1990 to 1999 (%)
Year house built - Built 1980 to 1989 (%)
Year house built - Built 1970 to 1979 (%)
Year house built - Built 1960 to 1969 (%)
Year house built - Built 1950 to 1959 (%)
Year house built - Built 1940 to 1949 (%)
Year house built - Built 1939 or earlier (%)
Average household size
Household density (households per square mile)
Average household size - White
Average household size - Black or African American
Average household size - Asian
Average household size - Hispanic or Latino
Average household size - American Indian and Alaska Native
Average household size - Multirace
Average household size - Other Race
Occupied housing units (%)
Vacant housing units (%)
Owner occupied housing units (%)
Renter occupied housing units (%)
Vacancy status - For rent (%)
Vacancy status - For sale only (%)
Vacancy status - Rented or sold, not occupied (%)
Vacancy status - For seasonal, recreational, or occasional use (%)
Vacancy status - For migrant workers (%)
Vacancy status - Other vacant (%)
Residents with income below the poverty level (%)
Residents with income below 50% of the poverty level (%)
Children below poverty level (%)
Poor families by family type - Married-couple family (%)
Poor families by family type - Male, no wife present (%)
Poor families by family type - Female, no husband present (%)
Poverty status for native-born residents (%)
Poverty status for foreign-born residents (%)
Poverty among high school graduates not in families (%)
Poverty among people who did not graduate high school not in families (%)
Residents with income below the poverty level (%) - White
Residents with income below the poverty level (%) - Black or African American
Residents with income below the poverty level (%) - Asian
Residents with income below the poverty level (%) - Hispanic or Latino
Residents with income below the poverty level (%) - American Indian and Alaska Native
Residents with income below the poverty level (%) - Multirace
Residents with income below the poverty level (%) - Other Race
Air pollution - Air Quality Index (AQI)
Air pollution - CO
Air pollution - NO2
Air pollution - SO2
Air pollution - Ozone
Air pollution - PM10
Air pollution - PM25
Air pollution - Pb
Crime - Murders per 100,000 population
Crime - Rapes per 100,000 population
Crime - Robberies per 100,000 population
Crime - Assaults per 100,000 population
Crime - Burglaries per 100,000 population
Crime - Thefts per 100,000 population
Crime - Auto thefts per 100,000 population
Crime - Arson per 100,000 population
Crime - City-data.com crime index
Crime - Violent crime index
Crime - Property crime index
Crime - Murders per 100,000 population (5 year average)
Crime - Rapes per 100,000 population (5 year average)
Crime - Robberies per 100,000 population (5 year average)
Crime - Assaults per 100,000 population (5 year average)
Crime - Burglaries per 100,000 population (5 year average)
Crime - Thefts per 100,000 population (5 year average)
Crime - Auto thefts per 100,000 population (5 year average)
Crime - Arson per 100,000 population (5 year average)
Crime - City-data.com crime index (5 year average)
Crime - Violent crime index (5 year average)
Crime - Property crime index (5 year average)
1996 Presidential Elections Results (%) - Democratic Party (Clinton)
1996 Presidential Elections Results (%) - Republican Party (Dole)
1996 Presidential Elections Results (%) - Other
2000 Presidential Elections Results (%) - Democratic Party (Gore)
2000 Presidential Elections Results (%) - Republican Party (Bush)
2000 Presidential Elections Results (%) - Other
2004 Presidential Elections Results (%) - Democratic Party (Kerry)
2004 Presidential Elections Results (%) - Republican Party (Bush)
2004 Presidential Elections Results (%) - Other
2008 Presidential Elections Results (%) - Democratic Party (Obama)
2008 Presidential Elections Results (%) - Republican Party (McCain)
2008 Presidential Elections Results (%) - Other
2012 Presidential Elections Results (%) - Democratic Party (Obama)
2012 Presidential Elections Results (%) - Republican Party (Romney)
2012 Presidential Elections Results (%) - Other
2016 Presidential Elections Results (%) - Democratic Party (Clinton)
2016 Presidential Elections Results (%) - Republican Party (Trump)
2016 Presidential Elections Results (%) - Other
2020 Presidential Elections Results (%) - Democratic Party (Biden)
2020 Presidential Elections Results (%) - Republican Party (Trump)
2020 Presidential Elections Results (%) - Other
Ancestries Reported - Arab (%)
Ancestries Reported - Czech (%)
Ancestries Reported - Danish (%)
Ancestries Reported - Dutch (%)
Ancestries Reported - English (%)
Ancestries Reported - French (%)
Ancestries Reported - French Canadian (%)
Ancestries Reported - German (%)
Ancestries Reported - Greek (%)
Ancestries Reported - Hungarian (%)
Ancestries Reported - Irish (%)
Ancestries Reported - Italian (%)
Ancestries Reported - Lithuanian (%)
Ancestries Reported - Norwegian (%)
Ancestries Reported - Polish (%)
Ancestries Reported - Portuguese (%)
Ancestries Reported - Russian (%)
Ancestries Reported - Scotch-Irish (%)
Ancestries Reported - Scottish (%)
Ancestries Reported - Slovak (%)
Ancestries Reported - Subsaharan African (%)
Ancestries Reported - Swedish (%)
Ancestries Reported - Swiss (%)
Ancestries Reported - Ukrainian (%)
Ancestries Reported - United States (%)
Ancestries Reported - Welsh (%)
Ancestries Reported - West Indian (%)
Ancestries Reported - Other (%)
Educational Attainment - No schooling completed (%)
Educational Attainment - Less than high school (%)
Educational Attainment - High school or equivalent (%)
Educational Attainment - Less than 1 year of college (%)
Educational Attainment - 1 or more years of college (%)
Educational Attainment - Associate degree (%)
Educational Attainment - Bachelor's degree (%)
Educational Attainment - Master's degree (%)
Educational Attainment - Professional school degree (%)
Educational Attainment - Doctorate degree (%)
School Enrollment - Nursery, preschool (%)
School Enrollment - Kindergarten (%)
School Enrollment - Grade 1 to 4 (%)
School Enrollment - Grade 5 to 8 (%)
School Enrollment - Grade 9 to 12 (%)
School Enrollment - College undergrad (%)
School Enrollment - Graduate or professional (%)
School Enrollment - Not enrolled in school (%)
School enrollment - Public schools (%)
School enrollment - Private schools (%)
School enrollment - Not enrolled (%)
Median number of rooms in houses and condos
Median number of rooms in apartments
Housing units lacking complete plumbing facilities (%)
Housing units lacking complete kitchen facilities (%)
Density of houses
Urban houses (%)
Rural houses (%)
Households with people 60 years and over (%)
Households with people 65 years and over (%)
Households with people 75 years and over (%)
Households with one or more nonrelatives (%)
Households with no nonrelatives (%)
Population in households (%)
Family households (%)
Nonfamily households (%)
Population in families (%)
Family households with own children (%)
Median number of bedrooms in owner occupied houses
Mean number of bedrooms in owner occupied houses
Median number of bedrooms in renter occupied houses
Mean number of bedrooms in renter occupied houses
Median number of vehichles in owner occupied houses
Mean number of vehichles in owner occupied houses
Median number of vehichles in renter occupied houses
Mean number of vehichles in renter occupied houses
Mortgage status - with mortgage (%)
Mortgage status - with second mortgage (%)
Mortgage status - with home equity loan (%)
Mortgage status - with both second mortgage and home equity loan (%)
Mortgage status - without a mortgage (%)
Average family size
Average family size - White
Average family size - Black or African American
Average family size - Asian
Average family size - Hispanic or Latino
Average family size - American Indian and Alaska Native
Average family size - Multirace
Average family size - Other Race
Geographical mobility - Same house 1 year ago (%)
Geographical mobility - Moved within same county (%)
Geographical mobility - Moved from different county within same state (%)
Geographical mobility - Moved from different state (%)
Geographical mobility - Moved from abroad (%)
Place of birth - Born in state of residence (%)
Place of birth - Born in other state (%)
Place of birth - Native, outside of US (%)
Place of birth - Foreign born (%)
Housing units in structures - 1, detached (%)
Housing units in structures - 1, attached (%)
Housing units in structures - 2 (%)
Housing units in structures - 3 or 4 (%)
Housing units in structures - 5 to 9 (%)
Housing units in structures - 10 to 19 (%)
Housing units in structures - 20 to 49 (%)
Housing units in structures - 50 or more (%)
Housing units in structures - Mobile home (%)
Housing units in structures - Boat, RV, van, etc. (%)
House/condo owner moved in on average (years ago)
Renter moved in on average (years ago)
Year householder moved into unit - Moved in 1999 to March 2000 (%)
Year householder moved into unit - Moved in 1995 to 1998 (%)
Year householder moved into unit - Moved in 1990 to 1994 (%)
Year householder moved into unit - Moved in 1980 to 1989 (%)
Year householder moved into unit - Moved in 1970 to 1979 (%)
Year householder moved into unit - Moved in 1969 or earlier (%)
Means of transportation to work - Drove car alone (%)
Means of transportation to work - Carpooled (%)
Means of transportation to work - Public transportation (%)
Means of transportation to work - Bus or trolley bus (%)
Means of transportation to work - Streetcar or trolley car (%)
Means of transportation to work - Subway or elevated (%)
Means of transportation to work - Railroad (%)
Means of transportation to work - Ferryboat (%)
Means of transportation to work - Taxicab (%)
Means of transportation to work - Motorcycle (%)
Means of transportation to work - Bicycle (%)
Means of transportation to work - Walked (%)
Means of transportation to work - Other means (%)
Working at home (%)
Industry diversity
Most Common Industries - Agriculture, forestry, fishing and hunting, and mining (%)
Most Common Industries - Agriculture, forestry, fishing and hunting (%)
Most Common Industries - Mining, quarrying, and oil and gas extraction (%)
Most Common Industries - Construction (%)
Most Common Industries - Manufacturing (%)
Most Common Industries - Wholesale trade (%)
Most Common Industries - Retail trade (%)
Most Common Industries - Transportation and warehousing, and utilities (%)
Most Common Industries - Transportation and warehousing (%)
Most Common Industries - Utilities (%)
Most Common Industries - Information (%)
Most Common Industries - Finance and insurance, and real estate and rental and leasing (%)
Most Common Industries - Finance and insurance (%)
Most Common Industries - Real estate and rental and leasing (%)
Most Common Industries - Professional, scientific, and management, and administrative and waste management services (%)
Most Common Industries - Professional, scientific, and technical services (%)
Most Common Industries - Management of companies and enterprises (%)
Most Common Industries - Administrative and support and waste management services (%)
Most Common Industries - Educational services, and health care and social assistance (%)
Most Common Industries - Educational services (%)
Most Common Industries - Health care and social assistance (%)
Most Common Industries - Arts, entertainment, and recreation, and accommodation and food services (%)
Most Common Industries - Arts, entertainment, and recreation (%)
Most Common Industries - Accommodation and food services (%)
Most Common Industries - Other services, except public administration (%)
Most Common Industries - Public administration (%)
Occupation diversity
Most Common Occupations - Management, business, science, and arts occupations (%)
Most Common Occupations - Management, business, and financial occupations (%)
Most Common Occupations - Management occupations (%)
Most Common Occupations - Business and financial operations occupations (%)
Most Common Occupations - Computer, engineering, and science occupations (%)
Most Common Occupations - Computer and mathematical occupations (%)
Most Common Occupations - Architecture and engineering occupations (%)
Most Common Occupations - Life, physical, and social science occupations (%)
Most Common Occupations - Education, legal, community service, arts, and media occupations (%)
Most Common Occupations - Community and social service occupations (%)
Most Common Occupations - Legal occupations (%)
Most Common Occupations - Education, training, and library occupations (%)
Most Common Occupations - Arts, design, entertainment, sports, and media occupations (%)
Most Common Occupations - Healthcare practitioners and technical occupations (%)
Most Common Occupations - Health diagnosing and treating practitioners and other technical occupations (%)
Most Common Occupations - Health technologists and technicians (%)
Most Common Occupations - Service occupations (%)
Most Common Occupations - Healthcare support occupations (%)
Most Common Occupations - Protective service occupations (%)
Most Common Occupations - Fire fighting and prevention, and other protective service workers including supervisors (%)
Most Common Occupations - Law enforcement workers including supervisors (%)
Most Common Occupations - Food preparation and serving related occupations (%)
Most Common Occupations - Building and grounds cleaning and maintenance occupations (%)
Most Common Occupations - Personal care and service occupations (%)
Most Common Occupations - Sales and office occupations (%)
Most Common Occupations - Sales and related occupations (%)
Most Common Occupations - Office and administrative support occupations (%)
Most Common Occupations - Natural resources, construction, and maintenance occupations (%)
Most Common Occupations - Farming, fishing, and forestry occupations (%)
Most Common Occupations - Construction and extraction occupations (%)
Most Common Occupations - Installation, maintenance, and repair occupations (%)
Most Common Occupations - Production, transportation, and material moving occupations (%)
Most Common Occupations - Production occupations (%)
Most Common Occupations - Transportation occupations (%)
Most Common Occupations - Material moving occupations (%)
People in Group quarters - Institutionalized population (%)
People in Group quarters - Correctional institutions (%)
People in Group quarters - Federal prisons and detention centers (%)
People in Group quarters - Halfway houses (%)
People in Group quarters - Local jails and other confinement facilities (including police lockups) (%)
People in Group quarters - Military disciplinary barracks (%)
People in Group quarters - State prisons (%)
People in Group quarters - Other types of correctional institutions (%)
People in Group quarters - Nursing homes (%)
People in Group quarters - Hospitals/wards, hospices, and schools for the handicapped (%)
People in Group quarters - Hospitals/wards and hospices for chronically ill (%)
People in Group quarters - Hospices or homes for chronically ill (%)
People in Group quarters - Military hospitals or wards for chronically ill (%)
People in Group quarters - Other hospitals or wards for chronically ill (%)
People in Group quarters - Hospitals or wards for drug/alcohol abuse (%)
People in Group quarters - Mental (Psychiatric) hospitals or wards (%)
People in Group quarters - Schools, hospitals, or wards for the mentally retarded (%)
People in Group quarters - Schools, hospitals, or wards for the physically handicapped (%)
People in Group quarters - Institutions for the deaf (%)
People in Group quarters - Institutions for the blind (%)
People in Group quarters - Orthopedic wards and institutions for the physically handicapped (%)
People in Group quarters - Wards in general hospitals for patients who have no usual home elsewhere (%)
People in Group quarters - Wards in military hospitals for patients who have no usual home elsewhere (%)
People in Group quarters - Juvenile institutions (%)
People in Group quarters - Long-term care (%)
People in Group quarters - Homes for abused, dependent, and neglected children (%)
People in Group quarters - Residential treatment centers for emotionally disturbed children (%)
People in Group quarters - Training schools for juvenile delinquents (%)
People in Group quarters - Short-term care, detention or diagnostic centers for delinquent children (%)
People in Group quarters - Type of juvenile institution unknown (%)
People in Group quarters - Noninstitutionalized population (%)
People in Group quarters - College dormitories (includes college quarters off campus) (%)
People in Group quarters - Military quarters (%)
People in Group quarters - On base (%)
People in Group quarters - Barracks, unaccompanied personnel housing (UPH), (Enlisted/Officer), ;and similar group living quarters for military personnel (%)
People in Group quarters - Transient quarters for temporary residents (%)
People in Group quarters - Military ships (%)
People in Group quarters - Group homes (%)
People in Group quarters - Homes or halfway houses for drug/alcohol abuse (%)
People in Group quarters - Homes for the mentally ill (%)
People in Group quarters - Homes for the mentally retarded (%)
People in Group quarters - Homes for the physically handicapped (%)
People in Group quarters - Other group homes (%)
People in Group quarters - Religious group quarters (%)
People in Group quarters - Dormitories (%)
People in Group quarters - Agriculture workers' dormitories on farms (%)
People in Group quarters - Job Corps and vocational training facilities (%)
People in Group quarters - Other workers' dormitories (%)
People in Group quarters - Crews of maritime vessels (%)
People in Group quarters - Other nonhousehold living situations (%)
People in Group quarters - Other noninstitutional group quarters (%)
Residents speaking English at home (%)
Residents speaking English at home - Born in the United States (%)
Residents speaking English at home - Native, born elsewhere (%)
Residents speaking English at home - Foreign born (%)
Residents speaking Spanish at home (%)
Residents speaking Spanish at home - Born in the United States (%)
Residents speaking Spanish at home - Native, born elsewhere (%)
Residents speaking Spanish at home - Foreign born (%)
Residents speaking other language at home (%)
Residents speaking other language at home - Born in the United States (%)
Residents speaking other language at home - Native, born elsewhere (%)
Residents speaking other language at home - Foreign born (%)
Class of Workers - Employee of private company (%)
Class of Workers - Self-employed in own incorporated business (%)
Class of Workers - Private not-for-profit wage and salary workers (%)
Class of Workers - Local government workers (%)
Class of Workers - State government workers (%)
Class of Workers - Federal government workers (%)
Class of Workers - Self-employed workers in own not incorporated business and Unpaid family workers (%)
House heating fuel used in houses and condos - Utility gas (%)
House heating fuel used in houses and condos - Bottled, tank, or LP gas (%)
House heating fuel used in houses and condos - Electricity (%)
House heating fuel used in houses and condos - Fuel oil, kerosene, etc. (%)
House heating fuel used in houses and condos - Coal or coke (%)
House heating fuel used in houses and condos - Wood (%)
House heating fuel used in houses and condos - Solar energy (%)
House heating fuel used in houses and condos - Other fuel (%)
House heating fuel used in houses and condos - No fuel used (%)
House heating fuel used in apartments - Utility gas (%)
House heating fuel used in apartments - Bottled, tank, or LP gas (%)
House heating fuel used in apartments - Electricity (%)
House heating fuel used in apartments - Fuel oil, kerosene, etc. (%)
House heating fuel used in apartments - Coal or coke (%)
House heating fuel used in apartments - Wood (%)
House heating fuel used in apartments - Solar energy (%)
House heating fuel used in apartments - Other fuel (%)
House heating fuel used in apartments - No fuel used (%)
Armed forces status - In Armed Forces (%)
Armed forces status - Civilian (%)
Armed forces status - Civilian - Veteran (%)
Armed forces status - Civilian - Nonveteran (%)
Fatal accidents locations in years 2005-2021
Fatal accidents locations in 2005
Fatal accidents locations in 2006
Fatal accidents locations in 2007
Fatal accidents locations in 2008
Fatal accidents locations in 2009
Fatal accidents locations in 2010
Fatal accidents locations in 2011
Fatal accidents locations in 2012
Fatal accidents locations in 2013
Fatal accidents locations in 2014
Fatal accidents locations in 2015
Fatal accidents locations in 2016
Fatal accidents locations in 2017
Fatal accidents locations in 2018
Fatal accidents locations in 2019
Fatal accidents locations in 2020
Fatal accidents locations in 2021
Alcohol use - People drinking some alcohol every month (%)
Alcohol use - People not drinking at all (%)
Alcohol use - Average days/month drinking alcohol
Alcohol use - Average drinks/week
Alcohol use - Average days/year people drink much
Audiometry - Average condition of hearing (%)
Audiometry - People that can hear a whisper from across a quiet room (%)
Audiometry - People that can hear normal voice from across a quiet room (%)
Audiometry - Ears ringing, roaring, buzzing (%)
Audiometry - Had a job exposure to loud noise (%)
Audiometry - Had off-work exposure to loud noise (%)
Blood Pressure & Cholesterol - Has high blood pressure (%)
Blood Pressure & Cholesterol - Checking blood pressure at home (%)
Blood Pressure & Cholesterol - Frequently checking blood cholesterol (%)
Blood Pressure & Cholesterol - Has high cholesterol level (%)
Consumer Behavior - Money monthly spent on food at supermarket/grocery store
Consumer Behavior - Money monthly spent on food at other stores
Consumer Behavior - Money monthly spent on eating out
Consumer Behavior - Money monthly spent on carryout/delivered foods
Consumer Behavior - Income spent on food at supermarket/grocery store (%)
Consumer Behavior - Income spent on food at other stores (%)
Consumer Behavior - Income spent on eating out (%)
Consumer Behavior - Income spent on carryout/delivered foods (%)
Current Health Status - General health condition (%)
Current Health Status - Blood donors (%)
Current Health Status - Has blood ever tested for HIV virus (%)
Current Health Status - Left-handed people (%)
Dermatology - People using sunscreen (%)
Diabetes - Diabetics (%)
Diabetes - Had a blood test for high blood sugar (%)
Diabetes - People taking insulin (%)
Diet Behavior & Nutrition - Diet health (%)
Diet Behavior & Nutrition - Milk product consumption (# of products/month)
Diet Behavior & Nutrition - Meals not home prepared (#/week)
Diet Behavior & Nutrition - Meals from fast food or pizza place (#/week)
Diet Behavior & Nutrition - Ready-to-eat foods (#/month)
Diet Behavior & Nutrition - Frozen meals/pizza (#/month)
Drug Use - People that ever used marijuana or hashish (%)
Drug Use - Ever used hard drugs (%)
Drug Use - Ever used any form of cocaine (%)
Drug Use - Ever used heroin (%)
Drug Use - Ever used methamphetamine (%)
Health Insurance - People covered by health insurance (%)
Kidney Conditions-Urology - Avg. # of times urinating at night
Medical Conditions - People with asthma (%)
Medical Conditions - People with anemia (%)
Medical Conditions - People with psoriasis (%)
Medical Conditions - People with overweight (%)
Medical Conditions - Elderly people having difficulties in thinking or remembering (%)
Medical Conditions - People who ever received blood transfusion (%)
Medical Conditions - People having trouble seeing even with glass/contacts (%)
Medical Conditions - People with arthritis (%)
Medical Conditions - People with gout (%)
Medical Conditions - People with congestive heart failure (%)
Medical Conditions - People with coronary heart disease (%)
Medical Conditions - People with angina pectoris (%)
Medical Conditions - People who ever had heart attack (%)
Medical Conditions - People who ever had stroke (%)
Medical Conditions - People with emphysema (%)
Medical Conditions - People with thyroid problem (%)
Medical Conditions - People with chronic bronchitis (%)
Medical Conditions - People with any liver condition (%)
Medical Conditions - People who ever had cancer or malignancy (%)
Mental Health - People who have little interest in doing things (%)
Mental Health - People feeling down, depressed, or hopeless (%)
Mental Health - People who have trouble sleeping or sleeping too much (%)
Mental Health - People feeling tired or having little energy (%)
Mental Health - People with poor appetite or overeating (%)
Mental Health - People feeling bad about themself (%)
Mental Health - People who have trouble concentrating on things (%)
Mental Health - People moving or speaking slowly or too fast (%)
Mental Health - People having thoughts they would be better off dead (%)
Oral Health - Average years since last visit a dentist
Oral Health - People embarrassed because of mouth (%)
Oral Health - People with gum disease (%)
Oral Health - General health of teeth and gums (%)
Oral Health - Average days a week using dental floss/device
Oral Health - Average days a week using mouthwash for dental problem
Oral Health - Average number of teeth
Pesticide Use - Households using pesticides to control insects (%)
Pesticide Use - Households using pesticides to kill weeds (%)
Physical Activity - People doing vigorous-intensity work activities (%)
Physical Activity - People doing moderate-intensity work activities (%)
Physical Activity - People walking or bicycling (%)
Physical Activity - People doing vigorous-intensity recreational activities (%)
Physical Activity - People doing moderate-intensity recreational activities (%)
Physical Activity - Average hours a day doing sedentary activities
Physical Activity - Average hours a day watching TV or videos
Physical Activity - Average hours a day using computer
Physical Functioning - People having limitations keeping them from working (%)
Physical Functioning - People limited in amount of work they can do (%)
Physical Functioning - People that need special equipment to walk (%)
Physical Functioning - People experiencing confusion/memory problems (%)
Physical Functioning - People requiring special healthcare equipment (%)
Prescription Medications - Average number of prescription medicines taking
Preventive Aspirin Use - Adults 40+ taking low-dose aspirin (%)
Reproductive Health - Vaginal deliveries (%)
Reproductive Health - Cesarean deliveries (%)
Reproductive Health - Deliveries resulted in a live birth (%)
Reproductive Health - Pregnancies resulted in a delivery (%)
Reproductive Health - Women breastfeeding newborns (%)
Reproductive Health - Women that had a hysterectomy (%)
Reproductive Health - Women that had both ovaries removed (%)
Reproductive Health - Women that have ever taken birth control pills (%)
Reproductive Health - Women taking birth control pills (%)
Reproductive Health - Women that have ever used Depo-Provera or injectables (%)
Reproductive Health - Women that have ever used female hormones (%)
Sexual Behavior - People 18+ that ever had sex (vaginal, anal, or oral) (%)
Sexual Behavior - Males 18+ that ever had vaginal sex with a woman (%)
Sexual Behavior - Males 18+ that ever performed oral sex on a woman (%)
Sexual Behavior - Males 18+ that ever had anal sex with a woman (%)
Sexual Behavior - Males 18+ that ever had any sex with a man (%)
Sexual Behavior - Females 18+ that ever had vaginal sex with a man (%)
Sexual Behavior - Females 18+ that ever performed oral sex on a man (%)
Sexual Behavior - Females 18+ that ever had anal sex with a man (%)
Sexual Behavior - Females 18+ that ever had any kind of sex with a woman (%)
Sexual Behavior - Average age people first had sex
Sexual Behavior - Average number of female sex partners in lifetime (males 18+)
Sexual Behavior - Average number of female vaginal sex partners in lifetime (males 18+)
Sexual Behavior - Average age people first performed oral sex on a woman (18+)
Sexual Behavior - Average number of woman performed oral sex on in lifetime (18+)
Sexual Behavior - Average number of male sex partners in lifetime (males 18+)
Sexual Behavior - Average number of male anal sex partners in lifetime (males 18+)
Sexual Behavior - Average age people first performed oral sex on a man (18+)
Sexual Behavior - Average number of male oral sex partners in lifetime (18+)
Sexual Behavior - People using protection when performing oral sex (%)
Sexual Behavior - Average number of times people have vaginal or anal sex a year
Sexual Behavior - People having sex without condom (%)
Sexual Behavior - Average number of male sex partners in lifetime (females 18+)
Sexual Behavior - Average number of male vaginal sex partners in lifetime (females 18+)
Sexual Behavior - Average number of female sex partners in lifetime (females 18+)
Sexual Behavior - Circumcised males 18+ (%)
Sleep Disorders - Average hours sleeping at night
Sleep Disorders - People that has trouble sleeping (%)
Smoking-Cigarette Use - People smoking cigarettes (%)
Taste & Smell - People 40+ having problems with smell (%)
Taste & Smell - People 40+ having problems with taste (%)
Taste & Smell - People 40+ that ever had wisdom teeth removed (%)
Taste & Smell - People 40+ that ever had tonsils teeth removed (%)
Taste & Smell - People 40+ that ever had a loss of consciousness because of a head injury (%)
Taste & Smell - People 40+ that ever had a broken nose or other serious injury to face or skull (%)
Taste & Smell - People 40+ that ever had two or more sinus infections (%)
Weight - Average height (inches)
Weight - Average weight (pounds)
Weight - Average BMI
Weight - People that are obese (%)
Weight - People that ever were obese (%)
Weight - People trying to lose weight (%)
100%
urban population.
Estimated median house/condo value in 2022: $104,667
44320:
$104,667Ohio:
$204,100
Median resident age: This zip code:
42.5 yearsOhio median age:
39.9 years
Average household size: This zip code:
2.0 peopleOhio:
2.4 people
Averages for the 2020 tax year for zip code 44320, filed in 2021:
Average Adjusted Gross Income (AGI) in 2020: $37,375 (Individual Income Tax Returns) Here:
$37,375State:
$67,288
Salary/wage: $33,085 (reported on 83.0% of returns )Here:
$33,085State:
$55,628
(% of AGI for various income ranges: 1092.8% for AGIs below $25k , 3428.4% for AGIs $25k-50k , 6645.8% for AGIs $50k-75k , 9525.8% for AGIs $75k-100k , 16155.4% for AGIs $100k-200k , 49330.0% for AGIs over 200k ) Taxable interest for individuals: $619 (reported on 11.7% of returns )This zip code:
$619Ohio:
$1,518
(% of AGI for various income ranges: 2.9% for AGIs below $25k , 6.6% for AGIs $25k-50k , 18.5% for AGIs $50k-75k , 25.2% for AGIs $75k-100k , 53.5% for AGIs $100k-200k , 245.0% for AGIs over 200k ) Ordinary dividends: $2,305 (reported on 6.9% of returns )(% of AGI for various income ranges: 2.6% for AGIs below $25k , 11.3% for AGIs $25k-50k , 24.5% for AGIs $50k-75k , 63.9% for AGIs $75k-100k , 196.5% for AGIs $100k-200k , 985.0% for AGIs over 200k ) Net capital gain/loss in AGI: +$5,327 (reported on 5.7% of returns )Here:
+$5,327State:
+$18,919
(% of AGI for various income ranges: 2.0% for AGIs below $25k , 5.9% for AGIs $25k-50k , 28.3% for AGIs $50k-75k , 270.6% for AGIs $75k-100k , 411.2% for AGIs $100k-200k , 2160.0% for AGIs over 200k ) Profit/loss from business: +$4,705 (reported on 14.3% of returns )Here:
+$4,705State:
+$13,744
(% of AGI for various income ranges: 57.5% for AGIs below $25k , 51.9% for AGIs $25k-50k , 111.4% for AGIs $50k-75k , 167.1% for AGIs $75k-100k , 626.9% for AGIs $100k-200k ) Taxable individual retirement arrangement distribution: $12,564 (reported on 5.1% of returns )44320:
$12,564Ohio:
$18,876
(% of AGI for various income ranges: 18.2% for AGIs below $25k , 47.9% for AGIs $25k-50k , 178.5% for AGIs $50k-75k , 312.6% for AGIs $75k-100k , 691.9% for AGIs $100k-200k ) Total itemized deductions: $22,479 (reported on 2.6% of returns )Here:
$22,479State:
$33,869
(% of AGI for various income ranges: 48.4% for AGIs $25k-50k , 159.9% for AGIs $50k-75k , 276.5% for AGIs $75k-100k , 822.3% for AGIs $100k-200k ) Charity contributions: $8,932 (reported on 2.1% of returns )(% of AGI for various income ranges: 11.6% for AGIs $25k-50k , 53.3% for AGIs $50k-75k , 81.9% for AGIs $75k-100k , 288.8% for AGIs $100k-200k ) Taxes paid: $5,925 (reported on 2.6% of returns )(% of AGI for various income ranges: 7.1% for AGIs $25k-50k , 39.6% for AGIs $50k-75k , 89.0% for AGIs $75k-100k , 256.9% for AGIs $100k-200k ) Earned income credit: $2,501 (reported on 28.4% of returns )(% of AGI for various income ranges: 133.8% for AGIs below $25k , 86.6% for AGIs $25k-50k ) Percentage of individuals using paid preparers for their 2020 taxes: 93.3%(% for various income ranges: 93.6% for AGIs below $25k , 94.3% for AGIs $25k-50k , 91.1% for AGIs $50k-75k , 93.9% for AGIs $75k-100k , 88.6% for AGIs $100k-200k , 100.0% for AGIs over 200k )
Averages for the 2012 tax year for zip code 44320, filed in 2013:
Average Adjusted Gross Income (AGI) in 2012: $31,759 (Individual Income Tax Returns) Here:
$31,759State:
$54,926
Salary/wage: $28,805 (reported on 85.1% of returns )Here:
$28,805State:
$45,869
(% of AGI for various income ranges: 74.3% for AGIs below $25k , 78.4% for AGIs $25k-50k , 77.2% for AGIs $50k-75k , 76.5% for AGIs $75k-100k , 80.0% for AGIs $100k-200k , 75.2% for AGIs over 200k ) Taxable interest for individuals: $493 (reported on 15.0% of returns )This zip code:
$493Ohio:
$1,297
(% of AGI for various income ranges: 0.4% for AGIs below $25k , 0.2% for AGIs $25k-50k , 0.3% for AGIs $50k-75k , 0.1% for AGIs $75k-100k , 0.2% for AGIs $100k-200k ) Ordinary dividends: $2,474 (reported on 7.1% of returns )(% of AGI for various income ranges: 0.3% for AGIs below $25k , 0.3% for AGIs $25k-50k , 0.4% for AGIs $50k-75k , 0.6% for AGIs $75k-100k , 1.6% for AGIs $100k-200k ) Net capital gain/loss in AGI: +$1,959 (reported on 4.3% of returns )Here:
+$1,959State:
+$11,232
(% of AGI for various income ranges: 0.1% for AGIs $25k-50k , 0.1% for AGIs $50k-75k , 0.5% for AGIs $75k-100k , 1.1% for AGIs $100k-200k ) Profit/loss from business: +$6,340 (reported on 13.8% of returns )Here:
+$6,340State:
+$12,773
(% of AGI for various income ranges: 8.9% for AGIs below $25k , 1.0% for AGIs $25k-50k , 1.0% for AGIs $50k-75k , 0.7% for AGIs $75k-100k , 1.8% for AGIs $100k-200k ) Taxable individual retirement arrangement distribution: $10,915 (reported on 5.9% of returns )44320:
$10,915Ohio:
$14,511
(% of AGI for various income ranges: 1.2% for AGIs below $25k , 1.5% for AGIs $25k-50k , 2.0% for AGIs $50k-75k , 3.4% for AGIs $75k-100k , 3.5% for AGIs $100k-200k ) Total itemized deductions: $15,067 (23% of AGI, reported on 20.0% of returns )Here:
$15,067State:
$21,278
Here:
23.5% of AGIState:
18.8% of AGI
(% of AGI for various income ranges: 4.3% for AGIs below $25k , 8.1% for AGIs $25k-50k , 12.1% for AGIs $50k-75k , 13.5% for AGIs $75k-100k , 13.2% for AGIs $100k-200k , 10.0% for AGIs over 200k ) Charity contributions: $3,411 (reported on 16.2% of returns )(% of AGI for various income ranges: 0.6% for AGIs below $25k , 1.4% for AGIs $25k-50k , 2.4% for AGIs $50k-75k , 2.9% for AGIs $75k-100k , 2.5% for AGIs $100k-200k , 1.1% for AGIs over 200k ) Taxes paid: $5,249 (reported on 19.9% of returns )(% of AGI for various income ranges: 0.9% for AGIs below $25k , 2.2% for AGIs $25k-50k , 4.0% for AGIs $50k-75k , 5.1% for AGIs $75k-100k , 6.3% for AGIs $100k-200k , 6.6% for AGIs over 200k ) Earned income credit: $2,499 (reported on 33.7% of returns )(% of AGI for various income ranges: 10.5% for AGIs below $25k , 1.4% for AGIs $25k-50k ) Percentage of individuals using paid preparers for their 2012 taxes: 45.1%(% for various income ranges: 42.7% for AGIs below $25k , 45.2% for AGIs $25k-50k , 52.0% for AGIs $50k-75k , 52.5% for AGIs $75k-100k , 53.1% for AGIs $100k-200k , 0.0% for AGIs over 200k )
Averages for the 2004 tax year for zip code 44320, filed in 2005:
Average Adjusted Gross Income (AGI) in 2004: $29,198 (Individual Income Tax Returns) Here:
$29,198State:
$44,480
Salary/wage: $27,384 (reported on 89.2% of returns )Here:
$27,384State:
$39,198
(% of AGI for various income ranges: 91.5% for AGIs below $10k , 82.1% for AGIs $10k-25k , 84.9% for AGIs $25k-50k , 85.2% for AGIs $50k-75k , 86.6% for AGIs $75k-100k , 71.3% for AGIs over 100k ) Taxable interest for individuals: $829 (reported on 23.3% of returns )This zip code:
$829Ohio:
$1,532
(% of AGI for various income ranges: 1.2% for AGIs below $10k , 0.7% for AGIs $10k-25k , 0.6% for AGIs $25k-50k , 0.6% for AGIs $50k-75k , 0.3% for AGIs $75k-100k , 1.2% for AGIs over 100k ) Taxable dividends: $1,555 (reported on 10.1% of returns )(% of AGI for various income ranges: 0.8% for AGIs below $10k , 0.3% for AGIs $10k-25k , 0.4% for AGIs $25k-50k , 0.6% for AGIs $50k-75k , 0.2% for AGIs $75k-100k , 1.8% for AGIs over 100k ) Net capital gain/loss: +$2,977 (reported on 6.6% of returns )Here:
+$2,977State:
+$8,582
(% of AGI for various income ranges: -0.2% for AGIs below $10k , 0.2% for AGIs $10k-25k , 0.1% for AGIs $25k-50k , 0.4% for AGIs $50k-75k , 0.2% for AGIs $75k-100k , 5.7% for AGIs over 100k ) Profit/loss from business: +$5,453 (reported on 9.8% of returns )Here:
+$5,453State:
+$10,813
(% of AGI for various income ranges: 6.2% for AGIs below $10k , 3.5% for AGIs $10k-25k , 0.8% for AGIs $25k-50k , 0.8% for AGIs $50k-75k , 1.2% for AGIs $75k-100k , 4.1% for AGIs over 100k ) IRA payment deduction: $2,385 (reported on 1.0% of returns )(% of AGI for various income ranges: 0.1% for AGIs $10k-25k , 0.1% for AGIs $25k-50k , 0.1% for AGIs $50k-75k , 0.2% for AGIs $75k-100k ) Self-employed pension: $3,200 (reported on 0.1% of returns )Total itemized deductions: $13,562 (26% of AGI, reported on 27.5% of returns )Here:
$13,562State:
$17,503
Here:
25.6% of AGIState:
20.8% of AGI
(% of AGI for various income ranges: 3.9% for AGIs below $10k , 6.6% for AGIs $10k-25k , 12.8% for AGIs $25k-50k , 16.0% for AGIs $50k-75k , 17.0% for AGIs $75k-100k , 15.9% for AGIs over 100k ) Charity contributions deductions: $2,896 (5% of AGI, reported on 23.4% of returns )Here:
5.3% of AGIState:
3.4% of AGI
(% of AGI for various income ranges: 0.3% for AGIs below $10k , 1.1% for AGIs $10k-25k , 2.1% for AGIs $25k-50k , 3.0% for AGIs $50k-75k , 3.3% for AGIs $75k-100k , 3.7% for AGIs over 100k ) Total tax: $3,366 (reported on 65.1% of returns )(% of AGI for various income ranges: 1.6% for AGIs below $10k , 3.3% for AGIs $10k-25k , 6.5% for AGIs $25k-50k , 9.3% for AGIs $50k-75k , 10.3% for AGIs $75k-100k , 14.9% for AGIs over 100k ) Earned income credit: $1,895 (reported on 29.8% of returns )Percentage of individuals using paid preparers for their 2004 taxes: 57.2%(% for various income ranges: 54.5% for AGIs below $10k , 60.3% for AGIs $10k-25k , 56.3% for AGIs $25k-50k , 58.8% for AGIs $50k-75k , 54.6% for AGIs $75k-100k , 50.8% for AGIs over 100k )
Estimated median household income in 2022: This zip code:
$35,781Ohio:
$65,720
Nearest zip codes: 44307 ,
44314 ,
44302 ,
44303 ,
44313 ,
44311 .
Norton Zip Code Map
Percentage of family households: This zip code:
36.5%Ohio:
43.3%
Percentage of households with unmarried partners: This zip code:
5.5%Ohio:
44.6%
Likely homosexual households (counted as self-reported same-sex unmarried-partner households)
Lesbian couples: 0.4% of all households Gay men: 0.0% of all households
Household received Food Stamps/SNAP in the past 12 months: 3,275Household did not receive Food Stamps/SNAP in the past 12 months: 5,521
Women who had a birth in the past 12 months: 193 (16 now married , 170 unmarried) Women who did not have a birth in the past 12 months: 3,616 (1,106 now married , 2,511 unmarried)
Housing units in zip code 44320 with a mortgage: 2,721 (181
second mortgage , 105
both second mortgage and home equity loan )
Houses without a mortgage: 148
Median monthly owner costs for units with a mortgage: $1,050
Median monthly owner costs for units without a mortgage: $449
Residents with income below the poverty level in 2022:
This zip code:
25.8%Whole state:
13.4%
Residents with income below 50% of the poverty level in 2022:
This zip code:
13.1%Whole state:
7.0%
Median number of rooms in houses and condos: Median number of rooms in apartments: Notable locations in this zip code not listed on our city pages
Click to draw/clear zip code borders Notable locations in zip code 44320: (A) , Watkins Academy Museum of the Cultural Arts (B) , Maple Valley Branch Library (C) , Polymer Science Building (D) . Display/hide their locations on the map
Shopping Centers: (1) , Hawkins Plaza Shopping Center (2) , Rolling Acres Mall Shopping Center (3) , Roming Square Shopping Center (4) , Fretter Plaza Shopping Center (5) , Akron Promenade Shopping Center (6) . Display/hide their locations on the map
Churches in zip code 44320 include: (A) , Calvary Church (B) , Tabernacle Baptist Church (C) , Apostolic Christian Church of West Akron (D) , Good Shepherd Baptist Church (E) , Bethel Seventh Day Adventist Church (F) , Holy Trinity United Methodist Church (G) , Cross Way Apostolic Church (H) , Christ United Methodist Church (I) . Display/hide their locations on the map
Cemetery: (1) . Display/hide its location on the map
Reservoirs: (A) , White Pond (B) , Black Pond (C) , Schocalog Lake (D) . Display/hide their locations on the map
Streams, rivers, and creeks: (A) . Display/hide its location on the map
Parks in zip code 44320 include: (1) , Childrens Zoo (2) , Erie Island Park (3) , Schneider Park (4) , Mud Run Park (5) , Kerr Park (6) , Dover Park (7) . Display/hide their locations on the map
Tourist attractions (not listed on the city page) :
Year house built (houses)
17 2020 or later494 2010 to 2019265 2000 to 2009488 1990 to 1999770 1980 to 1989791 1970 to 1979745 1960 to 19691,959 1950 to 1959901 1940 to 19492,993 1939 or earlier
Zip code 44320 household income distribution in 2022 1,302 Less than $10,000779 $10,000 to $14,999646 $15,000 to $19,999480 $20,000 to $24,999801 $25,000 to $29,999310 $30,000 to $34,999410 $35,000 to $39,999860 $40,000 to $44,999265 $45,000 to $49,999260 $50,000 to $59,999683 $60,000 to $74,999866 $75,000 to $99,999367 $100,000 to $124,999219 $125,000 to $149,999280 $150,000 to $199,999271 $200,000 or moreEstimate of home value of owner-occupied houses/condos in 2022 in zip code 44320 19 Less than $10,00036 $10,000 to $14,9997 $15,000 to $19,99912 $20,000 to $24,99911 $30,000 to $34,99964 $35,000 to $39,999204 $40,000 to $49,999219 $50,000 to $59,999401 $60,000 to $69,999501 $70,000 to $79,999465 $80,000 to $89,999226 $90,000 to $99,999368 $100,000 to $124,999316 $125,000 to $149,999356 $150,000 to $174,999294 $175,000 to $199,999247 $200,000 to $249,999120 $250,000 to $299,999129 $300,000 to $399,99925 $400,000 to $499,999109 $500,000 to $749,99921 $2,000,000 or moreRent paid by renters in 2022 in zip code 44320 24 Less than $1008 $100 to $14918 $150 to $199157 $200 to $24936 $250 to $29946 $300 to $34988 $350 to $39935 $400 to $449113 $450 to $499331 $500 to $549299 $550 to $599335 $600 to $649309 $650 to $699440 $700 to $749827 $750 to $799388 $800 to $899259 $900 to $99966 $1,000 to $1,24944 $1,250 to $1,49926 $1,500 to $1,99913 $2,000 to $2,499161 No cash rent
Median gross rent in 2022: $866.
Median price asked for vacant for-sale houses and condos in 2022: $153,412.
Estimated median house (or condo) value in 2022 for: White Non-Hispanic householders: $132,001Black or African American householders: $98,859Asian householders: $150,555Some other race householders: $69,683Two or more races householders: $117,838Hispanic or Latino householders: $114,722Estimated median house or condo value in 2022: $104,667
44320:
$104,667Ohio:
$204,100
Lower value quartile - upper value quartile: $76,616 - $179,162
Mean price in 2022: Detached houses: $181,207Here:
$181,207State:
$254,366
Townhouses or other attached units: $330,083Here:
$330,083State:
$225,733
In 2-unit structures: $340,310Here:
$340,310State:
$144,384
Housing units in structures:
One, detached: 7,105One, attached: 161Two: 4883 or 4: 1305 to 9: 5510 to 19: 13020 to 49: 56150 or more: 915Mobile homes: 22Unemployment : 3.8%
Means of transportation to work in zip code 44320 73.4% 5,623 Drove a car alone9.1% 695 Carpooled2.5% 194 Bus or trolley bus1.7% 134 Taxi1.3% 102 Other means12.1% 926 Worked at homeTravel time to work (commute) in zip code 44320 52 Less than 5 minutes716 5 to 9 minutes1,856 10 to 14 minutes1,554 15 to 19 minutes909 20 to 24 minutes110 25 to 29 minutes510 30 to 34 minutes71 35 to 39 minutes236 40 to 44 minutes267 45 to 59 minutes268 60 to 89 minutes161 90 or more minutes
Neighborhoods in zip code 44320: Percentage of zip code residents living and working in this county: 85.4%
Household type by relationship:
Households: 17,757
Male householders: 3,352 (1,632 living alone ), Female householders: 5,392 (2,364 living alone )1,958 spouses (1,937 opposite-sex spouses ), 297 unmarried partners , (267 opposite-sex unmarried partners ), 5,014 children (4,898 natural , 50 adopted , 68 stepchildren ), 706 grandchildren , 358 brothers or sisters , 119 parents , 0 foster children , 393 other relatives , 124 non-relatives In group quarters: 60 (-1 institutionalized population )
Size of family households: 2,411 2-persons , 1,041 3-persons , 559 4-persons , 282 5-persons , 71 6-persons , 85 7-or-more-persons
Size of nonfamily households: 3,998 1-person , 297 2-persons
1,029 married couples with children. single-parent households (258 men , 1,993 women ).
96.9% of residents of 44320 zip code speak English at home. of residents speak Spanish at home (66% very well, 34% well ).of residents speak other Indo-European language at home (69% very well, 28% well, 3% not at all ).of residents speak Asian or Pacific Island language at home (100% very well ).of residents speak other language at home (93% very well, 7% well ).
Foreign born population: 436 (2.5%)
(59.4%
of them are naturalized citizens )
This zip code:
2.5%Whole state:
5.0%
26% Honduras 22% Liberia 12% Malaysia 11% Haiti 9% Russia 9% Bhutan 6% India 3% German 2% English 2% American 1% Italian 1% European 1% Polish 1% Serbian
Year of entry for the foreign-born population
145 2010 or later 55 2000 to 2009 130 1990 to 1999 142 Before 1990
There are
201 Medical Specialists in Zip Code 44320 .
Facilities with environmental interests located in this zip code:
BP OIL CO SITE 05509 * (1354 WOOSTER AVENUE in AKRON, OH)
STATE MASTER (Ohio general info) - AIR MAJOR STATE MASTER (Ohio general info) - -77-5541-905-23, EPCRA, -1677010855, AIR MAJOR, RCRA-OHD987027208, HAZARDOUS WASTE PROGRAM Large Quantity Generators, more that 1000 kg of hazardous waste/month (Resource Conservation and Recovery Act (tracking hazardous waste)) - notification Organizations: BP OIL COMPANY (CONTACT/OWNER)
, ADAPT OIL & MARKETING INC (CONTACT/OWNER)
Alternative names: ADAPT BP NO 05509 *, ADAPT BP NO 5509 *
BELL-AIRE CLEANERS (647-651 STORER AVE in AKRON, OH)
STATE MASTER (Ohio general info) - AIR MAJOR Small Quantity Generators, between 100 kg and 1000 kg of hazardous waste/month (Resource Conservation and Recovery Act (tracking hazardous waste)) - notification Organizations: KLEIN DAVID (CONTACT/OWNER)
Alternative names: BELLAIRE CLEANERS
BP OIL CO SITE 05572 (1609 COPLEY RD in AKRON, OH)
STATE MASTER (Ohio general info) - RCRA-OHD987024916, HAZARDOUS WASTE PROGRAM, AIR MAJOR, -77-5541-168-8, EPCRA Conditionally Exempt Small Quantity Generators, less than 100 kg/month of hazardous waste (Resource Conservation and Recovery Act (tracking hazardous waste)) - notification Organizations: BP OIL COMPANY (CONTACT/OWNER)
AKRON COMMUNITY SCHOOL (1585 FREDERICK BLVD in AKRON, OH)
(National Center for Education Statistics) - STATE ID-133231
AKRON SILVER REFINERY INC (2504 BETULA AVE in AKRON, OH)
(Resource Conservation and Recovery Act (tracking hazardous waste)) Organizations: MISE WILLIAM F (CONTACT/OWNER)
BP OIL CO SITE 05571 (1308 COPLEY RD in AKRON, OH)
(Resource Conservation and Recovery Act (tracking hazardous waste)) Organizations: BP OIL COMPANY (CONTACT/OWNER)
Housing units lacking complete plumbing facilities: 2.6%
Housing units lacking complete kitchen facilities: 2.3%
77.3% Utility gas 20.1% Electricity 1.7% Bottled, tank, or LP gas
Population in 1990: 25,910.
Place of birth for U.S.-born residents:
This state: 13,845Northeast: 499Midwest: 439South: 1,930West: 527
66% of the 44320 zip code residents lived in the same house 5 years ago.
Out of people who lived in different houses, 80% lived in this county.
Out of people who lived in different counties, 50% lived in Ohio.
93% of the 44320 zip code residents lived in the same house 1 year ago.
Out of people who lived in different houses, 73% moved from this county.
Out of people who lived in different houses, 19% moved from different county within same state.
Out of people who lived in different houses, 7% moved from different state.
Private vs. public school enrollment:
Students in private schools in grades 1 to 8 (elementary and middle school): 343
Students in private schools in grades 9 to 12 (high school): 296
Students in private undergraduate colleges: 183
Occupation by median earnings in the past 12 months ($)
81,457 Fire fighting and prevention, and other protective service workers including supervisors 81,147 Computer and mathematical occupations 77,582 Business and financial operations occupations 72,372 Health diagnosing and treating practitioners and other technical occupations 70,850 Architecture and engineering occupations 56,950 Management occupations
Companies with federal contracts located in this zip code:
BURT GREENWALD CHEVROLET INC (1490 VERNON ODOM BLVD in AKRON, OH; small business) in 4 contracts from 2000 to 2006
$52,532 with Defense Logistics Agency for Packing and Gasket Materials. Signed on 2001-04-20. Completion date: 2001-12-20.
with Defense Logistics Agency for Engine Cooling System Components, Nonaircraft. Signed on 2000-01-06. Completion date: 2000-03-21.
with Defense Logistics Agency for Hardware, Commercial. Signed on 2005-12-06. Completion date: 2006-02-04.
with Defense Logistics Agency for Hardware, Commercial. Taking place in MI. Signed on 2006-02-23. Completion date: 2006-04-23.
CLARKTEL COMMUNICATIONS, CORP (1661 COPLEY RD in AKRON, OH; small business) in 6 contracts in 2006
Contracts for Telephone and Telegraph Equipment, Maintenance, Repair and Rebuilding of Equipment -- Communication, Detection, and Coherent Radiation Equipment by Navy, National Park ServiceSigned by year: 2000: $0; 2001: $0; 2002: $0; 2003: $0; 2004: $0; 2005: $0; 2006: $31,321.
Biggest contracts: with Navy for Telephone and Telegraph Equipment. Signed on 2006-04-13. Completion date: 2006-05-31.
with National Park Service for Maintenance, Repair and Rebuilding of Equipment -- Communication, Detection, and Coherent Radiation Equipment. Taking place in MA. Signed on 2006-03-07. Effective on 2006-03-15. Completion date: 2007-03-14.
, same as above. Signed on 2006-06-30. Completion date: 2007-03-14.
, same as above. Signed on 2006-08-31. Completion date: 2007-03-14.
OUTDOOR SPECIALTIES (2360 COPLEY ROAD in AKRON, OH; small business) in 3 contracts from 2004 to 2005
$8,480 with Army for Optical Sighting and Ranging Equipment. Signed on 2005-04-22. Completion date: 2005-05-05.
with Army for Operation Training Devices. Signed on 2004-09-24. Completion date: 2004-11-01.
with Department of Defense for Guns, through 30 mm. Signed on 2004-12-29. Completion date: 2005-01-28.
Top industries in this zip code by the number of employees in 2005:
Health Care and Social Assistance: Services for the Elderly and Persons with Disabilities (500-999 employees: 1 establishment, 10-19 employees: 1 establishment, 1-4 employees: 1 establishment)Accommodation and Food Services: Limited-Service Restaurants (50-99: 1, 20-49: 9, 10-19: 5, 5-9: 2, 1-4: 6)Construction: Commercial and Institutional Building Construction (100-249: 2, 10-19: 1)Other Services (except Public Administration): Religious Organizations (50-99: 1, 20-49: 2, 10-19: 1, 5-9: 5, 1-4: 10)Health Care and Social Assistance: Offices of Physicians (except Mental Health Specialists) (50-99: 1, 20-49: 1, 10-19: 4, 5-9: 3, 1-4: 3)Management of Companies and Enterprises: Corporate, Subsidiary, and Regional Managing Offices (100-249: 1, 10-19: 1, 1-4: 1)Other Services (except Public Administration): Other Grantmaking and Giving Services (100-249: 1)Utilities: Electric Power Distribution (100-249: 1)
People in group quarters in 2010:
67 people in other noninstitutional facilities
29 people in residential treatment centers for adults
14 people in group homes intended for adults
2 people in group homes for juveniles (non-correctional)
People in group quarters in 2000:
34 people in other noninstitutional group quarters
22 people in other group homes
21 people in homes for the mentally ill
14 people in homes or halfway houses for drug/alcohol abuse
3 people in homes for the mentally retarded
3 people in religious group quarters
Fatal accident statistics in 2014:
Fatal accident count: 1Vehicles involved in fatal accidents: 1Fatal accidents caused by drunken drivers: 1Fatalities: 1Persons involved in fatal accidents: 2Pedestrians involved in fatal accidents: 0
Fatal accident statistics in 2013:
Fatal accident count: 1Vehicles involved in fatal accidents: 1Fatal accidents caused by drunken drivers: 0Fatalities: 1Persons involved in fatal accidents: 1Pedestrians involved in fatal accidents: 0
Home Mortgage Disclosure Act Aggregated Statistics For Year 2009(Based on 5 full and 12 partial tracts) A) FHA, FSA/RHS & VA B) Conventional C) Refinancings D) Home Improvement Loans F) Non-occupant Loans on G) Loans On Manufactured Number Average Value Number Average Value Number Average Value Number Average Value Number Average Value Number Average Value
LOANS ORIGINATED 136 $89,088 63 $77,644 244 $103,155 37 $12,573 42 $54,040 1 $66,790 APPLICATIONS APPROVED, NOT ACCEPTED 7 $91,191 7 $87,117 56 $78,997 11 $13,157 2 $116,370 0 $0 APPLICATIONS DENIED 29 $67,204 19 $65,810 283 $87,864 130 $23,874 31 $57,535 2 $60,890 APPLICATIONS WITHDRAWN 11 $84,482 2 $104,805 62 $90,957 7 $38,071 6 $59,603 0 $0 FILES CLOSED FOR INCOMPLETENESS 1 $151,210 6 $33,040 24 $83,582 7 $83,177 10 $42,177 0 $0
Aggregated Statistics For Year 2008(Based on 5 full and 12 partial tracts) A) FHA, FSA/RHS & VA B) Conventional C) Refinancings D) Home Improvement Loans E) Loans on Dwellings For 5+ Families F) Non-occupant Loans on G) Loans On Manufactured Number Average Value Number Average Value Number Average Value Number Average Value Number Average Value Number Average Value Number Average Value
LOANS ORIGINATED 89 $93,183 124 $88,011 300 $80,697 71 $17,036 1 $5,138,640 94 $55,378 1 $11,420 APPLICATIONS APPROVED, NOT ACCEPTED 18 $70,520 13 $60,769 80 $81,916 27 $23,293 0 $0 9 $68,408 1 $51,870 APPLICATIONS DENIED 39 $85,986 73 $68,086 552 $89,010 213 $22,165 0 $0 127 $67,699 2 $74,270 APPLICATIONS WITHDRAWN 11 $80,777 16 $71,274 159 $96,095 12 $35,548 0 $0 14 $69,202 0 $0 FILES CLOSED FOR INCOMPLETENESS 1 $183,310 4 $86,688 53 $96,725 2 $104,185 0 $0 5 $57,408 0 $0
Aggregated Statistics For Year 2007(Based on 5 full and 12 partial tracts) A) FHA, FSA/RHS & VA B) Conventional C) Refinancings D) Home Improvement Loans E) Loans on Dwellings For 5+ Families F) Non-occupant Loans on G) Loans On Manufactured Number Average Value Number Average Value Number Average Value Number Average Value Number Average Value Number Average Value Number Average Value
LOANS ORIGINATED 36 $96,024 341 $81,144 570 $80,369 82 $35,442 0 $0 242 $60,541 1 $92,720 APPLICATIONS APPROVED, NOT ACCEPTED 2 $56,000 70 $65,261 160 $75,097 20 $31,632 4 $138,348 51 $63,299 1 $69,730 APPLICATIONS DENIED 11 $96,701 196 $77,248 1,058 $83,722 237 $43,912 0 $0 211 $65,205 1 $8,250 APPLICATIONS WITHDRAWN 10 $112,745 65 $67,760 290 $85,826 18 $45,501 0 $0 46 $55,583 0 $0 FILES CLOSED FOR INCOMPLETENESS 0 $0 18 $91,946 100 $89,500 0 $0 1 $101,150 17 $86,559 0 $0
Aggregated Statistics For Year 2006(Based on 5 full and 12 partial tracts) A) FHA, FSA/RHS & VA B) Conventional C) Refinancings D) Home Improvement Loans E) Loans on Dwellings For 5+ Families F) Non-occupant Loans on G) Loans On Manufactured Number Average Value Number Average Value Number Average Value Number Average Value Number Average Value Number Average Value Number Average Value
LOANS ORIGINATED 50 $109,772 700 $74,260 964 $74,227 139 $38,264 3 $960,427 474 $63,221 0 $0 APPLICATIONS APPROVED, NOT ACCEPTED 1 $48,310 165 $73,577 277 $81,889 55 $46,019 0 $0 76 $65,683 0 $0 APPLICATIONS DENIED 8 $129,215 412 $68,961 1,306 $82,525 310 $30,137 3 $130,057 295 $61,094 2 $15,000 APPLICATIONS WITHDRAWN 2 $163,040 145 $75,358 603 $83,016 51 $60,441 0 $0 120 $59,499 0 $0 FILES CLOSED FOR INCOMPLETENESS 1 $106,340 38 $73,993 129 $85,465 7 $42,884 2 $216,795 27 $64,242 0 $0
Aggregated Statistics For Year 2005(Based on 5 full and 12 partial tracts) A) FHA, FSA/RHS & VA B) Conventional C) Refinancings D) Home Improvement Loans E) Loans on Dwellings For 5+ Families F) Non-occupant Loans on G) Loans On Manufactured Number Average Value Number Average Value Number Average Value Number Average Value Number Average Value Number Average Value Number Average Value
LOANS ORIGINATED 62 $95,280 735 $76,338 1,137 $78,171 184 $35,917 2 $340,050 395 $61,281 1 $44,090 APPLICATIONS APPROVED, NOT ACCEPTED 6 $76,473 156 $71,706 301 $79,536 49 $33,260 1 $102,470 46 $60,003 0 $0 APPLICATIONS DENIED 6 $70,243 340 $70,772 1,501 $83,697 363 $36,148 0 $0 200 $62,235 7 $99,103 APPLICATIONS WITHDRAWN 14 $91,738 214 $94,083 799 $89,256 84 $113,351 2 $139,845 90 $68,565 0 $0 FILES CLOSED FOR INCOMPLETENESS 2 $67,965 22 $74,992 152 $94,822 6 $47,655 0 $0 14 $72,011 0 $0
Aggregated Statistics For Year 2004(Based on 5 full and 12 partial tracts) A) FHA, FSA/RHS & VA B) Conventional C) Refinancings D) Home Improvement Loans E) Loans on Dwellings For 5+ Families F) Non-occupant Loans on G) Loans On Manufactured Number Average Value Number Average Value Number Average Value Number Average Value Number Average Value Number Average Value Number Average Value
LOANS ORIGINATED 53 $89,412 605 $79,040 1,333 $78,041 125 $40,416 3 $2,078,827 426 $60,393 3 $99,803 APPLICATIONS APPROVED, NOT ACCEPTED 2 $59,420 152 $64,131 459 $76,580 25 $30,845 0 $0 104 $54,127 0 $0 APPLICATIONS DENIED 10 $85,135 198 $70,028 1,527 $76,289 306 $35,894 2 $70,350 187 $59,296 4 $42,790 APPLICATIONS WITHDRAWN 12 $88,420 107 $76,790 850 $84,965 36 $49,353 4 $70,000 79 $62,752 1 $62,170 FILES CLOSED FOR INCOMPLETENESS 3 $99,560 26 $66,217 141 $86,955 8 $44,731 0 $0 22 $64,862 0 $0
Aggregated Statistics For Year 2003(Based on 5 full and 12 partial tracts) A) FHA, FSA/RHS & VA B) Conventional C) Refinancings D) Home Improvement Loans E) Loans on Dwellings For 5+ Families F) Non-occupant Loans on Number Average Value Number Average Value Number Average Value Number Average Value Number Average Value Number Average Value
LOANS ORIGINATED 92 $86,785 466 $79,190 1,587 $80,501 110 $22,420 0 $0 317 $60,581 APPLICATIONS APPROVED, NOT ACCEPTED 4 $66,880 82 $73,864 431 $75,778 50 $26,395 0 $0 73 $59,345 APPLICATIONS DENIED 19 $78,958 141 $62,404 1,280 $76,301 183 $13,490 0 $0 140 $56,097 APPLICATIONS WITHDRAWN 11 $84,333 84 $92,458 739 $79,143 27 $33,046 1 $100,500 55 $62,010 FILES CLOSED FOR INCOMPLETENESS 2 $82,955 29 $71,961 181 $80,483 6 $35,800 0 $0 19 $67,599
Aggregated Statistics For Year 2002(Based on 5 full and 12 partial tracts) A) FHA, FSA/RHS & VA B) Conventional C) Refinancings D) Home Improvement Loans F) Non-occupant Loans on Number Average Value Number Average Value Number Average Value Number Average Value Number Average Value
LOANS ORIGINATED 113 $93,539 333 $81,776 1,445 $75,256 100 $14,429 293 $54,796 APPLICATIONS APPROVED, NOT ACCEPTED 10 $88,570 54 $60,492 446 $69,535 47 $14,427 45 $71,907 APPLICATIONS DENIED 4 $99,922 98 $61,923 1,304 $70,568 167 $13,033 139 $55,140 APPLICATIONS WITHDRAWN 17 $75,244 79 $79,917 711 $77,458 38 $37,415 44 $63,538 FILES CLOSED FOR INCOMPLETENESS 3 $114,407 18 $89,691 224 $77,501 2 $19,450 16 $55,911
Aggregated Statistics For Year 2001(Based on 5 full and 12 partial tracts) A) FHA, FSA/RHS & VA B) Conventional C) Refinancings D) Home Improvement Loans E) Loans on Dwellings For 5+ Families F) Non-occupant Loans on Number Average Value Number Average Value Number Average Value Number Average Value Number Average Value Number Average Value
LOANS ORIGINATED 125 $81,238 405 $73,932 1,460 $71,249 148 $18,126 0 $0 272 $51,800 APPLICATIONS APPROVED, NOT ACCEPTED 3 $63,813 66 $64,946 454 $68,774 64 $21,677 0 $0 41 $74,158 APPLICATIONS DENIED 8 $83,775 172 $60,367 1,729 $67,559 386 $12,907 0 $0 115 $55,717 APPLICATIONS WITHDRAWN 17 $75,846 56 $70,021 784 $69,923 42 $28,357 1 $43,480 33 $61,540 FILES CLOSED FOR INCOMPLETENESS 0 $0 20 $59,463 170 $72,320 6 $26,773 0 $0 5 $54,210
Aggregated Statistics For Year 2000(Based on 5 full and 12 partial tracts) A) FHA, FSA/RHS & VA B) Conventional C) Refinancings D) Home Improvement Loans E) Loans on Dwellings For 5+ Families F) Non-occupant Loans on Number Average Value Number Average Value Number Average Value Number Average Value Number Average Value Number Average Value
LOANS ORIGINATED 108 $81,154 403 $76,094 1,000 $60,904 201 $14,816 1 $627,320 196 $55,724 APPLICATIONS APPROVED, NOT ACCEPTED 5 $86,460 71 $62,821 400 $55,886 151 $14,859 0 $0 39 $43,592 APPLICATIONS DENIED 25 $73,416 203 $61,144 1,569 $62,263 476 $13,521 1 $32,820 155 $47,254 APPLICATIONS WITHDRAWN 13 $80,830 91 $61,476 533 $60,851 60 $21,948 0 $0 44 $46,221 FILES CLOSED FOR INCOMPLETENESS 0 $0 22 $73,990 272 $68,067 19 $42,006 0 $0 13 $72,995
Aggregated Statistics For Year 1999(Based on 3 full and 6 partial tracts) A) FHA, FSA/RHS & VA B) Conventional C) Refinancings D) Home Improvement Loans E) Loans on Dwellings For 5+ Families F) Non-occupant Loans on Number Average Value Number Average Value Number Average Value Number Average Value Number Average Value Number Average Value
LOANS ORIGINATED 83 $75,993 195 $132,744 719 $59,597 136 $11,455 2 $409,590 111 $47,518 APPLICATIONS APPROVED, NOT ACCEPTED 4 $57,240 57 $59,216 348 $58,436 73 $14,125 1 $2,000 36 $44,569 APPLICATIONS DENIED 9 $65,701 81 $55,499 754 $60,946 265 $11,346 0 $0 58 $47,639 APPLICATIONS WITHDRAWN 5 $75,628 49 $61,841 343 $59,510 18 $28,444 0 $0 22 $44,931 FILES CLOSED FOR INCOMPLETENESS 2 $64,745 9 $72,647 120 $62,588 2 $24,415 0 $0 8 $45,188
Private Mortgage Insurance Companies Aggregated Statistics For Year 2009(Based on 3 full and 8 partial tracts) A) Conventional B) Refinancings C) Non-occupant Loans on Number Average Value Number Average Value Number Average Value
LOANS ORIGINATED 9 $71,116 3 $164,653 1 $33,720 APPLICATIONS APPROVED, NOT ACCEPTED 3 $80,640 1 $81,700 1 $41,840 APPLICATIONS DENIED 1 $145,100 1 $186,120 0 $0 APPLICATIONS WITHDRAWN 0 $0 0 $0 0 $0 FILES CLOSED FOR INCOMPLETENESS 2 $99,055 1 $96,610 2 $79,910
Aggregated Statistics For Year 2008(Based on 5 full and 12 partial tracts) A) Conventional B) Refinancings C) Non-occupant Loans on Number Average Value Number Average Value Number Average Value
LOANS ORIGINATED 49 $100,827 20 $108,997 13 $67,468 APPLICATIONS APPROVED, NOT ACCEPTED 21 $91,709 43 $97,604 12 $70,896 APPLICATIONS DENIED 10 $75,280 4 $100,410 10 $66,129 APPLICATIONS WITHDRAWN 2 $168,550 5 $86,622 0 $0 FILES CLOSED FOR INCOMPLETENESS 0 $0 2 $77,425 2 $77,425
Aggregated Statistics For Year 2007(Based on 5 full and 12 partial tracts) A) Conventional B) Refinancings C) Non-occupant Loans on Number Average Value Number Average Value Number Average Value
LOANS ORIGINATED 130 $91,331 85 $100,315 36 $65,752 APPLICATIONS APPROVED, NOT ACCEPTED 16 $91,987 30 $102,431 8 $86,048 APPLICATIONS DENIED 3 $98,480 1 $199,170 1 $115,640 APPLICATIONS WITHDRAWN 2 $101,465 12 $106,288 0 $0 FILES CLOSED FOR INCOMPLETENESS 1 $101,150 2 $106,880 0 $0
Aggregated Statistics For Year 2006(Based on 5 full and 12 partial tracts) A) Conventional B) Refinancings C) Non-occupant Loans on Number Average Value Number Average Value Number Average Value
LOANS ORIGINATED 116 $90,522 59 $93,006 27 $65,308 APPLICATIONS APPROVED, NOT ACCEPTED 11 $92,594 19 $94,573 4 $61,932 APPLICATIONS DENIED 0 $0 0 $0 0 $0 APPLICATIONS WITHDRAWN 4 $109,032 6 $101,000 1 $168,340 FILES CLOSED FOR INCOMPLETENESS 0 $0 0 $0 0 $0
Aggregated Statistics For Year 2005(Based on 5 full and 12 partial tracts) A) Conventional B) Refinancings C) Non-occupant Loans on Number Average Value Number Average Value Number Average Value
LOANS ORIGINATED 129 $89,303 55 $94,072 42 $59,280 APPLICATIONS APPROVED, NOT ACCEPTED 13 $86,554 36 $100,396 11 $60,061 APPLICATIONS DENIED 1 $83,640 6 $85,498 3 $74,513 APPLICATIONS WITHDRAWN 5 $64,538 12 $87,632 8 $52,941 FILES CLOSED FOR INCOMPLETENESS 3 $59,227 4 $76,712 2 $33,965
Aggregated Statistics For Year 2004(Based on 5 full and 12 partial tracts) A) Conventional B) Refinancings C) Non-occupant Loans on Number Average Value Number Average Value Number Average Value
LOANS ORIGINATED 184 $83,176 72 $96,085 64 $60,885 APPLICATIONS APPROVED, NOT ACCEPTED 12 $95,846 42 $103,957 10 $75,323 APPLICATIONS DENIED 2 $61,940 3 $79,473 0 $0 APPLICATIONS WITHDRAWN 21 $71,569 6 $80,125 13 $59,737 FILES CLOSED FOR INCOMPLETENESS 0 $0 1 $55,110 0 $0
Aggregated Statistics For Year 2003(Based on 5 full and 12 partial tracts) A) Conventional B) Refinancings C) Non-occupant Loans on Number Average Value Number Average Value Number Average Value
LOANS ORIGINATED 153 $82,138 173 $92,674 54 $62,195 APPLICATIONS APPROVED, NOT ACCEPTED 19 $93,752 103 $92,628 19 $58,783 APPLICATIONS DENIED 6 $61,527 5 $120,650 6 $56,907 APPLICATIONS WITHDRAWN 7 $104,346 27 $97,530 7 $76,559 FILES CLOSED FOR INCOMPLETENESS 2 $49,295 9 $113,387 1 $51,230
Aggregated Statistics For Year 2002(Based on 5 full and 12 partial tracts) A) Conventional B) Refinancings C) Non-occupant Loans on Number Average Value Number Average Value Number Average Value
LOANS ORIGINATED 120 $87,207 133 $90,032 23 $54,157 APPLICATIONS APPROVED, NOT ACCEPTED 29 $92,856 51 $84,649 13 $60,112 APPLICATIONS DENIED 2 $66,925 5 $100,458 3 $92,897 APPLICATIONS WITHDRAWN 2 $154,865 19 $84,956 4 $79,600 FILES CLOSED FOR INCOMPLETENESS 0 $0 7 $60,454 3 $51,000
Aggregated Statistics For Year 2001(Based on 5 full and 12 partial tracts) A) Conventional B) Refinancings C) Non-occupant Loans on Number Average Value Number Average Value Number Average Value
LOANS ORIGINATED 136 $74,234 121 $92,360 39 $55,867 APPLICATIONS APPROVED, NOT ACCEPTED 21 $74,127 57 $75,412 16 $51,728 APPLICATIONS DENIED 4 $75,635 17 $81,098 7 $65,144 APPLICATIONS WITHDRAWN 1 $65,870 8 $74,996 2 $59,935 FILES CLOSED FOR INCOMPLETENESS 0 $0 1 $230,900 0 $0
Aggregated Statistics For Year 2000(Based on 5 full and 12 partial tracts) A) Conventional B) Refinancings C) Non-occupant Loans on Number Average Value Number Average Value Number Average Value
LOANS ORIGINATED 137 $77,115 86 $72,118 42 $57,801 APPLICATIONS APPROVED, NOT ACCEPTED 14 $65,787 13 $66,483 4 $31,245 APPLICATIONS DENIED 6 $64,640 18 $66,571 4 $48,440 APPLICATIONS WITHDRAWN 4 $63,922 1 $84,290 3 $40,750 FILES CLOSED FOR INCOMPLETENESS 1 $78,030 1 $96,610 0 $0
Aggregated Statistics For Year 1999(Based on 3 full and 6 partial tracts) A) Conventional B) Refinancings C) Non-occupant Loans on Number Average Value Number Average Value Number Average Value
LOANS ORIGINATED 64 $79,003 38 $71,963 17 $44,720 APPLICATIONS APPROVED, NOT ACCEPTED 5 $67,996 5 $72,944 2 $42,385 APPLICATIONS DENIED 5 $56,330 3 $63,597 1 $38,420 APPLICATIONS WITHDRAWN 2 $64,685 0 $0 0 $0 FILES CLOSED FOR INCOMPLETENESS 0 $0 0 $0 0 $0
2003 - 2018 National Fire Incident Reporting System (NFIRS) incidents See full 2006 National Fire Incident Reporting System statistics for zip code 44320, Ohio
Most common first names in zip code 44320 among deceased individuals Name Count Lived (average)
John 256 75.3 years Mary 199 78.7 years William 185 73.2 years James 174 71.9 years Charles 138 73.7 years Robert 128 67.7 years George 102 75.4 years Willie 82 72.3 years Anna 82 82.5 years Joseph 74 72.8 years
Most common last names in zip code 44320 among deceased individuals Last name Count Lived (average)
Smith 104 71.5 years Williams 93 72.2 years Johnson 86 74.4 years Jones 65 71.3 years Jackson 56 72.0 years Thomas 55 70.8 years Brown 54 74.5 years Walker 54 71.2 years Davis 50 75.9 years Robinson 46 69.6 years
Businesses in zip code 44320
Name Count Name Count
ALDI 1 MasterBrand Cabinets 3 Advance Auto Parts 1 McDonald's 2 AutoZone 1 Pizza Hut 1 Burger King 1 Sears 2 Chevrolet 1 Subway 1 Church's Chicken 2 Taco Bell 1 Circle K 2 The Athlete's Foot 1 FedEx 3 Toyota 1 H&R Block 2 U-Haul 1 JCPenney 1 UPS 3 Long John Silver's 1 Walgreens 1

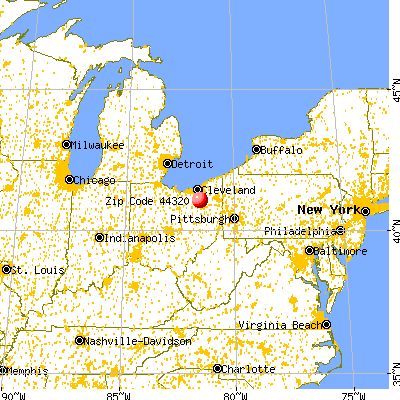


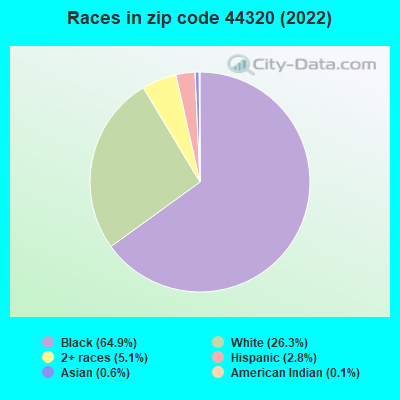


 Nearest zip codes: 44307, 44314, 44302, 44303, 44313, 44311.
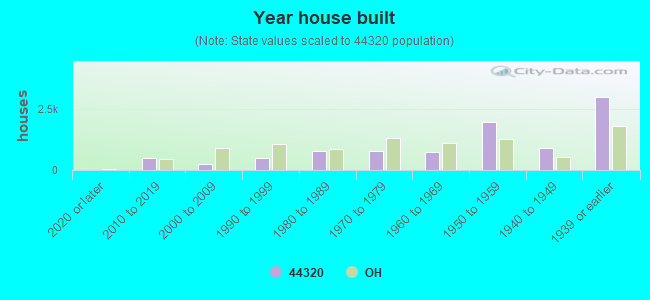

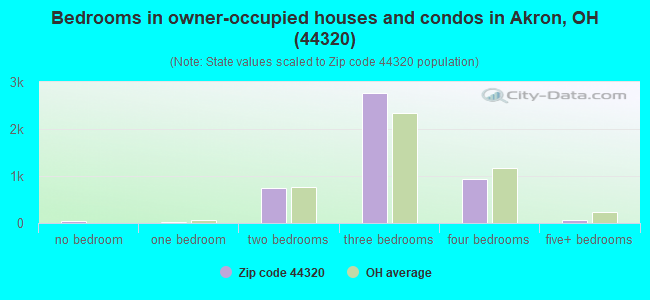
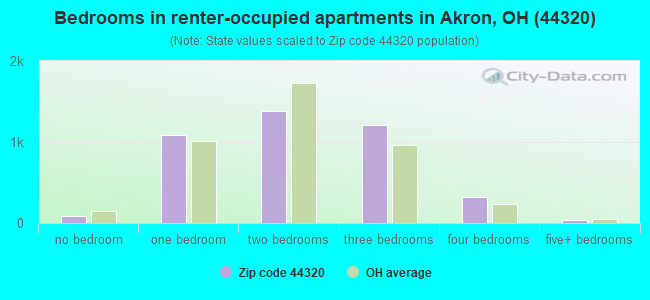
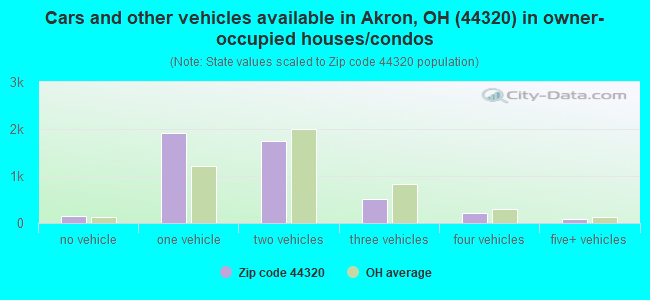
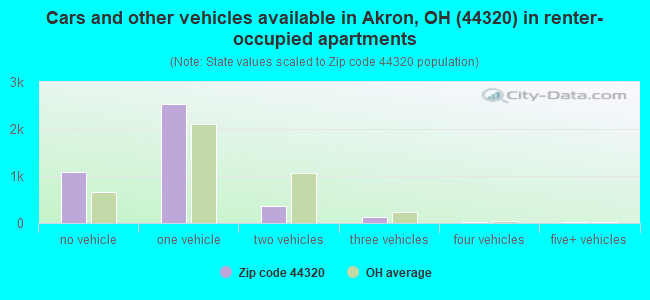


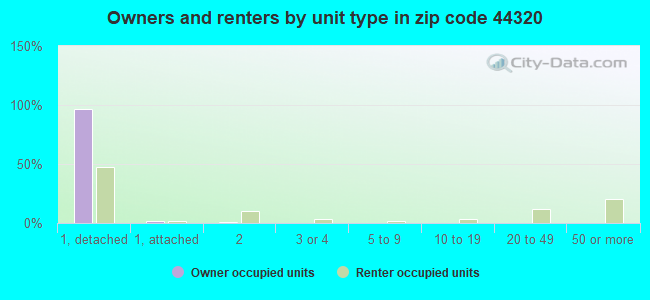
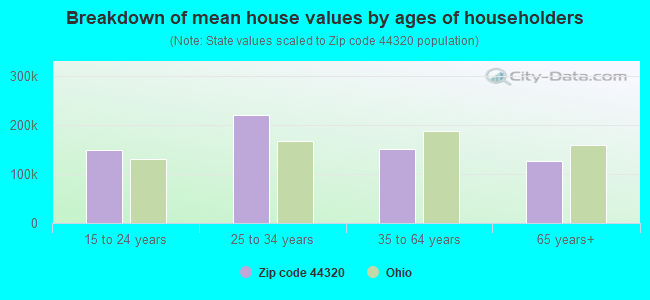


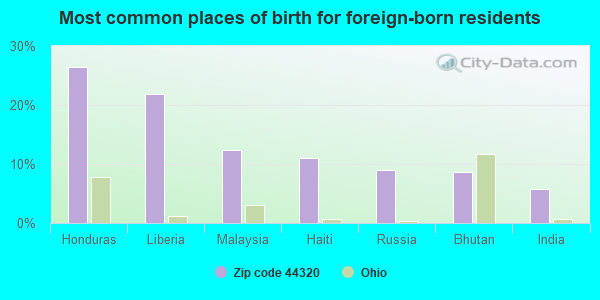
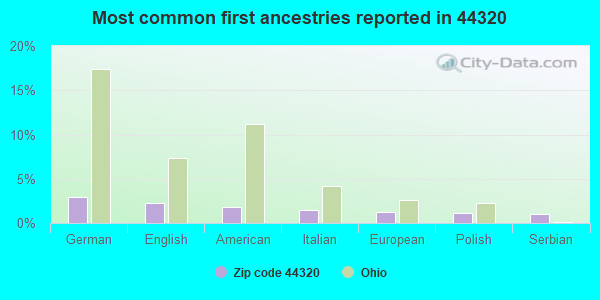
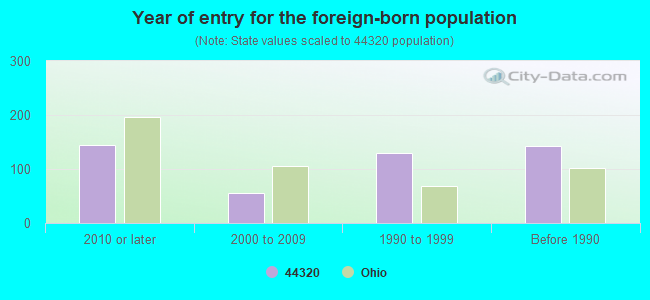


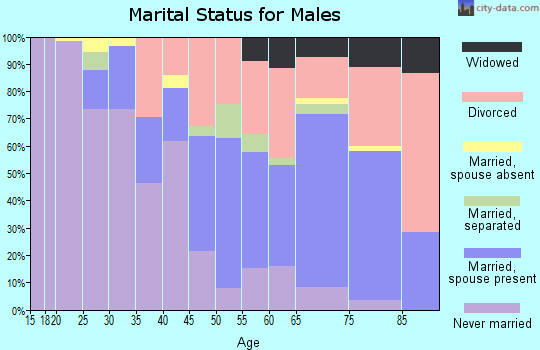
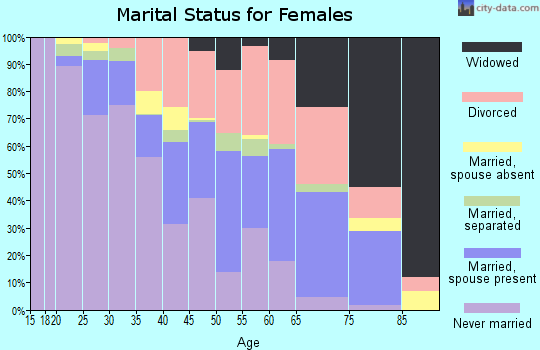
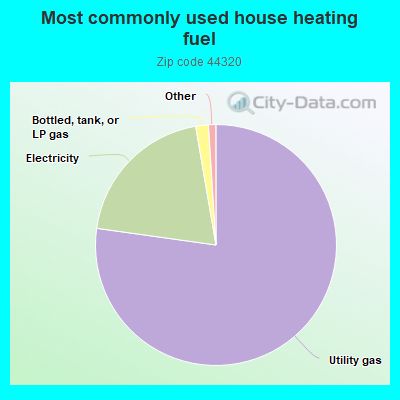
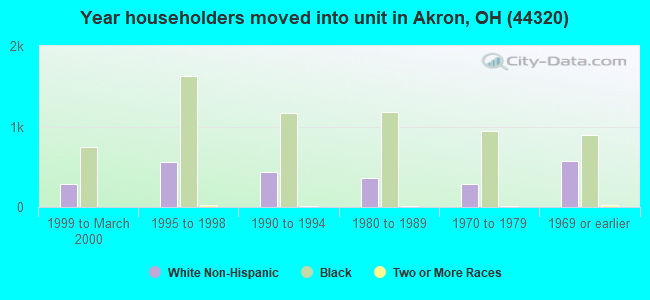
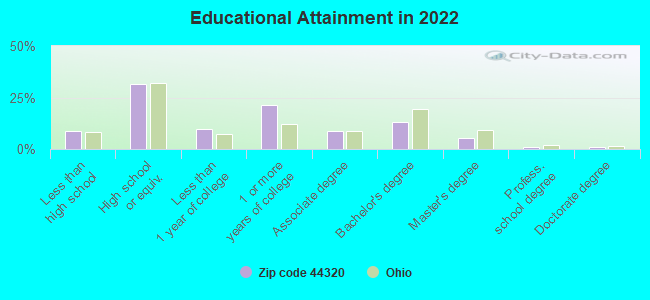
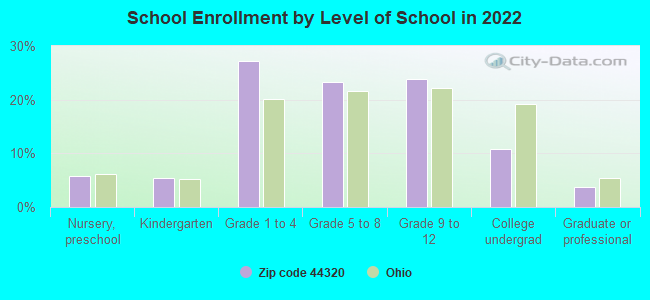
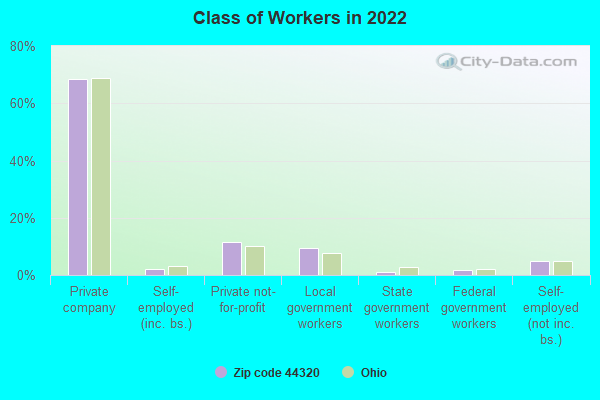
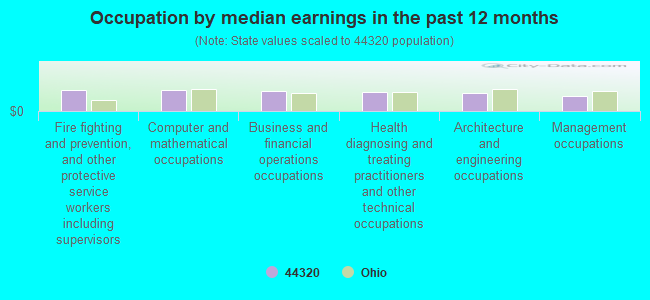
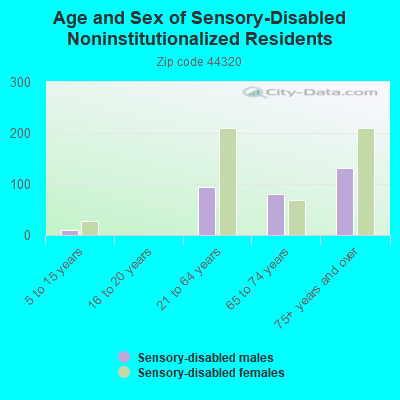
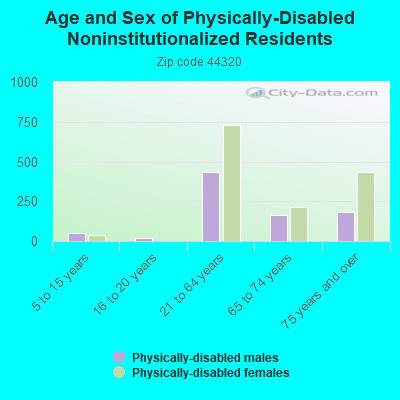
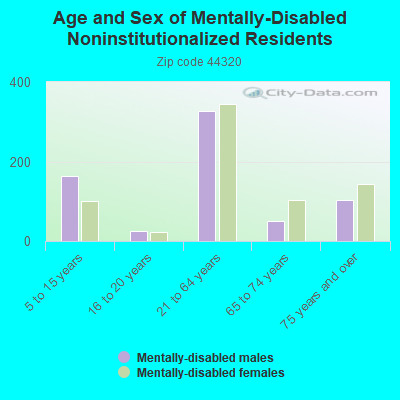
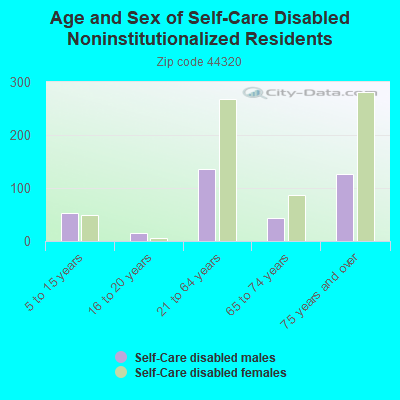
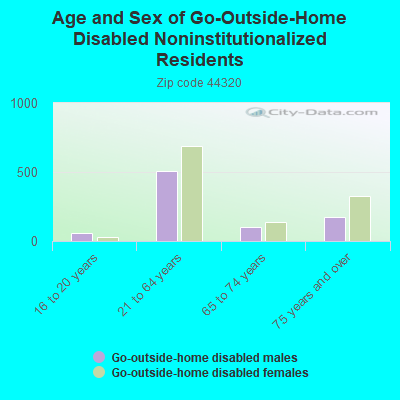
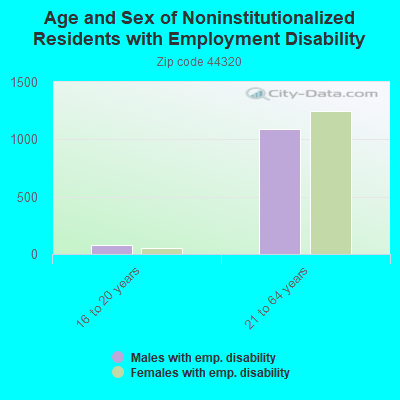
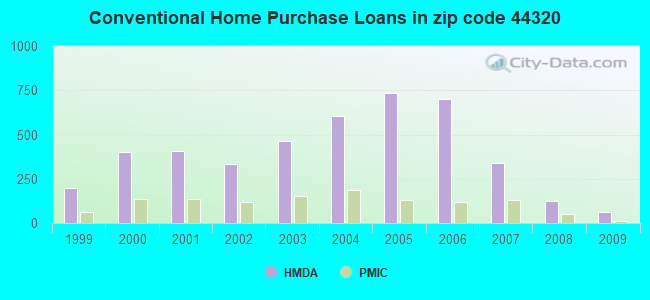
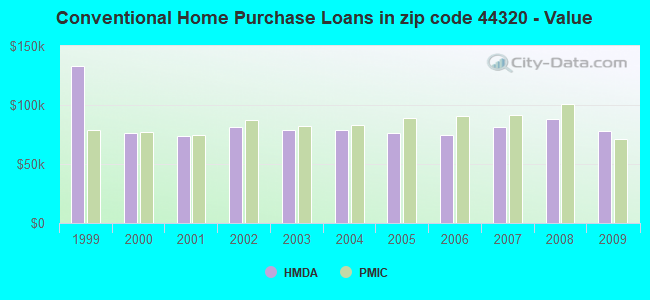
 According to the data from the years 2003 - 2018 the average number of fires per year is 105. The highest number of reported fire incidents - 140 took place in 2007, and the least - 77 in 2018. The data has a decreasing trend.
 When looking into fire subcategories, the most reports belonged to: Structure Fires (48.0%), and Mobile Property/Vehicle Fires (24.0%).