Estimated zip code population in 2022: 17,618 Zip code population in 2010: 18,825 Zip code population in 2000: 20,395
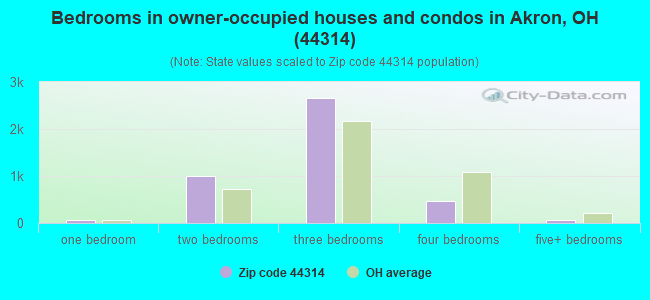
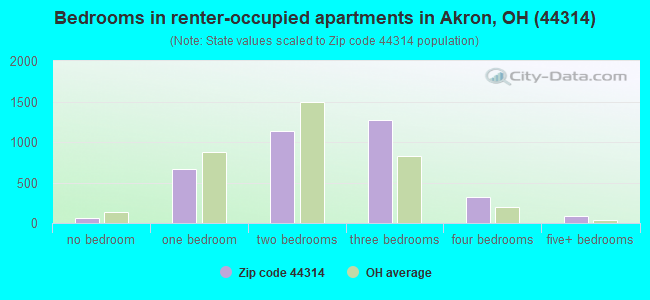
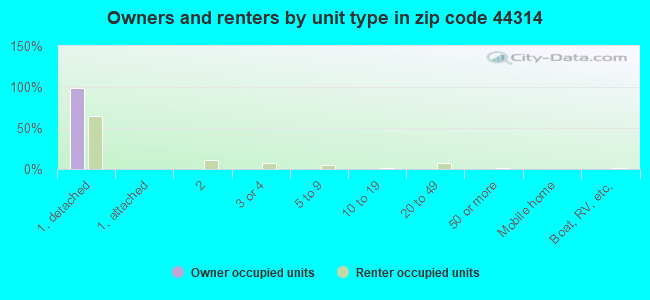
Houses and condos: 8,905 Renter-occupied apartments: 3,585
% of renters here:
46%
State:
33%
March 2022 cost of living index in zip code 44314: 94.9 (less than average, U.S. average is 100)
Land area: 4.4 sq. mi. Water area: 0.2 sq. mi.
Population density: 4,040 people per square mile
(average).
OSM Map
General Map
Google Map
MSN Map
OSM Map
General Map
Google Map
MSN Map
OSM Map
General Map
Google Map
MSN Map
OSM Map
General Map
Google Map
MSN Map
Please wait while loading the map...
Real estate property taxes paid for housing units in 2022:
This zip code:
1.6% ($1,436)
Ohio:
1.3% ($2,639)
Median real estate property taxes paid for housing units with mortgages in 2022: $1,483 (1.6%) Median real estate property taxes paid for housing units with no mortgage in 2022: $1,346 (1.7%)
Business Search- 14 Million verified businesses
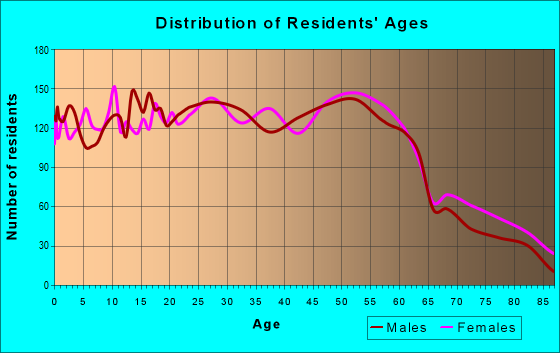
Males: 8,134
(46.2%)
Females: 9,482
(53.8%)
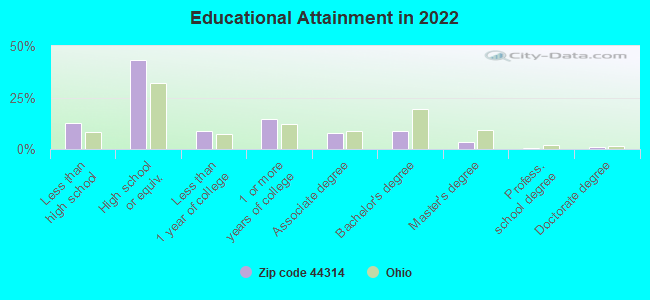
For population 25 years and over in 44314:
High school or higher: 85.9%
Bachelor's degree or higher: 13.3%
Graduate or professional degree: 4.9%
Unemployed: 5.2%
Mean travel time to work (commute): 20.8 minutes
For population 15 years and over in 44314:
Never married: 36.0%
Now married: 38.4%
Separated: 2.8%
Widowed: 6.1%
Divorced: 16.7%
Zip code 44314 compared to state average:
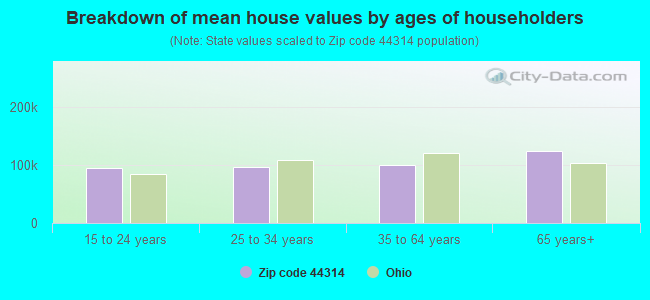
Median house value significantly below state average.
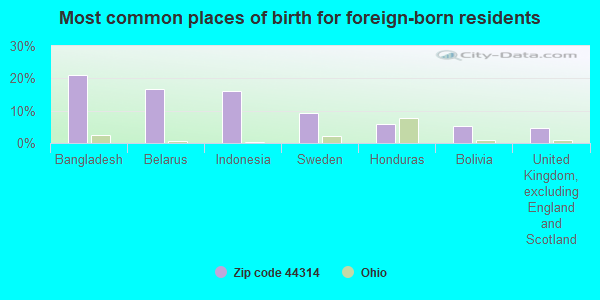
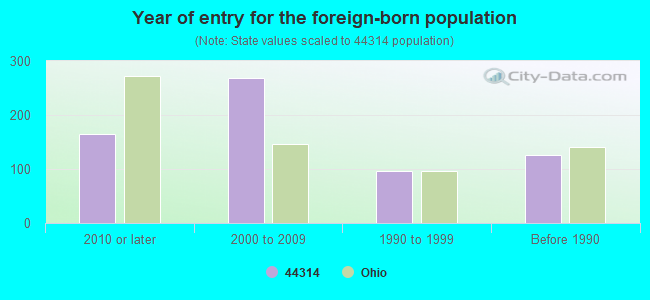
Foreign-born population percentage below state average.
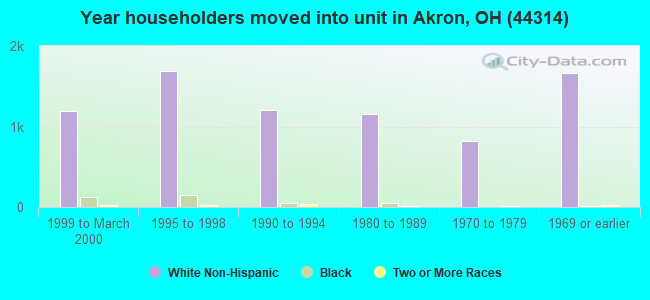
Length of stay since moving in significantly above state average.
House age above state average.
Percentage of population with a bachelor's degree or higher significantly below state average.
Averages for the 2020 tax year for zip code 44314, filed in 2021:
Average Adjusted Gross Income (AGI) in 2020: $33,552 (Individual Income Tax Returns)
Here:
$33,552
State:
$67,288
Salary/wage: $30,595 (reported on 85.5% of returns)
Here:
$30,595
State:
$55,628
(% of AGI for various income ranges: 1131.6% for AGIs below $25k, 3503.8% for AGIs $25k-50k, 6203.3% for AGIs $50k-75k, 9198.0% for AGIs $75k-100k, 14353.6% for AGIs $100k-200k)
Taxable interest for individuals: $640 (reported on 11.3% of returns)
This zip code:
$640
Ohio:
$1,518
(% of AGI for various income ranges: 5.5% for AGIs below $25k, 6.6% for AGIs $25k-50k, 14.8% for AGIs $50k-75k, 21.0% for AGIs $75k-100k, 65.7% for AGIs $100k-200k)
Ordinary dividends: $1,764 (reported on 5.3% of returns)
Here:
$1,764
State:
$7,167
(% of AGI for various income ranges: 5.5% for AGIs below $25k, 8.1% for AGIs $25k-50k, 12.4% for AGIs $50k-75k, 41.7% for AGIs $75k-100k, 134.3% for AGIs $100k-200k)
Net capital gain/loss in AGI: +$4,421 (reported on 4.5% of returns)
Here:
+$4,421
State:
+$18,919
(% of AGI for various income ranges: 1.6% for AGIs below $25k, 8.5% for AGIs $25k-50k, 27.1% for AGIs $50k-75k, 109.7% for AGIs $75k-100k, 617.9% for AGIs $100k-200k)
Profit/loss from business: +$5,651 (reported on 10.6% of returns)
Here:
+$5,651
State:
+$13,744
(% of AGI for various income ranges: 82.0% for AGIs below $25k, 59.4% for AGIs $25k-50k, 55.5% for AGIs $50k-75k, 142.7% for AGIs $75k-100k, 90.0% for AGIs $100k-200k)
Taxable individual retirement arrangement distribution: $10,826 (reported on 4.5% of returns)
44314:
$10,826
Ohio:
$18,876
(% of AGI for various income ranges: 23.8% for AGIs below $25k, 31.7% for AGIs $25k-50k, 127.6% for AGIs $50k-75k, 242.0% for AGIs $75k-100k, 567.9% for AGIs $100k-200k)
Total itemized deductions: $22,512 (reported on 0.9% of returns)
Here:
$22,512
State:
$33,869
(% of AGI for various income ranges: 23.6% for AGIs $25k-50k, 51.0% for AGIs $50k-75k, 262.0% for AGIs $75k-100k)
Charity contributions: $8,183 (reported on 0.7% of returns)
Here:
$8,183
State:
$14,577
(% of AGI for various income ranges: 8.2% for AGIs $25k-50k, 94.7% for AGIs $75k-100k)
Taxes paid: $4,875 (reported on 0.9% of returns)
44314:
$4,875
State:
$7,681
(% of AGI for various income ranges: 2.6% for AGIs $25k-50k, 14.9% for AGIs $50k-75k, 67.0% for AGIs $75k-100k)
Earned income credit: $2,379 (reported on 28.7% of returns)
Here:
$2,379
State:
$2,304
(% of AGI for various income ranges: 118.4% for AGIs below $25k, 82.5% for AGIs $25k-50k)
Percentage of individuals using paid preparers for their 2020 taxes: 95.3%
Here:
95%
State:
94%
(% for various income ranges: 95.3% for AGIs below $25k, 96.0% for AGIs $25k-50k, 94.3% for AGIs $50k-75k, 95.0% for AGIs $75k-100k, 91.3% for AGIs $100k-200k)
Averages for the 2012 tax year for zip code 44314, filed in 2013:
Average Adjusted Gross Income (AGI) in 2012: $30,124 (Individual Income Tax Returns)
Here:
$30,124
State:
$54,926
Salary/wage: $28,310 (reported on 87.6% of returns)
Here:
$28,310
State:
$45,869
(% of AGI for various income ranges: 79.1% for AGIs below $25k, 85.0% for AGIs $25k-50k, 84.8% for AGIs $50k-75k, 84.2% for AGIs $75k-100k, 68.6% for AGIs $100k-200k)
Taxable interest for individuals: $626 (reported on 15.9% of returns)
This zip code:
$626
Ohio:
$1,297
(% of AGI for various income ranges: 0.4% for AGIs below $25k, 0.3% for AGIs $25k-50k, 0.3% for AGIs $50k-75k, 0.2% for AGIs $75k-100k, 0.6% for AGIs $100k-200k)
Ordinary dividends: $1,834 (reported on 7.3% of returns)
Here:
$1,834
State:
$5,821
(% of AGI for various income ranges: 0.4% for AGIs below $25k, 0.3% for AGIs $25k-50k, 0.4% for AGIs $50k-75k, 0.3% for AGIs $75k-100k, 1.6% for AGIs $100k-200k)
Net capital gain/loss in AGI: +$263 (reported on 4.2% of returns)
Here:
+$263
State:
+$11,232
(% of AGI for various income ranges: 0.4% for AGIs $100k-200k)
Profit/loss from business: +$7,236 (reported on 10.2% of returns)
Here:
+$7,236
State:
+$12,773
(% of AGI for various income ranges: 7.1% for AGIs below $25k, 1.3% for AGIs $25k-50k, 0.7% for AGIs $50k-75k, 2.1% for AGIs $75k-100k)
Taxable individual retirement arrangement distribution: $9,116 (reported on 5.9% of returns)
44314:
$9,116
Ohio:
$14,511
(% of AGI for various income ranges: 1.8% for AGIs below $25k, 1.4% for AGIs $25k-50k, 1.4% for AGIs $50k-75k, 2.2% for AGIs $75k-100k, 3.8% for AGIs $100k-200k)
Total itemized deductions: $12,915 (24% of AGI, reported on 14.0% of returns)
Here:
$12,915
State:
$21,278
Here:
23.8% of AGI
State:
18.8% of AGI
(% of AGI for various income ranges: 2.9% for AGIs below $25k, 5.9% for AGIs $25k-50k, 7.1% for AGIs $50k-75k, 6.9% for AGIs $75k-100k, 10.4% for AGIs $100k-200k)
Charity contributions: $2,516 (reported on 9.2% of returns)
Here:
$2,516
State:
$3,943
(% of AGI for various income ranges: 0.2% for AGIs below $25k, 0.6% for AGIs $25k-50k, 0.9% for AGIs $50k-75k, 1.2% for AGIs $75k-100k, 1.9% for AGIs $100k-200k)
Taxes paid: $4,710 (reported on 13.8% of returns)
44314:
$4,710
State:
$9,568
(% of AGI for various income ranges: 0.6% for AGIs below $25k, 2.1% for AGIs $25k-50k, 2.5% for AGIs $50k-75k, 2.9% for AGIs $75k-100k, 4.5% for AGIs $100k-200k)
Earned income credit: $2,454 (reported on 29.1% of returns)
Here:
$2,454
State:
$2,285
(% of AGI for various income ranges: 8.7% for AGIs below $25k, 1.2% for AGIs $25k-50k)
Percentage of individuals using paid preparers for their 2012 taxes: 45.9%
Here:
46%
State:
51%
(% for various income ranges: 43.8% for AGIs below $25k, 48.1% for AGIs $25k-50k, 49.5% for AGIs $50k-75k, 43.8% for AGIs $75k-100k, 53.3% for AGIs $100k-200k)
Averages for the 2004 tax year for zip code 44314, filed in 2005:
Average Adjusted Gross Income (AGI) in 2004: $27,725 (Individual Income Tax Returns)
Here:
$27,725
State:
$44,480
Salary/wage: $26,927 (reported on 88.9% of returns)
Here:
$26,927
State:
$39,198
(% of AGI for various income ranges: 84.8% for AGIs below $10k, 81.9% for AGIs $10k-25k, 89.2% for AGIs $25k-50k, 88.8% for AGIs $50k-75k, 85.4% for AGIs $75k-100k, 65.9% for AGIs over 100k)
Taxable interest for individuals: $1,066 (reported on 25.4% of returns)
This zip code:
$1,066
Ohio:
$1,532
(% of AGI for various income ranges: 2.7% for AGIs below $10k, 1.2% for AGIs $10k-25k, 0.6% for AGIs $25k-50k, 1.0% for AGIs $50k-75k, 1.6% for AGIs $75k-100k, 1.3% for AGIs over 100k)
Taxable dividends: $1,060 (reported on 10.4% of returns)
Here:
$1,060
State:
$3,496
(% of AGI for various income ranges: 1.0% for AGIs below $10k, 0.5% for AGIs $10k-25k, 0.3% for AGIs $25k-50k, 0.4% for AGIs $50k-75k, 0.3% for AGIs $75k-100k, 1.2% for AGIs over 100k)
Net capital gain/loss: +$1,138 (reported on 6.4% of returns)
Here:
+$1,138
State:
+$8,582
(% of AGI for various income ranges: -0.5% for AGIs below $10k, 0.1% for AGIs $10k-25k, 0.2% for AGIs $25k-50k, 0.1% for AGIs $50k-75k, 0.9% for AGIs $75k-100k, 2.7% for AGIs over 100k)
Profit/loss from business: +$5,522 (reported on 9.1% of returns)
Here:
+$5,522
State:
+$10,813
(% of AGI for various income ranges: 5.6% for AGIs below $10k, 3.1% for AGIs $10k-25k, 1.4% for AGIs $25k-50k, 1.0% for AGIs $50k-75k, 2.4% for AGIs $75k-100k)
IRA payment deduction: $1,784 (reported on 1.1% of returns)
44314:
$1,784
Ohio:
$2,794
Total itemized deductions: $11,779 (26% of AGI, reported on 21.2% of returns)
Here:
$11,779
State:
$17,503
Here:
25.5% of AGI
State:
20.8% of AGI
(% of AGI for various income ranges: 2.6% for AGIs below $10k, 4.6% for AGIs $10k-25k, 8.8% for AGIs $25k-50k, 12.5% for AGIs $50k-75k, 12.4% for AGIs $75k-100k, 13.9% for AGIs over 100k)
Charity contributions deductions: $1,890 (4% of AGI, reported on 15.5% of returns)
Here:
$1,890
State:
$3,087
Here:
3.9% of AGI
State:
3.4% of AGI
(% of AGI for various income ranges: 0.2% for AGIs below $10k, 0.5% for AGIs $10k-25k, 0.9% for AGIs $25k-50k, 1.3% for AGIs $50k-75k, 1.8% for AGIs $75k-100k, 3.5% for AGIs over 100k)
Total tax: $2,750 (reported on 71.3% of returns)
44314:
$2,750
State:
$6,781
(% of AGI for various income ranges: 2.1% for AGIs below $10k, 4.0% for AGIs $10k-25k, 6.7% for AGIs $25k-50k, 8.6% for AGIs $50k-75k, 10.7% for AGIs $75k-100k, 16.0% for AGIs over 100k)
Earned income credit: $1,694 (reported on 22.0% of returns)
Here:
$1,694
State:
$1,696
Percentage of individuals using paid preparers for their 2004 taxes: 51.6%
Here:
52%
State:
55%
(% for various income ranges: 45.0% for AGIs below $10k, 53.4% for AGIs $10k-25k, 54.4% for AGIs $25k-50k, 49.8% for AGIs $50k-75k, 52.5% for AGIs $75k-100k, 64.6% for AGIs over 100k)
Likely homosexual households (counted as self-reported same-sex unmarried-partner households)
Lesbian couples: 0.5% of all households
Gay men: 0.0% of all households
Household received Food Stamps/SNAP in the past 12 months: 1,966 Household did not receive Food Stamps/SNAP in the past 12 months: 5,936
Women who had a birth in the past 12 months: 80 (29 now married, 50 unmarried) Women who did not have a birth in the past 12 months: 4,350 (1,404 now married, 2,947 unmarried)
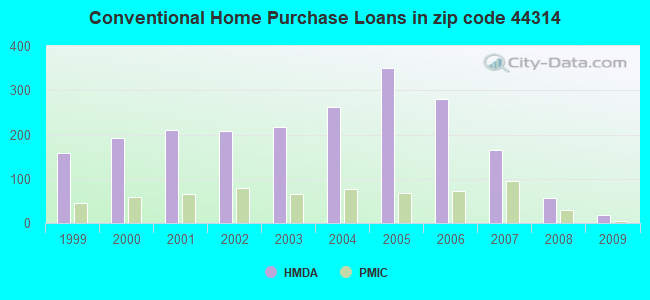
Housing units in zip code 44314 with a mortgage: 2,839 (337 second mortgage, 267 both second mortgage and home equity loan) Houses without a mortgage: 214
Median monthly owner costs for units with a mortgage: $874 Median monthly owner costs for units without a mortgage: $381
Residents with income below the poverty level in 2022:
This zip code:
21.8%
Whole state:
13.4%
Residents with income below 50% of the poverty level in 2022:
This zip code:
13.6%
Whole state:
7.0%
Median number of rooms in houses and condos:
Here:
5.9
State:
6.7
Median number of rooms in apartments:
Here:
5.2
State:
4.4
Notable locations in this zip code not listed on our city pages
Notable locations in zip code 44314: Kenmore Stadium (A), Akron Fire Department Station 10 (B), Kenmore Branch Library (C). Display/hide their locations on the map
Churches in zip code 44314 include: True Light Baptist Church (A), Akron Baptist Temple (B), Apostolic Christian Church of South Akron (C), Allenside Presbyterian Church (D), Hope United Methodist Church (E), Kenmore Church of God (F), Kenmore United Methodist Church (G), Church of God of Prophecy (H), Kenmore Church of the Nazarene (I). Display/hide their locations on the map
Parks in zip code 44314 include: Clearview Park (1), Chestnut Ridge Park (2), Lake Nesmith Park (3), Lisa Ann Park (4), Summit Lake Park (5), Shadyside Park (6), Prentiss Park (7). Display/hide their locations on the map
In group quarters: 29 (-1 institutionalized population)
Size of family households: 2,292 2-persons, 1,021 3-persons, 658 4-persons, 236 5-persons, 154 6-persons, 108 7-or-more-persons
Size of nonfamily households: 2,747 1-person, 618 2-persons, 47 3-persons
1,476 married couples with children.
1,720 single-parent households (195 men, 1,525 women).
95.2% of residents of 44314 zip code speak English at home.
0.8% of residents speak Spanish at home (87% very well, 13% not well).
1.3% of residents speak other Indo-European language at home (32% very well, 29% well, 39% not well).
1.9% of residents speak Asian or Pacific Island language at home (71% very well, 19% well, 10% not well).
0.2% of residents speak other language at home (100% very well).
Foreign born population: 555 (3.2%) (48.9% of them are naturalized citizens)
Facilities with environmental interests located in this zip code:
AKRON PORCELAIN CO CORY AVE PLANT * (2719 CORY AVENUE in AKRON, OH)
AIR MINOR (AIRS/AFS) STATE MASTER (Ohio general info) - AIR MAJOR STATE MASTER (Ohio general info) - PCS-OH0051861, National Pollutant Discharge Elimination System Permit Business SIC classification: PORCELAIN ELECTRICAL SUPPLIES Alternative names: AKRON PORCELAIN & PLASTICS CO *
AKRO-MILS INC (880 WEST WATERLOO ROAD in AKRON, OH)
AIR MAJOR (AIRS/AFS) STATE MASTER (Ohio general info) - AIR MAJOR Large Quantity Generators, more that 1000 kg of hazardous waste/month (Resource Conservation and Recovery Act (tracking hazardous waste)) - notification Business SIC classification: COATING, ENGRAVING, AND ALLIED SERVICES Alternative names: MYERS INDUSTRIES AKRO MILS INC DIV
ALUMINUM WAREHOUSE THE (749 W WATERLOO RD in AKRON, OH)
STATE MASTER (Ohio general info) - RCRA-OHR000041533, HAZARDOUS WASTE PROGRAM (Resource Conservation and Recovery Act (tracking hazardous waste)) Organizations: POLLOCK TRUST (CONTACT/OWNER)
AKRON FOUNDRY CO (2728 WINGATE AVE. in AKRON, OH)
COMPLIANCE ACTIVITY (Tracking inspections of insecticide, fungicide, and rodenticide, and toxic substances) STATE MASTER (Ohio general info) - AIR MAJOR, EPCRA TRI REPORTER (Tracking of toxic chemicals releasing facilities) Business SIC classification: ALUMINUM DIE-CASTINGS; ALUMINUM FOUNDRIES
BARMET INDUSTRIES INC (753 WEST WATERLOO ROAD in AKRON, OH)
STATE MASTER (Ohio general info) - AIR MAJOR (Resource Conservation and Recovery Act (tracking hazardous waste)) Organizations: BARMET ALUMINUM CORP (CONTACT/OWNER)
Alternative names: BARMET ALUMINUM CORP
ALLIED PRINTING CO (1414 KENMORE BLVD in AKRON, OH)
AIR MINOR (AIRS/AFS) STATE MASTER (Ohio general info) - AIR MAJOR
ALPHA TECHNOLOGIES (2689 WINGATE AV in AKRON, OH)
Conditionally Exempt Small Quantity Generators, less than 100 kg/month of hazardous waste (Resource Conservation and Recovery Act (tracking hazardous waste)) - notification Organizations: SCI LIMITED PARTNERSHIP IV (CONTACT/OWNER)
BP FACILITY #22480 (571 W WATERLOO RD in AKRON, OH)
Small Quantity Generators, between 100 kg and 1000 kg of hazardous waste/month (Resource Conservation and Recovery Act (tracking hazardous waste)) Organizations: BP PRODUCTS NORTH AMERICA INC (CONTACT/OPERATOR)
Housing units lacking complete plumbing facilities: 3.8% Housing units lacking complete kitchen facilities: 4.8%
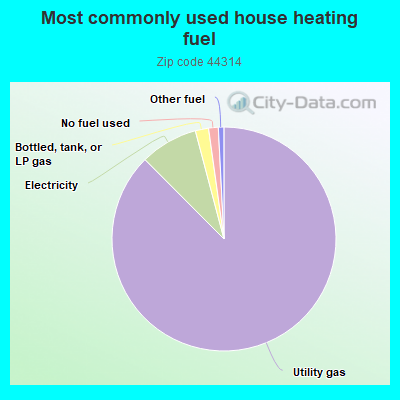
87.2%Utility gas
8.3%Electricity
1.9%Bottled, tank, or LP gas
1.4%No fuel used
0.8%Other fuel
Population in 1990: 21,289.
Place of birth for U.S.-born residents:
This state: 14,143
Northeast: 563
Midwest: 341
South: 1,508
West: 373
62% of the 44314 zip code residents lived in the same house 5 years ago. Out of people who lived in different houses, 81% lived in this county. Out of people who lived in different counties, 50% lived in Ohio.
89% of the 44314 zip code residents lived in the same house 1 year ago. Out of people who lived in different houses, 58% moved from this county. Out of people who lived in different houses, 22% moved from different county within same state. Out of people who lived in different houses, 14% moved from different state. Out of people who lived in different houses, 5% moved from abroad.
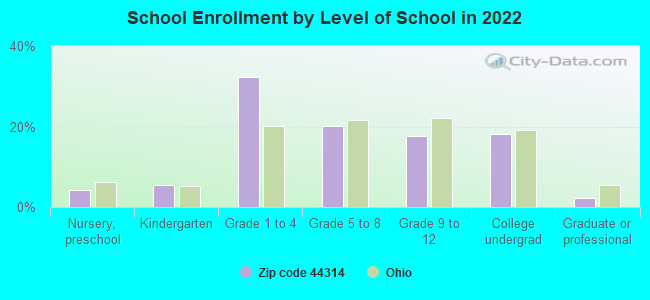
Private vs. public school enrollment:
Students in private schools in grades 1 to 8 (elementary and middle school): 301
Here:
15.0%
Ohio:
16.0%
Students in private schools in grades 9 to 12 (high school): 37
Here:
5.5%
Ohio:
13.1%
Students in private undergraduate colleges: 100
Here:
14.6%
Ohio:
22.3%
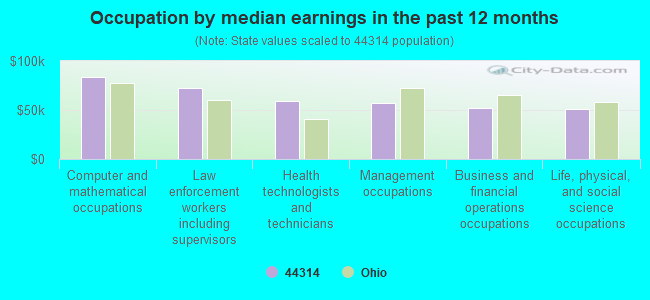
Occupation by median earnings in the past 12 months ($)
83,799Computer and mathematical occupations
72,038Law enforcement workers including supervisors
59,249Health technologists and technicians
57,059Management occupations
51,967Business and financial operations occupations
51,514Life, physical, and social science occupations
Companies with federal contracts located in this zip code:
ALPHA TECHNOLOGIES SERVICES LL (2689 WINGATE AVE in AKRON, OH) : $401,188 in 7 contractsfrom 2000 to 2005
Contracts for Physical Properties Testing and Inspection, Combination and Miscellaneous Instruments, Maintenance, Repair and Rebuilding of Equipment -- Instruments and Laboratory Equipment, ADP Software by Army, Air Force, Navy Signed by year:2000: $64,179; 2001: $0; 2002: $0; 2003: $0; 2004: $8,315; 2005: $328,694; 2006: $0.
Biggest contracts:
$168,872 with Army for Physical Properties Testing and Inspection. Signed on 2005-01-14. Completion date: 2005-03-18.
$168,872, same as above.Signed on 2005-02-08. Completion date: 2005-04-05.
$153,372 with Air Force for Physical Properties Testing and Inspection. Signed on 2005-09-29. Completion date: 2005-12-16.
$64,179 with Navy for Combination and Miscellaneous Instruments. Signed on 2000-04-13. Completion date: 2000-04-13.
CHAUNCEY D DAGUE (2450 26TH ST SW in AKRON, OH; small business) : $29,112 in 3 contractsfrom 1999 to 2002
$24,785 with Navy for Maintenance, Repair or Alteration of Real Property -- Other Non-Building Facilities. Signed on 1999-11-08. Completion date: 2000-05-31.
$4,808 with Navy for Maintenance, Repair or Alteration of Real Property -- Highways, Roads, Streets, Bridges, and Railways (includes resurfacing). Signed on 1999-11-08. Completion date: 2000-01-07.
-$481, same as above.Signed on 2002-03-22. Completion date: 2000-01-07.
Top industries in this zip code by the number of employees in 2005:
Administrative and Support and Waste Management and Remediation Services: Temporary Help Services (500-999 employees: 1 establishment)
Management of Companies and Enterprises: Corporate, Subsidiary, and Regional Managing Offices (100-249: 1, 1-4: 1)
Other Services (except Public Administration): Religious Organizations (50-99: 1, 20-49: 1, 10-19: 1, 5-9: 4, 1-4: 7)
Other Services (except Public Administration): Commercial and Industrial Machinery and Equipment (except Automotive and Electronic) Repair and Maintenance (50-99: 2, 1-4: 1)
2003 - 2018 National Fire Incident Reporting System (NFIRS) incidents
According to the data from the years 2003 - 2018 the average number of fires per year is 81. The highest number of reported fire incidents - 103 took place in 2005, and the least - 61 in 2010. The data has a decreasing trend.
When looking into fire subcategories, the most reports belonged to: Structure Fires (37.0%), and Outside Fires (34.4%).
Fire incident types reported to NFIRS in Zip Code 44314
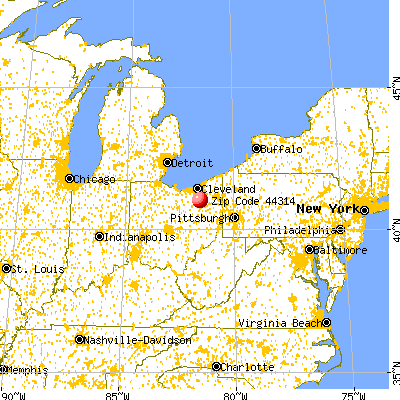


 Nearest zip codes: 44307, 44301, 44320, 44311, 44302, 44308.
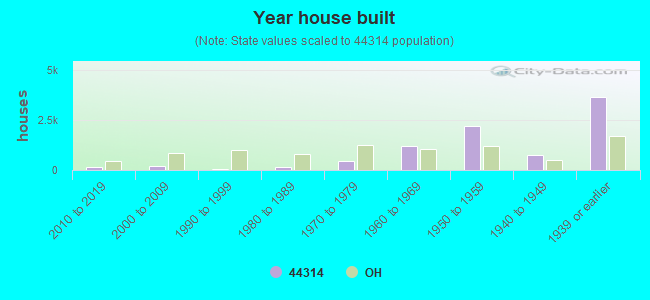


 According to the data from the years 2003 - 2018 the average number of fires per year is 81. The highest number of reported fire incidents - 103 took place in 2005, and the least - 61 in 2010. The data has a decreasing trend.
 When looking into fire subcategories, the most reports belonged to: Structure Fires (37.0%), and Outside Fires (34.4%).