Estimated zip code population in 2022: 5,441 Zip code population in 2010: 5,293 Zip code population in 2000: 4,993
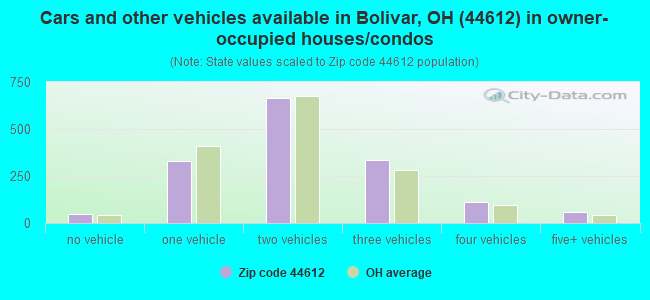
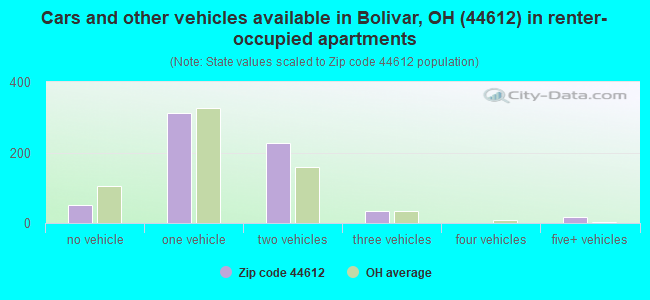
Houses and condos: 2,307 Renter-occupied apartments: 673
% of renters here:
30%
State:
33%
March 2022 cost of living index in zip code 44612: 77.8 (low, U.S. average is 100)
Land area: 25.7 sq. mi. Water area: 0.1 sq. mi.
Population density: 212 people per square mile
(very low).
OSM Map
General Map
Google Map
MSN Map
OSM Map
General Map
Google Map
MSN Map
OSM Map
General Map
Google Map
MSN Map
OSM Map
General Map
Google Map
MSN Map
Please wait while loading the map...
Real estate property taxes paid for housing units in 2022:
This zip code:
1.1% ($2,874)
Ohio:
1.3% ($2,639)
Median real estate property taxes paid for housing units with mortgages in 2022: $2,913 (1.1%) Median real estate property taxes paid for housing units with no mortgage in 2022: $2,823 (1.2%)
Business Search- 14 Million verified businesses
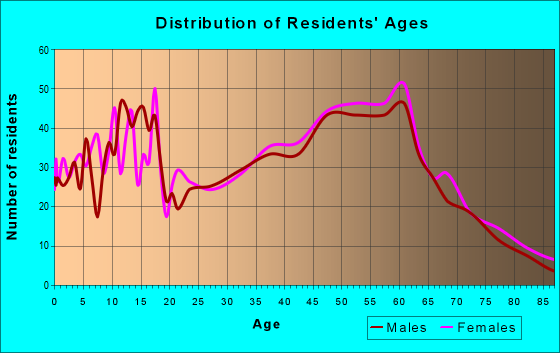
Males: 2,689
(49.4%)
Females: 2,751
(50.6%)
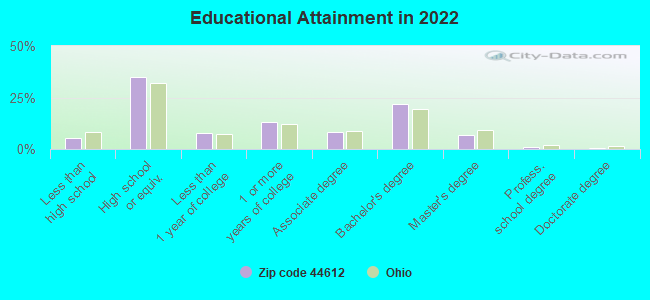
For population 25 years and over in 44612:
High school or higher: 94.3%
Bachelor's degree or higher: 30.1%
Graduate or professional degree: 8.3%
Unemployed: 1.6%
Mean travel time to work (commute): 23.4 minutes
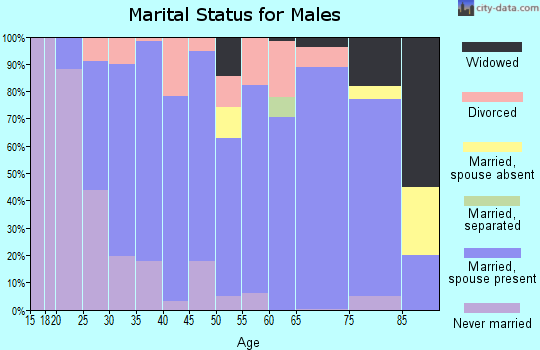
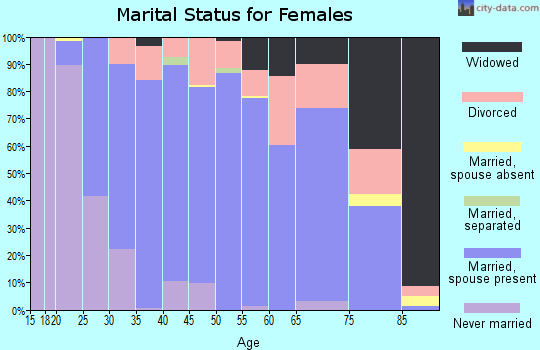
For population 15 years and over in 44612:
Never married: 24.3%
Now married: 55.2%
Separated: 0.7%
Widowed: 5.4%
Divorced: 14.4%
Zip code 44612 compared to state average:
Unemployed percentage below state average.
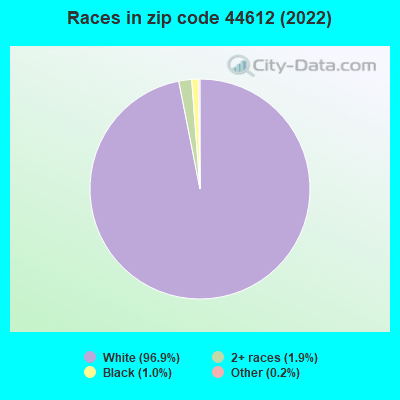
Black race population percentage significantly below state average.
Hispanic race population percentage significantly below state average.
Median age above state average.
Foreign-born population percentage significantly below state average.
Estimated median house/condo value in 2022: $260,330
44612:
$260,330
Ohio:
$204,100
According to our research of Ohio and other state lists, there were 7 registered sex offenders living in 44612 zip code as of May 12, 2024. The ratio of all residents to sex offenders in zip code 44612 is 793 to 1. The ratio of registered sex offenders to all residents in this zip code is lower than the state average.
Median resident age:
This zip code:
45.3 years
Ohio median age:
39.9 years
Average household size:
This zip code:
2.4 people
Ohio:
2.4 people
Averages for the 2020 tax year for zip code 44612, filed in 2021:
Average Adjusted Gross Income (AGI) in 2020: $68,998 (Individual Income Tax Returns)
Here:
$68,998
State:
$67,288
Salary/wage: $57,426 (reported on 82.7% of returns)
Here:
$57,426
State:
$55,628
(% of AGI for various income ranges: 1207.3% for AGIs below $25k, 3492.4% for AGIs $25k-50k, 6213.8% for AGIs $50k-75k, 9358.2% for AGIs $75k-100k, 15332.5% for AGIs $100k-200k, 59836.7% for AGIs over 200k)
Taxable interest for individuals: $971 (reported on 31.2% of returns)
This zip code:
$971
Ohio:
$1,518
(% of AGI for various income ranges: 13.7% for AGIs below $25k, 13.8% for AGIs $25k-50k, 25.0% for AGIs $50k-75k, 29.5% for AGIs $75k-100k, 48.9% for AGIs $100k-200k, 1263.3% for AGIs over 200k)
Ordinary dividends: $4,282 (reported on 19.2% of returns)
Here:
$4,282
State:
$7,167
(% of AGI for various income ranges: 20.2% for AGIs below $25k, 35.8% for AGIs $25k-50k, 55.0% for AGIs $50k-75k, 181.8% for AGIs $75k-100k, 237.5% for AGIs $100k-200k, 2160.0% for AGIs over 200k)
Net capital gain/loss in AGI: +$9,551 (reported on 16.9% of returns)
Here:
+$9,551
State:
+$18,919
(% of AGI for various income ranges: 7.1% for AGIs below $25k, 33.4% for AGIs $25k-50k, 55.0% for AGIs $50k-75k, 170.9% for AGIs $75k-100k, 186.8% for AGIs $100k-200k, 10026.7% for AGIs over 200k)
Profit/loss from business: +$13,775 (reported on 12.0% of returns)
Here:
+$13,775
State:
+$13,744
(% of AGI for various income ranges: 17.1% for AGIs below $25k, 118.6% for AGIs $25k-50k, 158.8% for AGIs $50k-75k, 301.8% for AGIs $75k-100k, 477.1% for AGIs $100k-200k, 3953.3% for AGIs over 200k)
Taxable individual retirement arrangement distribution: $15,594 (reported on 12.4% of returns)
44612:
$15,594
Ohio:
$18,876
(% of AGI for various income ranges: 63.3% for AGIs below $25k, 153.4% for AGIs $25k-50k, 226.8% for AGIs $50k-75k, 416.8% for AGIs $75k-100k, 843.6% for AGIs $100k-200k)
Total itemized deductions: $35,533 (reported on 4.5% of returns)
Here:
$35,533
State:
$33,869
(% of AGI for various income ranges: 362.6% for AGIs $50k-75k, 249.1% for AGIs $75k-100k, 293.6% for AGIs $100k-200k, 5536.7% for AGIs over 200k)
Charity contributions: $14,388 (reported on 3.0% of returns)
Here:
$14,388
State:
$14,577
(% of AGI for various income ranges: 75.6% for AGIs $50k-75k, 90.7% for AGIs $100k-200k, 2133.3% for AGIs over 200k)
Taxes paid: $6,250 (reported on 4.5% of returns)
44612:
$6,250
State:
$7,681
(% of AGI for various income ranges: 51.8% for AGIs $50k-75k, 55.5% for AGIs $75k-100k, 73.6% for AGIs $100k-200k, 820.0% for AGIs over 200k)
Earned income credit: $1,965 (reported on 9.8% of returns)
Here:
$1,965
State:
$2,304
(% of AGI for various income ranges: 55.4% for AGIs below $25k, 44.6% for AGIs $25k-50k)
Percentage of individuals using paid preparers for their 2020 taxes: 95.1%
Here:
95%
State:
94%
(% for various income ranges: 94.2% for AGIs below $25k, 93.9% for AGIs $25k-50k, 95.7% for AGIs $50k-75k, 96.9% for AGIs $75k-100k, 95.3% for AGIs $100k-200k, 100.0% for AGIs over 200k)
Averages for the 2012 tax year for zip code 44612, filed in 2013:
Average Adjusted Gross Income (AGI) in 2012: $57,007 (Individual Income Tax Returns)
Here:
$57,007
State:
$54,926
Salary/wage: $48,480 (reported on 85.2% of returns)
Here:
$48,480
State:
$45,869
(% of AGI for various income ranges: 74.2% for AGIs below $25k, 78.2% for AGIs $25k-50k, 76.2% for AGIs $50k-75k, 82.1% for AGIs $75k-100k, 80.5% for AGIs $100k-200k, 42.1% for AGIs over 200k)
Taxable interest for individuals: $804 (reported on 34.8% of returns)
This zip code:
$804
Ohio:
$1,297
(% of AGI for various income ranges: 1.0% for AGIs below $25k, 0.5% for AGIs $25k-50k, 0.5% for AGIs $50k-75k, 0.2% for AGIs $75k-100k, 0.3% for AGIs $100k-200k, 0.8% for AGIs over 200k)
Ordinary dividends: $2,898 (reported on 20.1% of returns)
Here:
$2,898
State:
$5,821
(% of AGI for various income ranges: 1.3% for AGIs below $25k, 0.5% for AGIs $25k-50k, 0.9% for AGIs $50k-75k, 0.9% for AGIs $75k-100k, 1.3% for AGIs $100k-200k, 1.3% for AGIs over 200k)
Net capital gain/loss in AGI: +$4,880 (reported on 15.2% of returns)
Here:
+$4,880
State:
+$11,232
(% of AGI for various income ranges: 0.6% for AGIs $50k-75k, 0.5% for AGIs $75k-100k, 1.4% for AGIs $100k-200k, 4.6% for AGIs over 200k)
Profit/loss from business: +$7,774 (reported on 11.7% of returns)
Here:
+$7,774
State:
+$12,773
(% of AGI for various income ranges: 3.7% for AGIs below $25k, 1.7% for AGIs $25k-50k, 2.4% for AGIs $50k-75k, 1.2% for AGIs $75k-100k, 1.9% for AGIs $100k-200k)
Taxable individual retirement arrangement distribution: $12,837 (reported on 11.4% of returns)
44612:
$12,837
Ohio:
$14,511
(% of AGI for various income ranges: 3.0% for AGIs below $25k, 2.8% for AGIs $25k-50k, 2.8% for AGIs $50k-75k, 2.7% for AGIs $75k-100k, 3.9% for AGIs $100k-200k)
Total itemized deductions: $17,804 (17% of AGI, reported on 31.1% of returns)
Here:
$17,804
State:
$21,278
Here:
17.1% of AGI
State:
18.8% of AGI
(% of AGI for various income ranges: 4.9% for AGIs below $25k, 7.3% for AGIs $25k-50k, 9.2% for AGIs $50k-75k, 11.6% for AGIs $75k-100k, 11.6% for AGIs $100k-200k, 9.8% for AGIs over 200k)
Charity contributions: $3,885 (reported on 23.5% of returns)
Here:
$3,885
State:
$3,943
(% of AGI for various income ranges: 0.4% for AGIs below $25k, 0.9% for AGIs $25k-50k, 1.2% for AGIs $50k-75k, 1.9% for AGIs $75k-100k, 2.1% for AGIs $100k-200k, 2.1% for AGIs over 200k)
Taxes paid: $7,215 (reported on 31.1% of returns)
44612:
$7,215
State:
$9,568
(% of AGI for various income ranges: 1.2% for AGIs below $25k, 2.0% for AGIs $25k-50k, 3.0% for AGIs $50k-75k, 4.3% for AGIs $75k-100k, 5.1% for AGIs $100k-200k, 5.8% for AGIs over 200k)
Earned income credit: $1,893 (reported on 11.4% of returns)
Here:
$1,893
State:
$2,285
(% of AGI for various income ranges: 4.1% for AGIs below $25k, 0.6% for AGIs $25k-50k)
Percentage of individuals using paid preparers for their 2012 taxes: 51.5%
Here:
52%
State:
51%
(% for various income ranges: 41.9% for AGIs below $25k, 52.2% for AGIs $25k-50k, 55.8% for AGIs $50k-75k, 56.2% for AGIs $75k-100k, 63.0% for AGIs $100k-200k, 71.4% for AGIs over 200k)
Averages for the 2004 tax year for zip code 44612, filed in 2005:
Average Adjusted Gross Income (AGI) in 2004: $45,434 (Individual Income Tax Returns)
Here:
$45,434
State:
$44,480
Salary/wage: $41,842 (reported on 87.8% of returns)
Here:
$41,842
State:
$39,198
(% of AGI for various income ranges: 118.3% for AGIs below $10k, 73.6% for AGIs $10k-25k, 81.0% for AGIs $25k-50k, 86.4% for AGIs $50k-75k, 85.5% for AGIs $75k-100k, 72.6% for AGIs over 100k)
Taxable interest for individuals: $982 (reported on 48.8% of returns)
This zip code:
$982
Ohio:
$1,532
(% of AGI for various income ranges: 4.4% for AGIs below $10k, 2.3% for AGIs $10k-25k, 0.9% for AGIs $25k-50k, 0.7% for AGIs $50k-75k, 0.6% for AGIs $75k-100k, 1.2% for AGIs over 100k)
Taxable dividends: $2,115 (reported on 23.1% of returns)
Here:
$2,115
State:
$3,496
(% of AGI for various income ranges: 2.5% for AGIs below $10k, 1.3% for AGIs $10k-25k, 1.0% for AGIs $25k-50k, 1.0% for AGIs $50k-75k, 0.5% for AGIs $75k-100k, 1.4% for AGIs over 100k)
Net capital gain/loss: +$4,308 (reported on 17.6% of returns)
Here:
+$4,308
State:
+$8,582
(% of AGI for various income ranges: 2.5% for AGIs below $10k, 0.2% for AGIs $10k-25k, 0.5% for AGIs $25k-50k, 0.8% for AGIs $50k-75k, 0.9% for AGIs $75k-100k, 4.5% for AGIs over 100k)
Profit/loss from business: +$8,661 (reported on 13.2% of returns)
Here:
+$8,661
State:
+$10,813
(% of AGI for various income ranges: -2.7% for AGIs below $10k, 3.2% for AGIs $10k-25k, 1.8% for AGIs $25k-50k, 1.4% for AGIs $50k-75k, 1.9% for AGIs $75k-100k, 4.7% for AGIs over 100k)
IRA payment deduction: $2,955 (reported on 2.6% of returns)
44612:
$2,955
Ohio:
$2,794
Self-employed pension: $12,333 (reported on 0.5% of returns)
Here:
$12,333
Ohio:
$13,981
Total itemized deductions: $15,140 (20% of AGI, reported on 37.7% of returns)
Here:
$15,140
State:
$17,503
Here:
19.8% of AGI
State:
20.8% of AGI
(% of AGI for various income ranges: 13.3% for AGIs below $10k, 7.2% for AGIs $10k-25k, 10.5% for AGIs $25k-50k, 13.8% for AGIs $50k-75k, 14.6% for AGIs $75k-100k, 13.6% for AGIs over 100k)
Charity contributions deductions: $2,597 (3% of AGI, reported on 31.9% of returns)
Here:
$2,597
State:
$3,087
Here:
3.3% of AGI
State:
3.4% of AGI
(% of AGI for various income ranges: 1.0% for AGIs $10k-25k, 1.3% for AGIs $25k-50k, 1.8% for AGIs $50k-75k, 2.1% for AGIs $75k-100k, 2.4% for AGIs over 100k)
Total tax: $5,959 (reported on 80.1% of returns)
44612:
$5,959
State:
$6,781
(% of AGI for various income ranges: 1.9% for AGIs below $10k, 4.6% for AGIs $10k-25k, 7.4% for AGIs $25k-50k, 8.3% for AGIs $50k-75k, 10.2% for AGIs $75k-100k, 18.2% for AGIs over 100k)
Earned income credit: $1,582 (reported on 9.4% of returns)
Here:
$1,582
State:
$1,696
Percentage of individuals using paid preparers for their 2004 taxes: 55.0%
Here:
55%
State:
55%
(% for various income ranges: 40.9% for AGIs below $10k, 57.7% for AGIs $10k-25k, 59.1% for AGIs $25k-50k, 53.0% for AGIs $50k-75k, 57.5% for AGIs $75k-100k, 65.2% for AGIs over 100k)
Household received Food Stamps/SNAP in the past 12 months: 232 Household did not receive Food Stamps/SNAP in the past 12 months: 1,993
Women who had a birth in the past 12 months: 62 (33 now married, 28 unmarried) Women who did not have a birth in the past 12 months: 1,062 (513 now married, 548 unmarried)
Housing units in zip code 44612 with a mortgage: 966 (99 second mortgage, 87 both second mortgage and home equity loan) Houses without a mortgage: 44
Median monthly owner costs for units with a mortgage: $1,401 Median monthly owner costs for units without a mortgage: $581
Residents with income below the poverty level in 2022:
This zip code:
5.0%
Whole state:
13.4%
Residents with income below 50% of the poverty level in 2022:
This zip code:
2.4%
Whole state:
7.0%
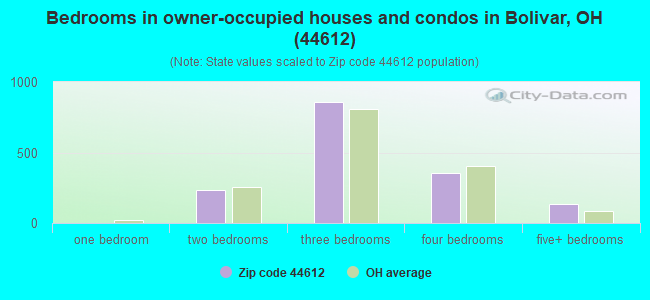
Median number of rooms in houses and condos:
Here:
7.1
State:
6.7
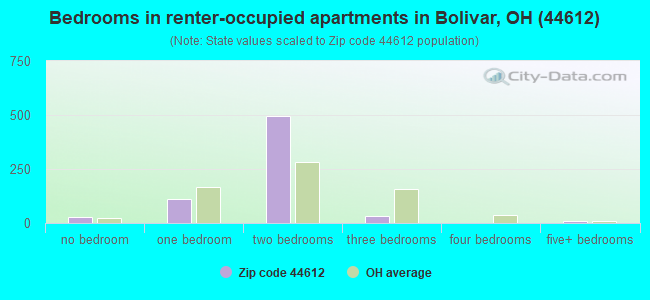
Median number of rooms in apartments:
Here:
4.2
State:
4.4
Notable locations in this zip code not listed on our city pages
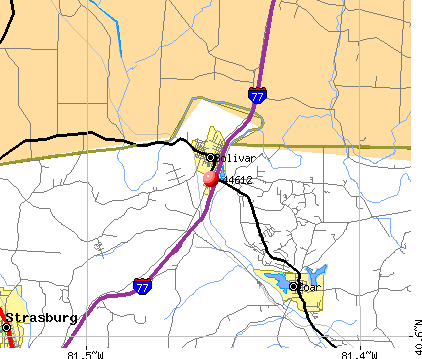
Churches in zip code 44612 include: Dover Bethel Chapel (A), Saint Peters Church (B), Bolivar United Methodist Church (C), Saint John United Church of Christ (D), Saint Pauls Evangelical Lutheran Church (E). Display/hide their locations on the map
Cemeteries: Saint Peters Catholic Cemetery (1), Blough Cemetery (2), Saint Stephens Cemetery (3), Fort Laurens Cemetery (4), Kline Grove Cemetery (5), Zutavern Cemetery (6). Display/hide their locations on the map
In group quarters: 141 (-1 institutionalized population)
Size of family households: 703 2-persons, 283 3-persons, 290 4-persons, 67 5-persons, 32 6-persons, 52 7-or-more-persons
Size of nonfamily households: 671 1-person, 118 2-persons, 2 4-persons
727 married couples with children.
141 single-parent households (141 women).
98.4% of residents of 44612 zip code speak English at home.
0.4% of residents speak Spanish at home (100% very well).
1.2% of residents speak other Indo-European language at home (69% very well, 27% well, 3% not well).
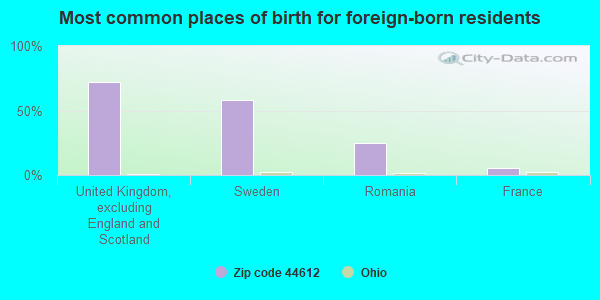
Foreign born population: 41 (0.8%) (39.5% of them are naturalized citizens)
This zip code:
0.8%
Whole state:
5.0%
66%Sweden
61%United Kingdom, excluding England and Scotland
27%Romania
5%France
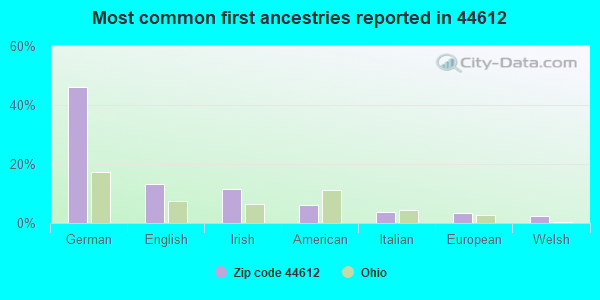
46%German
13%English
12%Irish
6%American
4%Italian
3%European
2%Welsh
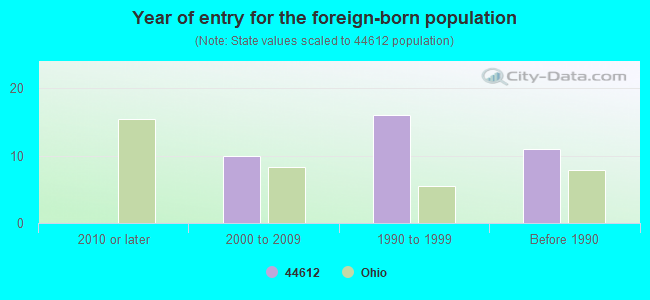
Year of entry for the foreign-born population
02010 or later
102000 to 2009
161990 to 1999
11Before 1990
Facilities with environmental interests located in this zip code:
AJ WEIGAND INC * (8870 SAINT PETERS CHURCH ROAD NORTHWEST in BOLIVAR, OH)
STATE MASTER (Ohio general info) - RCRA-OHT400013082, HAZARDOUS WASTE PROGRAM, AIR MAJOR, EPCRA Conditionally Exempt Small Quantity Generators, less than 100 kg/month of hazardous waste (Resource Conservation and Recovery Act (tracking hazardous waste)) HAZARDOUS WASTE BIENNIAL REPORTER (Resource Conservation and Recovery Act (tracking hazardous waste)) TSD (Resource Conservation and Recovery Act (tracking hazardous waste)) - notification Organizations: A J WEIGAND INC (CONTACT/OPERATOR)
, BLUFF TERMINAL CO (CONTACT/OWNER)
Alternative names: A J WEIGAND INCORPORATED, WEIGAND A J INC
BOLIVAR BLOCK PLANT (509 WATER STREET in BOLIVAR, OH)
AIR MINOR (AIRS/AFS) (Resource Conservation and Recovery Act (tracking hazardous waste)) Business SIC classification: ABRASIVE PRODUCTS Organizations: US TECHNOLOGY CORPORATION (CONTACT/OWNER)
Housing units lacking complete plumbing facilities: 1.4% Housing units lacking complete kitchen facilities: 1.7%
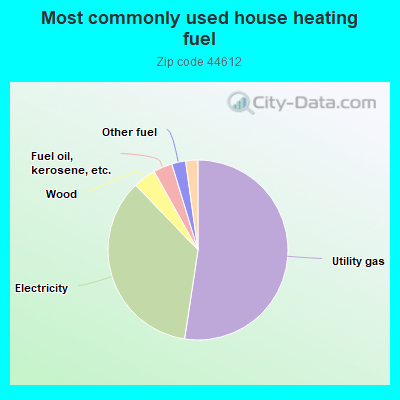
52.5%Utility gas
35.5%Electricity
4.1%Wood
3.4%Fuel oil, kerosene, etc.
2.5%Other fuel
2.2%Bottled, tank, or LP gas
Population in 1990: 4,225. Population change in the 1990s: +768 (+18.2%).
Place of birth for U.S.-born residents:
This state: 4,727
Northeast: 112
Midwest: 111
South: 284
West: 159
57% of the 44612 zip code residents lived in the same house 5 years ago. Out of people who lived in different houses, 52% lived in this county. Out of people who lived in different counties, 50% lived in Ohio.
93% of the 44612 zip code residents lived in the same house 1 year ago. Out of people who lived in different houses, 58% moved from this county. Out of people who lived in different houses, 38% moved from different county within same state. Out of people who lived in different houses, 5% moved from different state.
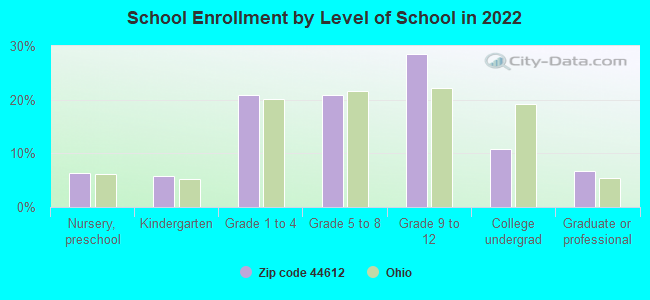
Private vs. public school enrollment:
Students in private schools in grades 1 to 8 (elementary and middle school): 123
Here:
27.4%
Ohio:
16.0%
Students in private schools in grades 9 to 12 (high school): 38
Here:
12.7%
Ohio:
13.1%
Students in private undergraduate colleges: 17
Here:
15.2%
Ohio:
22.3%
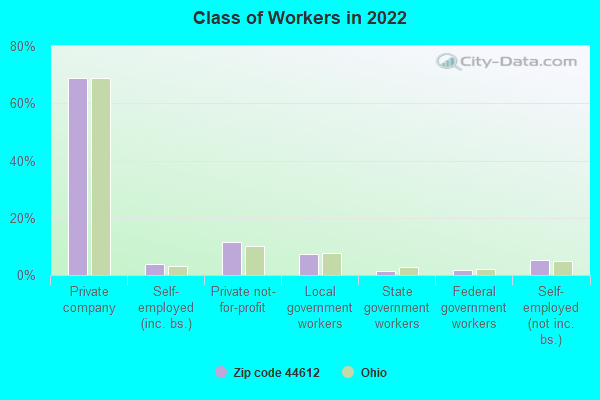
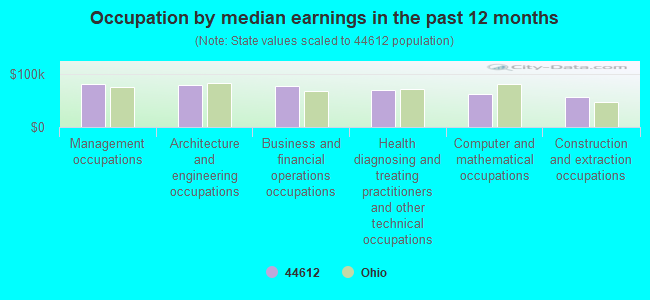
Occupation by median earnings in the past 12 months ($)
80,822Management occupations
80,174Architecture and engineering occupations
77,978Business and financial operations occupations
70,017Health diagnosing and treating practitioners and other technical occupations
63,250Computer and mathematical occupations
57,773Construction and extraction occupations
Companies with federal contracts located in this zip code:
HARRIS BATTERY CO INC (10708 INDUSTRIAL PKWY NW in BOLIVAR, OH; small business)
$3,017 with Defense Logistics Agency for Batteries, Nonrechargeable. Signed on 2005-04-25. Completion date: 2005-05-02.
COMMERCIAL INDUSTRIAL CONSTRUC (400 EAST ST SW in BOLIVAR, OH; small business) : -$906,230 in 5 contractsfrom 2000 to 2001
Contracts for Maintenance, Repair or Alteration of Real Property -- Troop Housing Facilities, Maintenance, Repair or Alteration of Real Property -- Recreational Buildings, Maintenance, Repair or Alteration of Real Property -- Family Housing Facilities by Army, Navy, Air Force Signed by year:2000: -$938,206; 2001: $31,976; 2002: $0; 2003: $0; 2004: $0; 2005: $0; 2006: $0.
Biggest contracts:
$31,976 with Army for Maintenance, Repair or Alteration of Real Property -- Troop Housing Facilities. Taking place in SC. Signed on 2001-04-02. Completion date: 2001-09-30.
$2,835 with Navy for Maintenance, Repair or Alteration of Real Property -- Recreational Buildings. Taking place in NC. Signed on 2000-03-16. Completion date: 1998-10-16.
$2,057 with Air Force for Maintenance, Repair or Alteration of Real Property -- Family Housing Facilities. Taking place in NC. Signed on 2000-06-27. Completion date: 2000-02-29.
-$311,503 with Army for Maintenance, Repair or Alteration of Real Property -- Troop Housing Facilities. Taking place in SC. Signed on 2000-04-24. Completion date: 1999-11-16.
Top industries in this zip code by the number of employees in 2005:
Health Care and Social Assistance: Nursing Care Facilities (100-249 employees: 1 establishment)
Health Care and Social Assistance: Child Day Care Services (20-49: 1, 10-19: 1, 5-9: 1)
Other Services (except Public Administration): Commercial and Industrial Machinery and Equipment (except Automotive and Electronic) Repair and Maintenance (20-49: 1, 10-19: 1, 1-4: 1)
People in group quarters in 2010:
95 people in nursing facilities/skilled-nursing facilities
10 people in group homes intended for adults
People in group quarters in 2000:
5 people in homes for the mentally retarded
5 people in other group homes
Fatal accident statistics in 2012:
Fatal accident count: 2
Vehicles involved in fatal accidents: 3
Fatal accidents caused by drunken drivers: 2
Fatalities: 2
Persons involved in fatal accidents: 3
Pedestrians involved in fatal accidents: 0
Fatal accident statistics in 2011:
Fatal accident count: 1
Vehicles involved in fatal accidents: 1
Fatal accidents caused by drunken drivers: 0
Fatalities: 1
Persons involved in fatal accidents: 1
Pedestrians involved in fatal accidents: 0
Home Mortgage Disclosure Act Aggregated Statistics For Year 2009 (Based on 2 partial tracts)
A) FHA, FSA/RHS & VA Home Purchase Loans
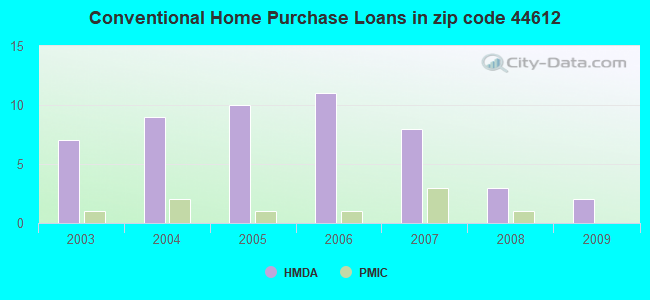
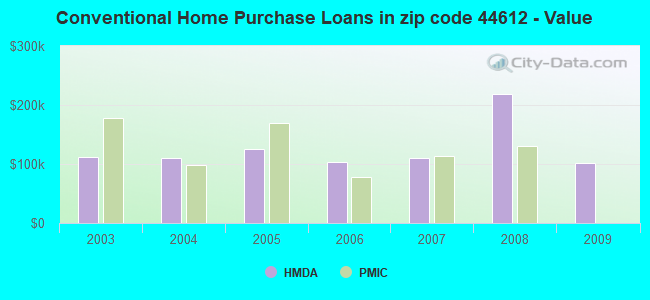
B) Conventional Home Purchase Loans
C) Refinancings
D) Home Improvement Loans
G) Loans On Manufactured Home Dwelling (A B C & D)
Number
Average Value
Number
Average Value
Number
Average Value
Number
Average Value
Number
Average Value
LOANS ORIGINATED
2
$91,465
2
$101,145
16
$119,063
2
$53,255
1
$53,940
APPLICATIONS APPROVED, NOT ACCEPTED
0
$0
1
$125,530
1
$196,070
0
$0
0
$0
APPLICATIONS DENIED
1
$118,610
1
$40,460
9
$149,770
2
$23,685
2
$39,250
APPLICATIONS WITHDRAWN
0
$0
0
$0
2
$211,455
0
$0
0
$0
FILES CLOSED FOR INCOMPLETENESS
0
$0
0
$0
0
$0
0
$0
0
$0
Aggregated Statistics For Year 2008 (Based on 2 partial tracts)
A) FHA, FSA/RHS & VA Home Purchase Loans
B) Conventional Home Purchase Loans
C) Refinancings
D) Home Improvement Loans
G) Loans On Manufactured Home Dwelling (A B C & D)
Number
Average Value
Number
Average Value
Number
Average Value
Number
Average Value
Number
Average Value
LOANS ORIGINATED
1
$122,410
3
$218,430
11
$152,498
3
$30,547
1
$68,470
APPLICATIONS APPROVED, NOT ACCEPTED
0
$0
0
$0
3
$176,820
0
$0
0
$0
APPLICATIONS DENIED
0
$0
1
$286,320
12
$122,010
2
$51,350
3
$37,117
APPLICATIONS WITHDRAWN
0
$0
1
$148,690
4
$147,658
0
$0
0
$0
FILES CLOSED FOR INCOMPLETENESS
0
$0
0
$0
0
$0
0
$0
0
$0
Aggregated Statistics For Year 2007 (Based on 2 partial tracts)
B) Conventional Home Purchase Loans
C) Refinancings
D) Home Improvement Loans
F) Non-occupant Loans on < 5 Family Dwellings (A B C & D)
G) Loans On Manufactured Home Dwelling (A B C & D)
Number
Average Value
Number
Average Value
Number
Average Value
Number
Average Value
Number
Average Value
LOANS ORIGINATED
8
$110,829
11
$134,611
2
$30,950
1
$91,640
1
$65,360
APPLICATIONS APPROVED, NOT ACCEPTED
0
$0
3
$146,503
0
$0
0
$0
1
$21,090
APPLICATIONS DENIED
2
$61,550
13
$175,480
2
$43,745
0
$0
1
$32,160
APPLICATIONS WITHDRAWN
1
$82,990
3
$133,593
1
$67,090
0
$0
0
$0
FILES CLOSED FOR INCOMPLETENESS
0
$0
2
$193,130
0
$0
0
$0
0
$0
Aggregated Statistics For Year 2006 (Based on 2 partial tracts)
B) Conventional Home Purchase Loans
C) Refinancings
D) Home Improvement Loans
F) Non-occupant Loans on < 5 Family Dwellings (A B C & D)
G) Loans On Manufactured Home Dwelling (A B C & D)
Number
Average Value
Number
Average Value
Number
Average Value
Number
Average Value
Number
Average Value
LOANS ORIGINATED
11
$103,143
14
$103,469
2
$57,750
1
$270,420
2
$67,260
APPLICATIONS APPROVED, NOT ACCEPTED
1
$48,410
2
$82,130
0
$0
0
$0
0
$0
APPLICATIONS DENIED
3
$72,617
8
$107,328
5
$16,390
1
$5,190
3
$25,703
APPLICATIONS WITHDRAWN
2
$92,845
4
$125,612
1
$32,850
0
$0
2
$81,435
FILES CLOSED FOR INCOMPLETENESS
0
$0
1
$176,360
0
$0
0
$0
0
$0
Aggregated Statistics For Year 2005 (Based on 2 partial tracts)
A) FHA, FSA/RHS & VA Home Purchase Loans
B) Conventional Home Purchase Loans
C) Refinancings
D) Home Improvement Loans
F) Non-occupant Loans on < 5 Family Dwellings (A B C & D)
G) Loans On Manufactured Home Dwelling (A B C & D)
Number
Average Value
Number
Average Value
Number
Average Value
Number
Average Value
Number
Average Value
Number
Average Value
LOANS ORIGINATED
1
$128,640
10
$124,868
21
$114,888
2
$74,000
1
$50,490
1
$39,770
APPLICATIONS APPROVED, NOT ACCEPTED
0
$0
1
$52,220
3
$88,063
0
$0
0
$0
0
$0
APPLICATIONS DENIED
1
$76,420
3
$97,287
13
$134,463
5
$36,032
1
$8,640
2
$59,130
APPLICATIONS WITHDRAWN
0
$0
2
$113,075
12
$110,080
0
$0
1
$92,670
1
$84,720
FILES CLOSED FOR INCOMPLETENESS
0
$0
0
$0
3
$97,517
0
$0
0
$0
0
$0
Aggregated Statistics For Year 2004 (Based on 2 partial tracts)
B) Conventional Home Purchase Loans
C) Refinancings
D) Home Improvement Loans
F) Non-occupant Loans on < 5 Family Dwellings (A B C & D)
G) Loans On Manufactured Home Dwelling (A B C & D)
Number
Average Value
Number
Average Value
Number
Average Value
Number
Average Value
Number
Average Value
LOANS ORIGINATED
9
$109,926
16
$117,312
2
$48,410
1
$38,730
0
$0
APPLICATIONS APPROVED, NOT ACCEPTED
0
$0
3
$115,957
1
$69,160
0
$0
0
$0
APPLICATIONS DENIED
2
$128,810
14
$116,609
4
$32,938
0
$0
2
$37,520
APPLICATIONS WITHDRAWN
0
$0
6
$88,640
0
$0
0
$0
0
$0
FILES CLOSED FOR INCOMPLETENESS
0
$0
2
$148,865
0
$0
0
$0
0
$0
Aggregated Statistics For Year 2003 (Based on 2 partial tracts)
A) FHA, FSA/RHS & VA Home Purchase Loans
B) Conventional Home Purchase Loans
C) Refinancings
D) Home Improvement Loans
F) Non-occupant Loans on < 5 Family Dwellings (A B C & D)
Detailed PMIC statistics for the following Tracts:7148.02
2002 - 2018 National Fire Incident Reporting System (NFIRS) incidents
According to the data from the years 2002 - 2018 the average number of fires per year is 26. The highest number of reported fires - 41 took place in 2008, and the least - 12 in 2002. The data has a growing trend.
When looking into fire subcategories, the most reports belonged to: Structure Fires (44.7%), and Outside Fires (31.0%).
Fire incident types reported to NFIRS in Zip Code 44612
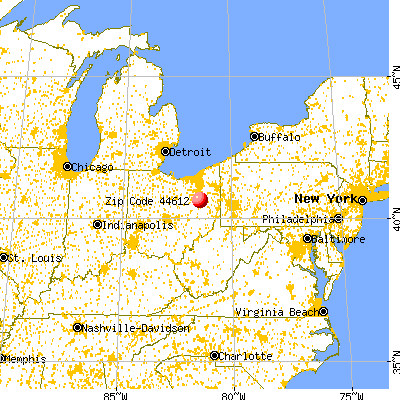


 Nearest zip codes: 44697, 44680, 44622, 44626, 44671, 44662.
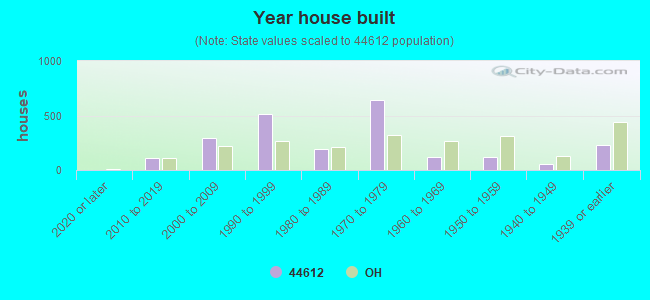


 According to the data from the years 2002 - 2018 the average number of fires per year is 26. The highest number of reported fires - 41 took place in 2008, and the least - 12 in 2002. The data has a growing trend.
 When looking into fire subcategories, the most reports belonged to: Structure Fires (44.7%), and Outside Fires (31.0%).