Estimated zip code population in 2022: 10,748 Zip code population in 2010: 9,765 Zip code population in 2000: 9,521
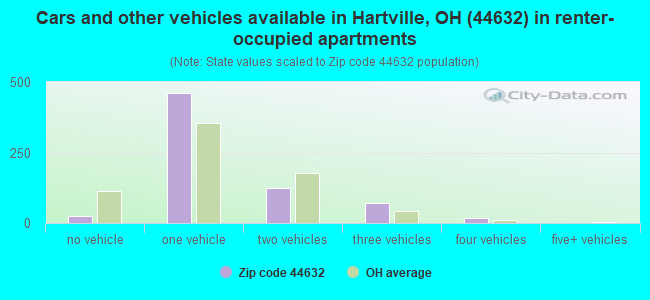
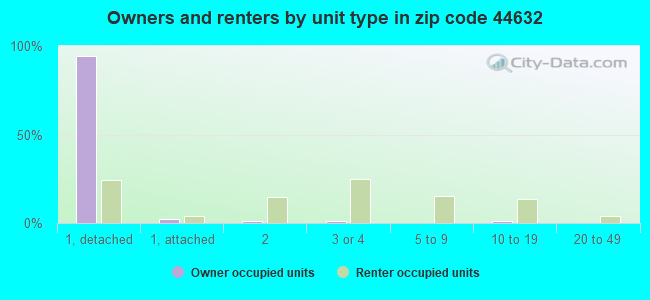
Houses and condos: 3,872 Renter-occupied apartments: 694
% of renters here:
18%
State:
33%
March 2022 cost of living index in zip code 44632: 90.1 (less than average, U.S. average is 100)
Land area: 27.4 sq. mi. Water area: 0.4 sq. mi.
Population density: 393 people per square mile
(very low).
OSM Map
General Map
Google Map
MSN Map
OSM Map
General Map
Google Map
MSN Map
OSM Map
General Map
Google Map
MSN Map
OSM Map
General Map
Google Map
MSN Map
Please wait while loading the map...
Real estate property taxes paid for housing units in 2022:
This zip code:
1.1% ($3,023)
Ohio:
1.3% ($2,639)
Median real estate property taxes paid for housing units with mortgages in 2022: $2,942 (1.1%) Median real estate property taxes paid for housing units with no mortgage in 2022: $3,210 (1.3%)
Business Search- 14 Million verified businesses
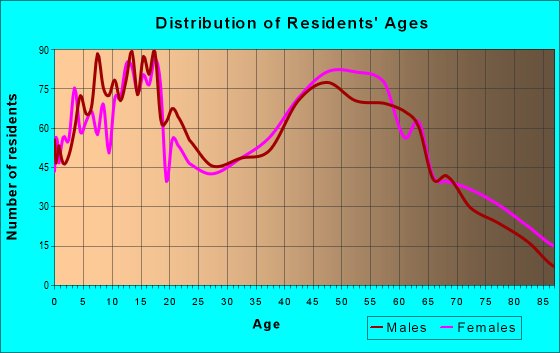
Males: 5,403
(50.3%)
Females: 5,345
(49.7%)
For population 25 years and over in 44632:
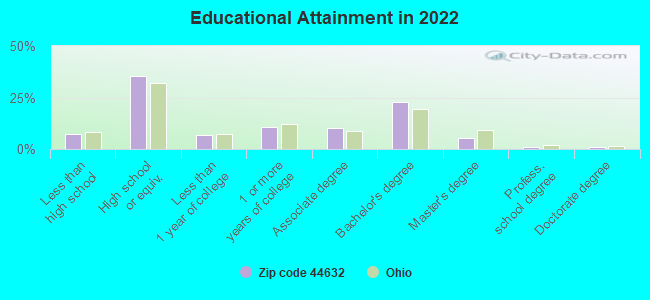
High school or higher: 92.4%
Bachelor's degree or higher: 30.0%
Graduate or professional degree: 7.5%
Unemployed: 3.3%
Mean travel time to work (commute): 27.1 minutes
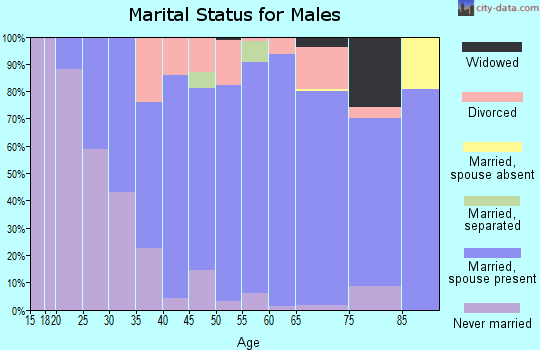
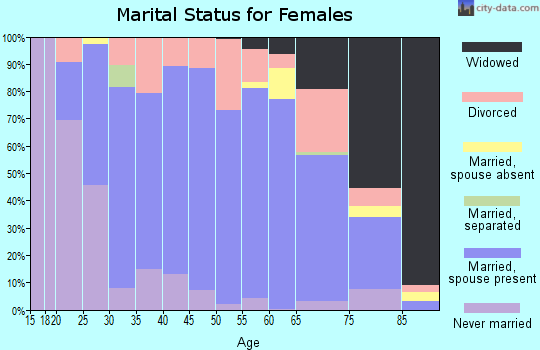
For population 15 years and over in 44632:
Never married: 30.1%
Now married: 52.6%
Separated: 0.4%
Widowed: 7.7%
Divorced: 9.3%
Zip code 44632 compared to state average:
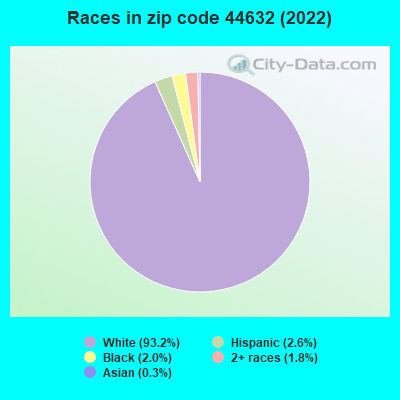
Black race population percentage significantly below state average.
Foreign-born population percentage significantly below state average.
Renting percentage below state average.
Length of stay since moving in above state average.
Estimated median house/condo value in 2022: $267,345
44632:
$267,345
Ohio:
$204,100
According to our research of Ohio and other state lists, there were 11 registered sex offenders living in 44632 zip code as of April 27, 2024. The ratio of all residents to sex offenders in zip code 44632 is 836 to 1. The ratio of registered sex offenders to all residents in this zip code is lower than the state average.
Median resident age:
This zip code:
41.0 years
Ohio median age:
39.9 years
Average household size:
This zip code:
2.7 people
Ohio:
2.4 people
Averages for the 2020 tax year for zip code 44632, filed in 2021:
Average Adjusted Gross Income (AGI) in 2020: $77,359 (Individual Income Tax Returns)
Here:
$77,359
State:
$67,288
Salary/wage: $60,002 (reported on 81.7% of returns)
Here:
$60,002
State:
$55,628
(% of AGI for various income ranges: 1228.0% for AGIs below $25k, 3768.4% for AGIs $25k-50k, 6441.4% for AGIs $50k-75k, 9447.2% for AGIs $75k-100k, 15925.4% for AGIs $100k-200k, 85258.6% for AGIs over 200k)
Taxable interest for individuals: $1,519 (reported on 30.6% of returns)
This zip code:
$1,519
Ohio:
$1,518
(% of AGI for various income ranges: 19.1% for AGIs below $25k, 26.6% for AGIs $25k-50k, 39.1% for AGIs $50k-75k, 50.8% for AGIs $75k-100k, 70.4% for AGIs $100k-200k, 1711.4% for AGIs over 200k)
Ordinary dividends: $8,712 (reported on 22.0% of returns)
Here:
$8,712
State:
$7,167
(% of AGI for various income ranges: 36.8% for AGIs below $25k, 38.4% for AGIs $25k-50k, 103.9% for AGIs $50k-75k, 171.4% for AGIs $75k-100k, 194.1% for AGIs $100k-200k, 9840.0% for AGIs over 200k)
Net capital gain/loss in AGI: +$12,675 (reported on 20.6% of returns)
Here:
+$12,675
State:
+$18,919
(% of AGI for various income ranges: 16.3% for AGIs below $25k, 29.4% for AGIs $25k-50k, 151.6% for AGIs $50k-75k, 208.9% for AGIs $75k-100k, 452.0% for AGIs $100k-200k, 12987.1% for AGIs over 200k)
Profit/loss from business: +$16,140 (reported on 18.5% of returns)
Here:
+$16,140
State:
+$13,744
(% of AGI for various income ranges: 136.4% for AGIs below $25k, 233.5% for AGIs $25k-50k, 248.2% for AGIs $50k-75k, 583.6% for AGIs $75k-100k, 499.3% for AGIs $100k-200k, 8410.0% for AGIs over 200k)
Taxable individual retirement arrangement distribution: $17,188 (reported on 11.7% of returns)
44632:
$17,188
Ohio:
$18,876
(% of AGI for various income ranges: 94.7% for AGIs below $25k, 143.8% for AGIs $25k-50k, 270.0% for AGIs $50k-75k, 314.4% for AGIs $75k-100k, 731.3% for AGIs $100k-200k, 2818.6% for AGIs over 200k)
Self-employed (Keogh) retirement plans: $25,300 (reported on 0.6% of returns)
44632:
$25,300
Ohio:
$24,898
(% of AGI for various income ranges: 165.0% for AGIs $100k-200k)
Total itemized deductions: $40,424 (reported on 6.7% of returns)
Here:
$40,424
State:
$33,869
(% of AGI for various income ranges: 150.4% for AGIs $25k-50k, 134.6% for AGIs $50k-75k, 277.2% for AGIs $75k-100k, 701.5% for AGIs $100k-200k, 10695.7% for AGIs over 200k)
Charity contributions: $16,519 (reported on 5.4% of returns)
Here:
$16,519
State:
$14,577
(% of AGI for various income ranges: 37.3% for AGIs $50k-75k, 80.0% for AGIs $75k-100k, 253.3% for AGIs $100k-200k, 3997.1% for AGIs over 200k)
Taxes paid: $7,668 (reported on 6.7% of returns)
44632:
$7,668
State:
$7,681
(% of AGI for various income ranges: 14.4% for AGIs $25k-50k, 32.9% for AGIs $50k-75k, 73.3% for AGIs $75k-100k, 201.5% for AGIs $100k-200k, 1585.7% for AGIs over 200k)
Earned income credit: $1,931 (reported on 9.7% of returns)
Here:
$1,931
State:
$2,304
(% of AGI for various income ranges: 54.0% for AGIs below $25k, 48.4% for AGIs $25k-50k)
Percentage of individuals using paid preparers for their 2020 taxes: 94.2%
Here:
94%
State:
94%
(% for various income ranges: 92.7% for AGIs below $25k, 94.8% for AGIs $25k-50k, 95.1% for AGIs $50k-75k, 94.5% for AGIs $75k-100k, 96.0% for AGIs $100k-200k, 92.6% for AGIs over 200k)
Averages for the 2012 tax year for zip code 44632, filed in 2013:
Average Adjusted Gross Income (AGI) in 2012: $58,861 (Individual Income Tax Returns)
Here:
$58,861
State:
$54,926
Salary/wage: $48,730 (reported on 83.6% of returns)
Here:
$48,730
State:
$45,869
(% of AGI for various income ranges: 73.6% for AGIs below $25k, 75.7% for AGIs $25k-50k, 75.6% for AGIs $50k-75k, 77.2% for AGIs $75k-100k, 71.9% for AGIs $100k-200k, 51.8% for AGIs over 200k)
Taxable interest for individuals: $1,755 (reported on 33.8% of returns)
This zip code:
$1,755
Ohio:
$1,297
(% of AGI for various income ranges: 1.1% for AGIs below $25k, 1.3% for AGIs $25k-50k, 0.7% for AGIs $50k-75k, 0.3% for AGIs $75k-100k, 1.1% for AGIs $100k-200k, 1.4% for AGIs over 200k)
Ordinary dividends: $5,563 (reported on 20.7% of returns)
Here:
$5,563
State:
$5,821
(% of AGI for various income ranges: 1.4% for AGIs below $25k, 1.0% for AGIs $25k-50k, 0.7% for AGIs $50k-75k, 1.0% for AGIs $75k-100k, 1.6% for AGIs $100k-200k, 4.5% for AGIs over 200k)
Net capital gain/loss in AGI: +$8,738 (reported on 17.2% of returns)
Here:
+$8,738
State:
+$11,232
(% of AGI for various income ranges: 0.4% for AGIs $25k-50k, 0.5% for AGIs $50k-75k, 0.4% for AGIs $75k-100k, 3.0% for AGIs $100k-200k, 7.0% for AGIs over 200k)
Profit/loss from business: +$14,487 (reported on 17.6% of returns)
Here:
+$14,487
State:
+$12,773
(% of AGI for various income ranges: 8.9% for AGIs below $25k, 3.8% for AGIs $25k-50k, 3.3% for AGIs $50k-75k, 2.2% for AGIs $75k-100k, 5.1% for AGIs $100k-200k, 4.5% for AGIs over 200k)
Taxable individual retirement arrangement distribution: $16,012 (reported on 11.9% of returns)
44632:
$16,012
Ohio:
$14,511
(% of AGI for various income ranges: 3.9% for AGIs below $25k, 2.6% for AGIs $25k-50k, 3.3% for AGIs $50k-75k, 2.9% for AGIs $75k-100k, 2.6% for AGIs $100k-200k, 4.3% for AGIs over 200k)
Self-employment retirement plans: $20,700 (reported on 0.4% of returns)
44632:
$20,700
Ohio:
$20,257
(% of AGI for various income ranges: 1.9% for AGIs below $25k)
Total itemized deductions: $20,657 (19% of AGI, reported on 35.0% of returns)
Here:
$20,657
State:
$21,278
Here:
18.7% of AGI
State:
18.8% of AGI
(% of AGI for various income ranges: 7.3% for AGIs below $25k, 9.5% for AGIs $25k-50k, 12.5% for AGIs $50k-75k, 13.4% for AGIs $75k-100k, 15.3% for AGIs $100k-200k, 11.8% for AGIs over 200k)
Charity contributions: $5,094 (reported on 29.3% of returns)
Here:
$5,094
State:
$3,943
(% of AGI for various income ranges: 0.6% for AGIs below $25k, 1.8% for AGIs $25k-50k, 2.2% for AGIs $50k-75k, 2.3% for AGIs $75k-100k, 3.3% for AGIs $100k-200k, 3.2% for AGIs over 200k)
Taxes paid: $8,299 (reported on 34.6% of returns)
44632:
$8,299
State:
$9,568
(% of AGI for various income ranges: 1.5% for AGIs below $25k, 2.6% for AGIs $25k-50k, 4.0% for AGIs $50k-75k, 5.0% for AGIs $75k-100k, 6.4% for AGIs $100k-200k, 6.5% for AGIs over 200k)
Earned income credit: $2,113 (reported on 12.3% of returns)
Here:
$2,113
State:
$2,285
(% of AGI for various income ranges: 3.9% for AGIs below $25k, 1.0% for AGIs $25k-50k)
Percentage of individuals using paid preparers for their 2012 taxes: 58.0%
Here:
58%
State:
51%
(% for various income ranges: 50.0% for AGIs below $25k, 59.2% for AGIs $25k-50k, 63.0% for AGIs $50k-75k, 59.6% for AGIs $75k-100k, 66.0% for AGIs $100k-200k, 86.7% for AGIs over 200k)
Averages for the 2004 tax year for zip code 44632, filed in 2005:
Average Adjusted Gross Income (AGI) in 2004: $47,622 (Individual Income Tax Returns)
Here:
$47,622
State:
$44,480
Salary/wage: $39,528 (reported on 87.0% of returns)
Here:
$39,528
State:
$39,198
(% of AGI for various income ranges: 107.0% for AGIs below $10k, 73.7% for AGIs $10k-25k, 80.3% for AGIs $25k-50k, 83.6% for AGIs $50k-75k, 83.9% for AGIs $75k-100k, 53.1% for AGIs over 100k)
Taxable interest for individuals: $1,907 (reported on 45.9% of returns)
This zip code:
$1,907
Ohio:
$1,532
(% of AGI for various income ranges: 5.1% for AGIs below $10k, 2.5% for AGIs $10k-25k, 1.3% for AGIs $25k-50k, 0.8% for AGIs $50k-75k, 1.1% for AGIs $75k-100k, 2.8% for AGIs over 100k)
Taxable dividends: $3,144 (reported on 25.6% of returns)
Here:
$3,144
State:
$3,496
(% of AGI for various income ranges: 2.7% for AGIs below $10k, 1.5% for AGIs $10k-25k, 0.8% for AGIs $25k-50k, 0.8% for AGIs $50k-75k, 0.5% for AGIs $75k-100k, 3.3% for AGIs over 100k)
Net capital gain/loss: +$9,346 (reported on 20.7% of returns)
Here:
+$9,346
State:
+$8,582
(% of AGI for various income ranges: -1.6% for AGIs below $10k, 0.7% for AGIs $10k-25k, 0.5% for AGIs $25k-50k, 1.1% for AGIs $50k-75k, 0.9% for AGIs $75k-100k, 10.5% for AGIs over 100k)
Profit/loss from business: +$11,417 (reported on 17.4% of returns)
Here:
+$11,417
State:
+$10,813
(% of AGI for various income ranges: -6.9% for AGIs below $10k, 7.5% for AGIs $10k-25k, 3.5% for AGIs $25k-50k, 3.2% for AGIs $50k-75k, 2.9% for AGIs $75k-100k, 5.5% for AGIs over 100k)
IRA payment deduction: $3,243 (reported on 3.6% of returns)
44632:
$3,243
Ohio:
$2,794
(% of AGI for various income ranges: 0.3% for AGIs $10k-25k, 0.3% for AGIs $25k-50k, 0.3% for AGIs $50k-75k, 0.2% for AGIs $75k-100k, 0.3% for AGIs over 100k)
Self-employed pension: $19,480 (reported on 0.5% of returns)
Here:
$19,480
Ohio:
$13,981
Total itemized deductions: $17,623 (21% of AGI, reported on 41.0% of returns)
Here:
$17,623
State:
$17,503
Here:
21.3% of AGI
State:
20.8% of AGI
(% of AGI for various income ranges: 6.3% for AGIs below $10k, 9.0% for AGIs $10k-25k, 12.7% for AGIs $25k-50k, 16.8% for AGIs $50k-75k, 17.4% for AGIs $75k-100k, 16.4% for AGIs over 100k)
Charity contributions deductions: $4,487 (5% of AGI, reported on 35.8% of returns)
Here:
$4,487
State:
$3,087
Here:
5.1% of AGI
State:
3.4% of AGI
(% of AGI for various income ranges: 1.3% for AGIs $10k-25k, 2.1% for AGIs $25k-50k, 3.3% for AGIs $50k-75k, 3.1% for AGIs $75k-100k, 4.9% for AGIs over 100k)
Total tax: $6,679 (reported on 79.7% of returns)
44632:
$6,679
State:
$6,781
(% of AGI for various income ranges: 2.8% for AGIs below $10k, 4.9% for AGIs $10k-25k, 7.1% for AGIs $25k-50k, 7.9% for AGIs $50k-75k, 9.5% for AGIs $75k-100k, 18.2% for AGIs over 100k)
Earned income credit: $1,535 (reported on 9.5% of returns)
Here:
$1,535
State:
$1,696
Percentage of individuals using paid preparers for their 2004 taxes: 59.0%
Here:
59%
State:
55%
(% for various income ranges: 46.7% for AGIs below $10k, 60.1% for AGIs $10k-25k, 61.9% for AGIs $25k-50k, 58.6% for AGIs $50k-75k, 60.7% for AGIs $75k-100k, 72.5% for AGIs over 100k)
Household received Food Stamps/SNAP in the past 12 months: 395 Household did not receive Food Stamps/SNAP in the past 12 months: 3,490
Women who had a birth in the past 12 months: 87 (70 now married, 18 unmarried) Women who did not have a birth in the past 12 months: 1,919 (946 now married, 972 unmarried)
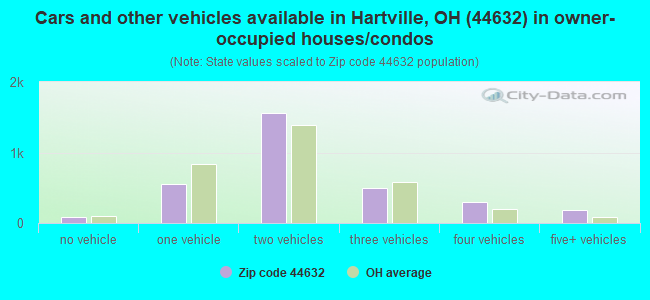
Housing units in zip code 44632 with a mortgage: 1,942 (380 second mortgage, 13 home equity loan, 358 both second mortgage and home equity loan) Houses without a mortgage: 242
Median monthly owner costs for units with a mortgage: $1,589 Median monthly owner costs for units without a mortgage: $614
Residents with income below the poverty level in 2022:
This zip code:
5.3%
Whole state:
13.4%
Residents with income below 50% of the poverty level in 2022:
This zip code:
2.9%
Whole state:
7.0%
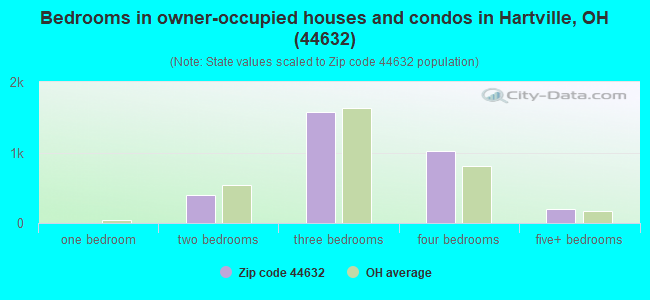
Median number of rooms in houses and condos:
Here:
7.3
State:
6.7
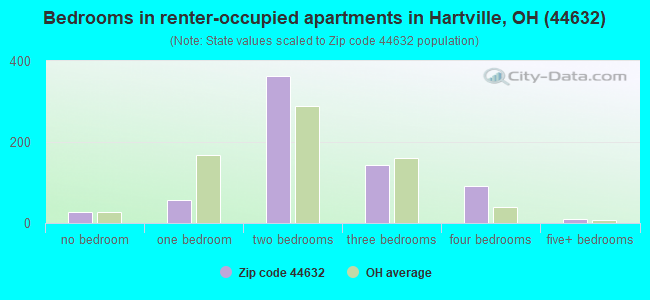
Median number of rooms in apartments:
Here:
4.7
State:
4.4
Notable locations in this zip code not listed on our city pages
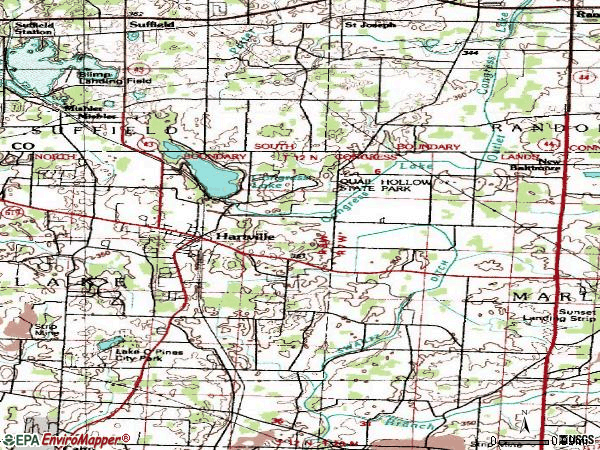
Notable locations in zip code 44632: Congress Lake Golf Club (A), Lakeview Golf Course (B), Seven Hills Golf Course (C), Hartville Fire Department Station 2 (D), Hartville Fire Department (E). Display/hide their locations on the map
Churches in zip code 44632 include: Hartville Church of God (A), Hartville United Church of Christ (B), Hartville Church of Christ (C), Maple Grove Church (D), Hartville Church (E). Display/hide their locations on the map
Cemeteries: Brumbaugh Cemetery (1), Union Cemetery (2), Maple Grove Cemetery (3), Hartville Lutheran Cemetery (4), Mount Peace Cemetery (5). Display/hide their locations on the map
Parks in zip code 44632 include: Stan Balliett Field (1), Lake O'Pines Park (2), Quail Hollow State Park (3), Memorial Park (4). Display/hide their locations on the map
In group quarters: 238 (-1 institutionalized population)
Size of family households: 1,062 2-persons, 447 3-persons, 573 4-persons, 274 5-persons, 97 6-persons, 221 7-or-more-persons
Size of nonfamily households: 1,074 1-person, 95 2-persons, 12 3-persons
2,257 married couples with children.
574 single-parent households (200 men, 374 women).
95.2% of residents of 44632 zip code speak English at home.
1.5% of residents speak Spanish at home (64% very well, 35% well, 1% not at all).
3.3% of residents speak other Indo-European language at home (98% very well, 2% well).
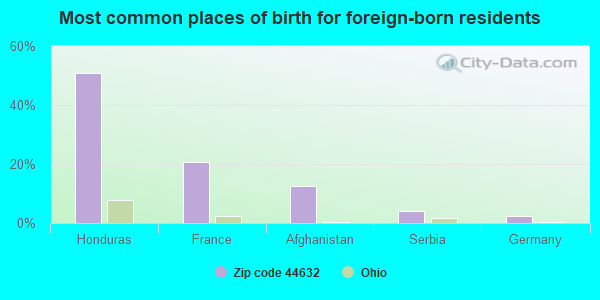
Foreign born population: 225 (2.1%) (41.6% of them are naturalized citizens)
This zip code:
2.1%
Whole state:
5.0%
51%Honduras
21%France
12%Afghanistan
4%Serbia
2%Germany
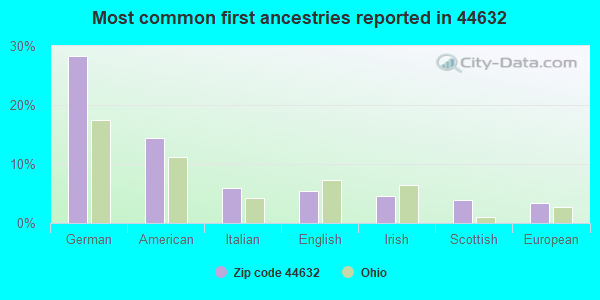
28%German
14%American
6%Italian
5%English
5%Irish
4%Scottish
3%European
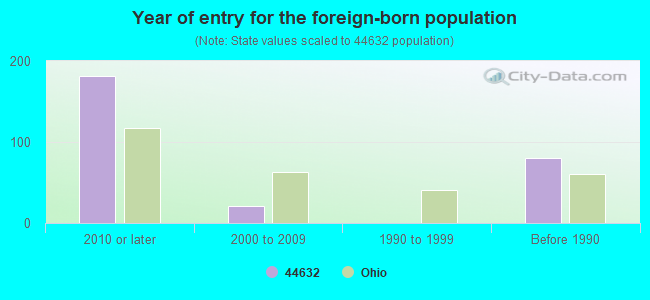
Year of entry for the foreign-born population
1812010 or later
212000 to 2009
01990 to 1999
80Before 1990
Facilities with environmental interests located in this zip code:
AULT-HARTVILLE FAMILY HEALTH CENTER (855 W MAPLE ST in HARTVILLE, OH)
STATE MASTER (Ohio general info) - RCRA-OHR000025049, HAZARDOUS WASTE PROGRAM Conditionally Exempt Small Quantity Generators, less than 100 kg/month of hazardous waste (Resource Conservation and Recovery Act (tracking hazardous waste)) - notification Organizations: AULTMAN AMBULATORY SERVICES (CONTACT/OWNER)
Housing units lacking complete plumbing facilities: 1.4% Housing units lacking complete kitchen facilities: 1.4%
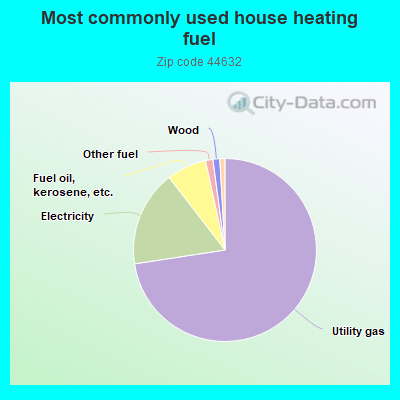
72.3%Utility gas
16.9%Electricity
7.0%Fuel oil, kerosene, etc.
1.3%Other fuel
1.2%Wood
0.9%Bottled, tank, or LP gas
Population in 1990: 8,318. Population change in the 1990s: +1,203 (+14.5%).
Place of birth for U.S.-born residents:
This state: 8,958
Northeast: 351
Midwest: 344
South: 738
West: 69
66% of the 44632 zip code residents lived in the same house 5 years ago. Out of people who lived in different houses, 56% lived in this county. Out of people who lived in different counties, 50% lived in Ohio.
93% of the 44632 zip code residents lived in the same house 1 year ago. Out of people who lived in different houses, 24% moved from this county. Out of people who lived in different houses, 58% moved from different county within same state. Out of people who lived in different houses, 13% moved from different state. Out of people who lived in different houses, 16% moved from abroad.
Private vs. public school enrollment:
Students in private schools in grades 1 to 8 (elementary and middle school): 118
Here:
7.1%
Ohio:
16.0%
Students in private schools in grades 9 to 12 (high school): 61
Here:
8.3%
Ohio:
13.1%
Students in private undergraduate colleges: 54
Here:
21.8%
Ohio:
22.3%
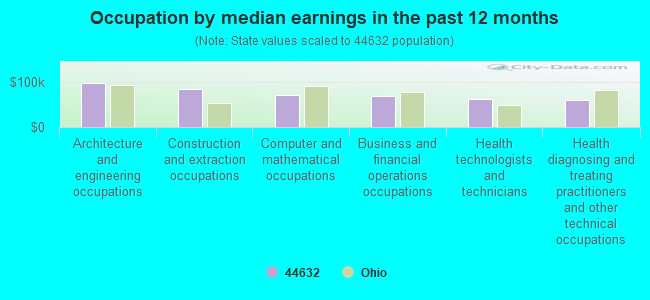
Occupation by median earnings in the past 12 months ($)
97,156Architecture and engineering occupations
84,723Construction and extraction occupations
70,940Computer and mathematical occupations
68,130Business and financial operations occupations
62,496Health technologists and technicians
60,291Health diagnosing and treating practitioners and other technical occupations
Companies with federal contracts located in this zip code:
NORTH AMERICAN MOLDED PRODUCTS (10 LINCOLN PARK in HARTVILLE, OH; small business) 50 employees, $0 revenue. : $26,137,936 in 149 contractsfrom 1999 to 2006
Contracts for Vehicular Brake, Steering, Axle, Wheel, and Track Components, Bearings, Plain, Unmounted, Nails, Machine Keys, and Pins, Bushings, Rings, Shims, and Spacers by Army, Defense Logistics Agency Signed by year:2000: $10,897,307; 2001: $3,023,260; 2002: $1,700,782; 2003: $9,506,438; 2004: $1,278,661; 2005: -$906,317; 2006: $252,255.
Biggest contracts:
$1,444,144 with Army for Vehicular Brake, Steering, Axle, Wheel, and Track Components. Taking place in PA. Signed on 2000-11-14. Completion date: 2001-07-10.
$1,439,482, same as above.Signed on 2001-11-27. Completion date: 2002-08-30.
$1,376,934 with Army for Vehicular Brake, Steering, Axle, Wheel, and Track Components. Signed on 2000-05-31. Completion date: 2001-03-27.
$1,366,509 with Army for Vehicular Brake, Steering, Axle, Wheel, and Track Components. Taking place in PA. Signed on 2000-10-24. Completion date: 2001-05-31.
Top industries in this zip code by the number of employees in 2005:
Administrative and Support and Waste Management and Remediation Services: Landscaping Services (over 1000 employees: 1 establishment, 5-9 employees: 2 establishments, 1-4 employees: 6 establishments)
2002 - 2018 National Fire Incident Reporting System (NFIRS) incidents
Based on the data from the years 2002 - 2018 the average number of fire incidents per year is 33. The highest number of fires - 63 took place in 2008, and the least - 7 in 2016. The data has an increasing trend.
When looking into fire subcategories, the most incidents belonged to: Structure Fires (53.2%), and Outside Fires (36.9%).
Fire incident types reported to NFIRS in Zip Code 44632


 Nearest zip codes: 44652, 44721, 44260, 44265, 44685, 44641.
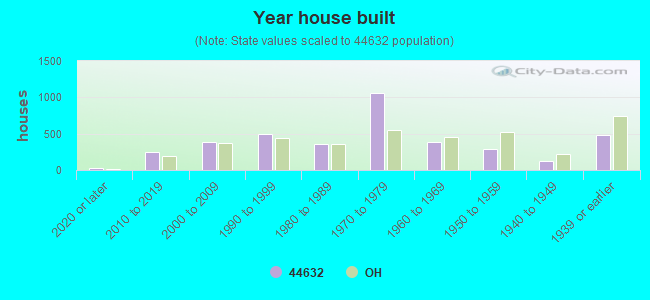


 Based on the data from the years 2002 - 2018 the average number of fire incidents per year is 33. The highest number of fires - 63 took place in 2008, and the least - 7 in 2016. The data has an increasing trend.
 When looking into fire subcategories, the most incidents belonged to: Structure Fires (53.2%), and Outside Fires (36.9%).