Estimated zip code population in 2022: 23,178 Zip code population in 2010: 23,805 Zip code population in 2000: 22,861
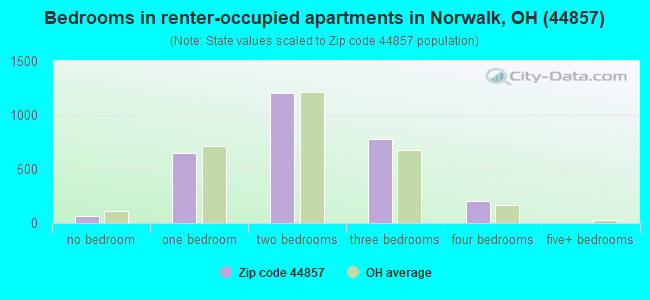
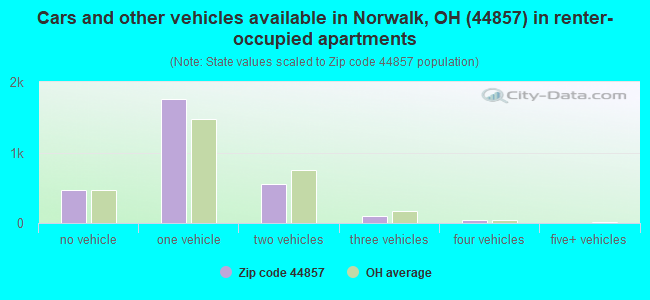
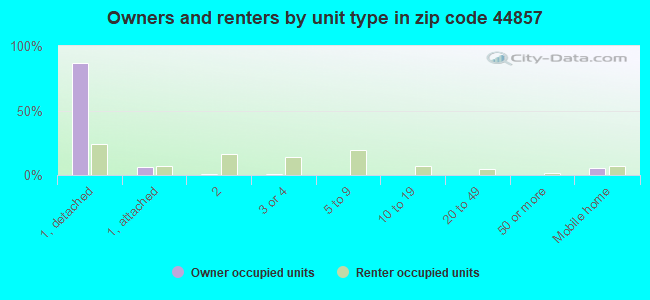
Houses and condos: 10,703 Renter-occupied apartments: 2,906
% of renters here:
29%
State:
33%
March 2022 cost of living index in zip code 44857: 77.4 (low, U.S. average is 100)
Land area: 83.1 sq. mi. Water area: 0.5 sq. mi.
Population density: 279 people per square mile
(very low).
OSM Map
General Map
Google Map
MSN Map
OSM Map
General Map
Google Map
MSN Map
OSM Map
General Map
Google Map
MSN Map
OSM Map
General Map
Google Map
MSN Map
Please wait while loading the map...
Real estate property taxes paid for housing units in 2022:
This zip code:
1.0% ($1,887)
Ohio:
1.3% ($2,639)
Median real estate property taxes paid for housing units with mortgages in 2022: $1,845 (1.0%) Median real estate property taxes paid for housing units with no mortgage in 2022: $1,966 (1.1%)
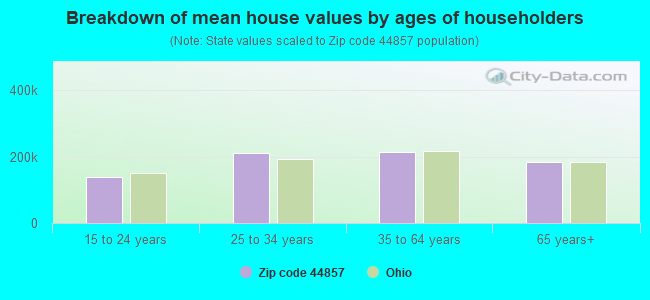
Estimated median house/condo value in 2022: $183,946
44857:
$183,946
Ohio:
$204,100
According to our research of Ohio and other state lists, there were 35 registered sex offenders living in 44857 zip code as of April 27, 2024. The ratio of all residents to sex offenders in zip code 44857 is 675 to 1. The ratio of registered sex offenders to all residents in this zip code is near the state average.
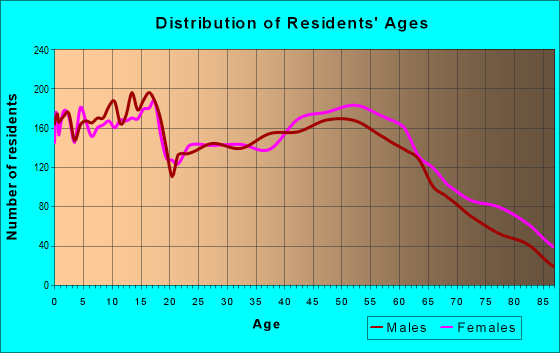
Median resident age:
This zip code:
40.7 years
Ohio median age:
39.9 years
Average household size:
This zip code:
2.3 people
Ohio:
2.4 people
Averages for the 2020 tax year for zip code 44857, filed in 2021:
Average Adjusted Gross Income (AGI) in 2020: $55,798 (Individual Income Tax Returns)
Here:
$55,798
State:
$67,288
Salary/wage: $44,952 (reported on 83.1% of returns)
Here:
$44,952
State:
$55,628
(% of AGI for various income ranges: 1130.8% for AGIs below $25k, 3455.0% for AGIs $25k-50k, 5986.9% for AGIs $50k-75k, 8690.0% for AGIs $75k-100k, 15335.3% for AGIs $100k-200k, 71028.3% for AGIs over 200k)
Taxable interest for individuals: $1,558 (reported on 24.0% of returns)
This zip code:
$1,558
Ohio:
$1,518
(% of AGI for various income ranges: 12.2% for AGIs below $25k, 14.3% for AGIs $25k-50k, 32.0% for AGIs $50k-75k, 52.0% for AGIs $75k-100k, 101.7% for AGIs $100k-200k, 3386.7% for AGIs over 200k)
Ordinary dividends: $4,624 (reported on 17.0% of returns)
Here:
$4,624
State:
$7,167
(% of AGI for various income ranges: 15.3% for AGIs below $25k, 30.1% for AGIs $25k-50k, 63.0% for AGIs $50k-75k, 110.8% for AGIs $75k-100k, 265.9% for AGIs $100k-200k, 7081.7% for AGIs over 200k)
Net capital gain/loss in AGI: +$9,774 (reported on 15.3% of returns)
Here:
+$9,774
State:
+$18,919
(% of AGI for various income ranges: 6.5% for AGIs below $25k, 29.2% for AGIs $25k-50k, 68.9% for AGIs $50k-75k, 218.7% for AGIs $75k-100k, 550.9% for AGIs $100k-200k, 16543.3% for AGIs over 200k)
Profit/loss from business: +$13,579 (reported on 10.2% of returns)
Here:
+$13,579
State:
+$13,744
(% of AGI for various income ranges: 54.2% for AGIs below $25k, 68.4% for AGIs $25k-50k, 122.6% for AGIs $50k-75k, 219.9% for AGIs $75k-100k, 550.8% for AGIs $100k-200k, 8711.7% for AGIs over 200k)
Taxable individual retirement arrangement distribution: $15,175 (reported on 9.9% of returns)
44857:
$15,175
Ohio:
$18,876
(% of AGI for various income ranges: 58.7% for AGIs below $25k, 96.4% for AGIs $25k-50k, 214.1% for AGIs $50k-75k, 342.0% for AGIs $75k-100k, 665.1% for AGIs $100k-200k, 4136.7% for AGIs over 200k)
Self-employed (Keogh) retirement plans: $25,575 (reported on 0.3% of returns)
44857:
$25,575
Ohio:
$24,898
(% of AGI for various income ranges: 134.6% for AGIs $100k-200k)
Total itemized deductions: $40,158 (reported on 2.8% of returns)
Here:
$40,158
State:
$33,869
(% of AGI for various income ranges: 20.3% for AGIs below $25k, 43.7% for AGIs $25k-50k, 76.2% for AGIs $50k-75k, 175.1% for AGIs $75k-100k, 395.3% for AGIs $100k-200k, 9956.7% for AGIs over 200k)
Charity contributions: $24,608 (reported on 2.1% of returns)
Here:
$24,608
State:
$14,577
(% of AGI for various income ranges: 7.8% for AGIs $25k-50k, 9.3% for AGIs $50k-75k, 35.1% for AGIs $75k-100k, 127.4% for AGIs $100k-200k, 7616.7% for AGIs over 200k)
Taxes paid: $6,523 (reported on 2.6% of returns)
44857:
$6,523
State:
$7,681
(% of AGI for various income ranges: 1.4% for AGIs below $25k, 4.2% for AGIs $25k-50k, 11.1% for AGIs $50k-75k, 37.5% for AGIs $75k-100k, 90.4% for AGIs $100k-200k, 1218.3% for AGIs over 200k)
Earned income credit: $2,284 (reported on 15.8% of returns)
Here:
$2,284
State:
$2,304
(% of AGI for various income ranges: 85.0% for AGIs below $25k, 60.9% for AGIs $25k-50k, 1.6% for AGIs $50k-75k)
Percentage of individuals using paid preparers for their 2020 taxes: 93.7%
Here:
94%
State:
94%
(% for various income ranges: 92.2% for AGIs below $25k, 95.0% for AGIs $25k-50k, 95.0% for AGIs $50k-75k, 93.2% for AGIs $75k-100k, 93.6% for AGIs $100k-200k, 90.5% for AGIs over 200k)
Averages for the 2012 tax year for zip code 44857, filed in 2013:
Average Adjusted Gross Income (AGI) in 2012: $45,699 (Individual Income Tax Returns)
Here:
$45,699
State:
$54,926
Salary/wage: $36,981 (reported on 85.8% of returns)
Here:
$36,981
State:
$45,869
(% of AGI for various income ranges: 74.8% for AGIs below $25k, 79.2% for AGIs $25k-50k, 75.5% for AGIs $50k-75k, 74.8% for AGIs $75k-100k, 71.1% for AGIs $100k-200k, 37.0% for AGIs over 200k)
Taxable interest for individuals: $1,517 (reported on 26.4% of returns)
This zip code:
$1,517
Ohio:
$1,297
(% of AGI for various income ranges: 1.0% for AGIs below $25k, 0.4% for AGIs $25k-50k, 0.6% for AGIs $50k-75k, 0.6% for AGIs $75k-100k, 0.9% for AGIs $100k-200k, 2.0% for AGIs over 200k)
Ordinary dividends: $5,793 (reported on 17.8% of returns)
Here:
$5,793
State:
$5,821
(% of AGI for various income ranges: 1.2% for AGIs below $25k, 1.0% for AGIs $25k-50k, 1.1% for AGIs $50k-75k, 1.0% for AGIs $75k-100k, 1.2% for AGIs $100k-200k, 8.6% for AGIs over 200k)
Net capital gain/loss in AGI: +$4,472 (reported on 12.7% of returns)
Here:
+$4,472
State:
+$11,232
(% of AGI for various income ranges: 0.2% for AGIs $25k-50k, 0.5% for AGIs $50k-75k, 0.9% for AGIs $75k-100k, 1.6% for AGIs $100k-200k, 4.7% for AGIs over 200k)
Profit/loss from business: +$9,820 (reported on 10.7% of returns)
Here:
+$9,820
State:
+$12,773
(% of AGI for various income ranges: 3.6% for AGIs below $25k, 1.8% for AGIs $25k-50k, 2.9% for AGIs $50k-75k, 1.9% for AGIs $75k-100k, 2.6% for AGIs $100k-200k, 1.5% for AGIs over 200k)
Taxable individual retirement arrangement distribution: $11,360 (reported on 10.6% of returns)
44857:
$11,360
Ohio:
$14,511
(% of AGI for various income ranges: 3.5% for AGIs below $25k, 2.3% for AGIs $25k-50k, 2.4% for AGIs $50k-75k, 2.5% for AGIs $75k-100k, 3.8% for AGIs $100k-200k, 1.6% for AGIs over 200k)
Self-employment retirement plans: $16,400 (reported on 0.3% of returns)
44857:
$16,400
Ohio:
$20,257
(% of AGI for various income ranges: 0.6% for AGIs $100k-200k)
Total itemized deductions: $18,596 (19% of AGI, reported on 22.6% of returns)
Here:
$18,596
State:
$21,278
Here:
19.0% of AGI
State:
18.8% of AGI
(% of AGI for various income ranges: 5.6% for AGIs below $25k, 6.3% for AGIs $25k-50k, 8.6% for AGIs $50k-75k, 10.7% for AGIs $75k-100k, 12.9% for AGIs $100k-200k, 11.1% for AGIs over 200k)
Charity contributions: $4,135 (reported on 16.3% of returns)
Here:
$4,135
State:
$3,943
(% of AGI for various income ranges: 0.5% for AGIs below $25k, 0.7% for AGIs $25k-50k, 0.9% for AGIs $50k-75k, 1.4% for AGIs $75k-100k, 1.9% for AGIs $100k-200k, 3.6% for AGIs over 200k)
Taxes paid: $7,009 (reported on 22.4% of returns)
44857:
$7,009
State:
$9,568
(% of AGI for various income ranges: 0.9% for AGIs below $25k, 1.6% for AGIs $25k-50k, 2.7% for AGIs $50k-75k, 3.9% for AGIs $75k-100k, 5.6% for AGIs $100k-200k, 6.1% for AGIs over 200k)
Earned income credit: $2,216 (reported on 18.7% of returns)
Here:
$2,216
State:
$2,285
(% of AGI for various income ranges: 6.1% for AGIs below $25k, 1.0% for AGIs $25k-50k)
Percentage of individuals using paid preparers for their 2012 taxes: 56.3%
Here:
56%
State:
51%
(% for various income ranges: 48.0% for AGIs below $25k, 59.4% for AGIs $25k-50k, 63.5% for AGIs $50k-75k, 63.5% for AGIs $75k-100k, 68.1% for AGIs $100k-200k, 86.7% for AGIs over 200k)
Averages for the 2004 tax year for zip code 44857, filed in 2005:
Average Adjusted Gross Income (AGI) in 2004: $41,578 (Individual Income Tax Returns)
Here:
$41,578
State:
$44,480
Salary/wage: $34,772 (reported on 87.8% of returns)
Here:
$34,772
State:
$39,198
(% of AGI for various income ranges: 116.2% for AGIs below $10k, 76.0% for AGIs $10k-25k, 83.8% for AGIs $25k-50k, 84.1% for AGIs $50k-75k, 85.4% for AGIs $75k-100k, 45.3% for AGIs over 100k)
Taxable interest for individuals: $1,350 (reported on 42.8% of returns)
This zip code:
$1,350
Ohio:
$1,532
(% of AGI for various income ranges: 6.0% for AGIs below $10k, 2.3% for AGIs $10k-25k, 0.9% for AGIs $25k-50k, 1.2% for AGIs $50k-75k, 1.3% for AGIs $75k-100k, 1.4% for AGIs over 100k)
Taxable dividends: $3,213 (reported on 22.5% of returns)
Here:
$3,213
State:
$3,496
(% of AGI for various income ranges: 2.9% for AGIs below $10k, 1.3% for AGIs $10k-25k, 0.9% for AGIs $25k-50k, 0.8% for AGIs $50k-75k, 0.8% for AGIs $75k-100k, 3.9% for AGIs over 100k)
Net capital gain/loss: +$4,560 (reported on 15.8% of returns)
Here:
+$4,560
State:
+$8,582
(% of AGI for various income ranges: -1.5% for AGIs below $10k, 0.4% for AGIs $10k-25k, 0.7% for AGIs $25k-50k, 0.9% for AGIs $50k-75k, 1.4% for AGIs $75k-100k, 4.3% for AGIs over 100k)
Profit/loss from business: +$8,044 (reported on 11.2% of returns)
Here:
+$8,044
State:
+$10,813
(% of AGI for various income ranges: 1.9% for AGIs below $10k, 2.9% for AGIs $10k-25k, 1.7% for AGIs $25k-50k, 1.7% for AGIs $50k-75k, 1.6% for AGIs $75k-100k, 3.0% for AGIs over 100k)
IRA payment deduction: $2,637 (reported on 2.4% of returns)
44857:
$2,637
Ohio:
$2,794
(% of AGI for various income ranges: 0.2% for AGIs $10k-25k, 0.2% for AGIs $25k-50k, 0.2% for AGIs $50k-75k, 0.1% for AGIs $75k-100k, 0.1% for AGIs over 100k)
Self-employed pension: $9,167 (reported on 0.4% of returns)
Here:
$9,167
Ohio:
$13,981
(% of AGI for various income ranges: 0.2% for AGIs $10k-25k, 0.1% for AGIs $50k-75k, 0.2% for AGIs over 100k)
Total itemized deductions: $16,783 (20% of AGI, reported on 29.8% of returns)
Here:
$16,783
State:
$17,503
Here:
20.5% of AGI
State:
20.8% of AGI
(% of AGI for various income ranges: 9.5% for AGIs below $10k, 5.9% for AGIs $10k-25k, 10.1% for AGIs $25k-50k, 12.6% for AGIs $50k-75k, 14.3% for AGIs $75k-100k, 14.8% for AGIs over 100k)
Charity contributions deductions: $3,241 (4% of AGI, reported on 23.7% of returns)
Here:
$3,241
State:
$3,087
Here:
4.0% of AGI
State:
3.4% of AGI
(% of AGI for various income ranges: 0.5% for AGIs below $10k, 0.7% for AGIs $10k-25k, 1.1% for AGIs $25k-50k, 1.4% for AGIs $50k-75k, 1.8% for AGIs $75k-100k, 3.5% for AGIs over 100k)
Total tax: $5,794 (reported on 74.6% of returns)
44857:
$5,794
State:
$6,781
(% of AGI for various income ranges: 2.4% for AGIs below $10k, 4.0% for AGIs $10k-25k, 6.9% for AGIs $25k-50k, 8.5% for AGIs $50k-75k, 10.0% for AGIs $75k-100k, 18.2% for AGIs over 100k)
Earned income credit: $1,596 (reported on 14.4% of returns)
Here:
$1,596
State:
$1,696
Percentage of individuals using paid preparers for their 2004 taxes: 56.5%
Here:
56%
State:
55%
(% for various income ranges: 43.8% for AGIs below $10k, 56.9% for AGIs $10k-25k, 58.9% for AGIs $25k-50k, 61.7% for AGIs $50k-75k, 60.8% for AGIs $75k-100k, 73.1% for AGIs over 100k)
Likely homosexual households (counted as self-reported same-sex unmarried-partner households)
Lesbian couples: 0.3% of all households
Gay men: 0.0% of all households
Household received Food Stamps/SNAP in the past 12 months: 1,077 Household did not receive Food Stamps/SNAP in the past 12 months: 8,766
Women who had a birth in the past 12 months: 142 (85 now married, 55 unmarried) Women who did not have a birth in the past 12 months: 4,997 (2,394 now married, 2,601 unmarried)
Housing units in zip code 44857 with a mortgage: 4,160 (536 second mortgage, 17 home equity loan, 516 both second mortgage and home equity loan) Houses without a mortgage: 141
Median monthly owner costs for units with a mortgage: $1,192 Median monthly owner costs for units without a mortgage: $511
Residents with income below the poverty level in 2022:
This zip code:
11.5%
Whole state:
13.4%
Residents with income below 50% of the poverty level in 2022:
This zip code:
6.7%
Whole state:
7.0%
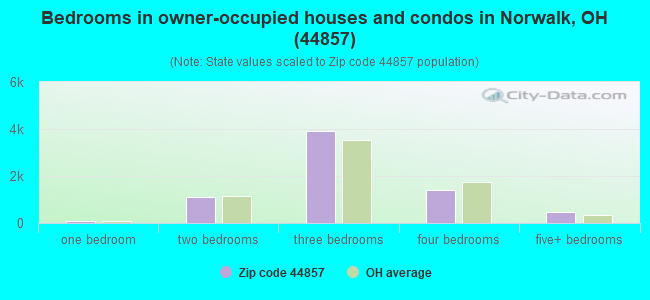
Median number of rooms in houses and condos:
Here:
6.8
State:
6.7
Median number of rooms in apartments:
Here:
4.8
State:
4.4
Notable locations in this zip code not listed on our city pages
Notable locations in zip code 44857: Firelands Industrial Park (A), Huron County Fairgrounds (B), Huron Junction (C), Butts Farms (D), Whispering Rain Farm (E), Knittel Tree Farm And Gardens (F), Norwalk Sewage Treatment Plant (G), Norwalk Fire - Emergency Medical Services Station (H), Huron County Law Library (I), Firelands Museum (J), Huron County Courthouse (K), Norwalk City Hall (L), Huron County Home (M), Huron County Childrens Home (N), Norwalk Public Library (O). Display/hide their locations on the map
Churches in zip code 44857 include: West Hartland Church (A), Second Methodist Church (B), Saint Peters Lutheran Church (C), Saint Pauls Roman Catholic Church (D), Saint Pauls Episcopal Church (E), Saint Marys Roman Catholic Church (F), First Universalist Church (G), First Presbyterian Church (H), First Methodist Church (I). Display/hide their locations on the map
Cemeteries: Saint Pauls Cemetery (1), Bronson Cemetery (2), Saint Peter Catholic Cemetery (3), Saint Alphonsus Catholic Cemetery (4), Ruggles Cemetery (5), Jacobsburg Cemetery (6), East Norwalk Cemetery (7). Display/hide their locations on the map
Reservoirs: Upper Reservoir (A), Contractors Realty Corporation Pond (B), Memorial Reservoir (C), Norwalk Lower Reservoir (D). Display/hide their locations on the map
Parks in zip code 44857 include: McGuan Park (1), Wayne Athletic Field (2), Memorial Lake Park (3), Whitney Park (4), West Main Street Historic District (5). Display/hide their locations on the map
3,133 married couples with children.
1,440 single-parent households (535 men, 905 women).
95.7% of residents of 44857 zip code speak English at home.
3.8% of residents speak Spanish at home (75% very well, 17% well, 8% not well).
0.3% of residents speak other Indo-European language at home (100% very well).
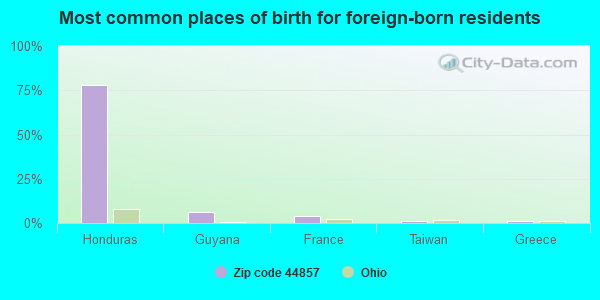
Foreign born population: 380 (1.6%) (36.9% of them are naturalized citizens)
This zip code:
1.6%
Whole state:
5.0%
78%Honduras
6%Guyana
4%France
1%Taiwan
1%Greece
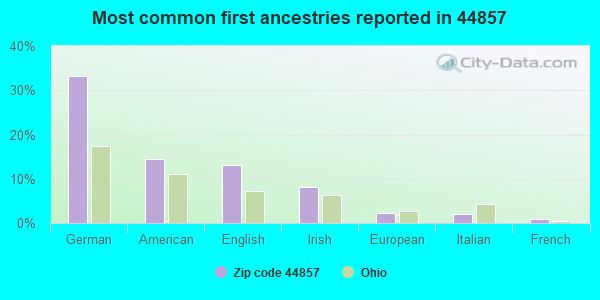
33%German
14%American
13%English
8%Irish
2%European
2%Italian
1%French
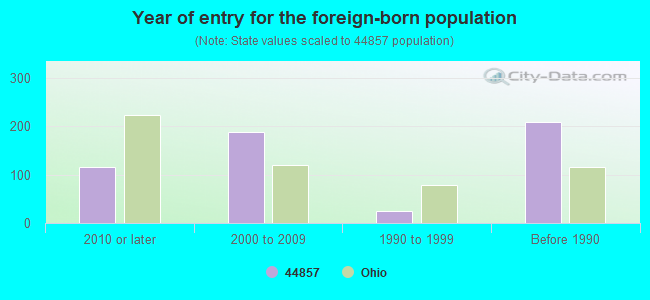
Year of entry for the foreign-born population
1162010 or later
1882000 to 2009
251990 to 1999
209Before 1990
Facilities with environmental interests located in this zip code:
BP AMOCO OIL CORP BULK PLANT NORWALK (63 N. PLEASANT in NORWALK, OH)
(Integrated Compliance Information System) - ICIS-05-1996-0567, FORMAL ENFORCEMENT ACTION STATE MASTER (Ohio general info) - PCS-OH0122718, National Pollutant Discharge Elimination System Permit, RCRA-OHD000723122, HAZARDOUS WASTE PROGRAM, AIR MAJOR, EPCRA National Pollutant Discharge Elimination System NON-MAJOR (Tracking pollutant discharge elimination systems) - permit Conditionally Exempt Small Quantity Generators, less than 100 kg/month of hazardous waste (Resource Conservation and Recovery Act (tracking hazardous waste)) - notification Business SIC classification: PETROLEUM AND PETROLEUM PRODUCTS WHOLESALERS, EXCEPT BULK STATIONS AND TERMINALS Organizations: BP OIL COMPANY (CONTACT/OWNER)
, BP EXPLORATION & OIL INC (CONTACT/OWNER)
, BP OIL COMPANY (CONTACT/OWNER)
Alternative names: BP OIL CO, BP OIL CO BULK PLT, BP OIL CO BULK PLANT NORWALK
BENNETT ELECTRIC INC (211 REPUBLIC ST in NORWALK, OH)
STATE MASTER (Ohio general info) - RCRA-OHD018243477, HAZARDOUS WASTE PROGRAM Small Quantity Generators, between 100 kg and 1000 kg of hazardous waste/month (Resource Conservation and Recovery Act (tracking hazardous waste)) - notification Organizations: STEWART DANIEL L (CONTACT/OWNER)
AJ RILEY EXCAVATING CO (S R 601 in NORWALK, OH)
AIR MINOR (AIRS/AFS) STATE MASTER (Ohio general info) - AIR MAJOR Business SIC classification: ASPHALT PAVING MIXTURES AND BLOCKS Alternative names: A J RILEY EXCAVATING
ALLTEL - NORTH FAIRFIELD (215 NEW STATE RD in NORWALK, OH)
(Integrated Compliance Information System) - ICIS-HQ-2000-6004, FORMAL ENFORCEMENT ACTION
CHAPIN AND CHAPIN INC (177 CLEVELAND RD in NORWALK, OH)
(Resource Conservation and Recovery Act (tracking hazardous waste))
AM HOSP SUP CORP AM CYSTOSCOPE MAKERS DV (93 N PLEASANT ST in NORWALK, OH)
Small Quantity Generators, between 100 kg and 1000 kg of hazardous waste/month (Resource Conservation and Recovery Act (tracking hazardous waste)) - notification Organizations: AMERICAN HOSPITAL SUPPLY CORP (CONTACT/OWNER)
ANGIES BODY AND FRAME (121 N PLEASANT ST in NORWALK, OH)
Small Quantity Generators, between 100 kg and 1000 kg of hazardous waste/month (Resource Conservation and Recovery Act (tracking hazardous waste)) - notification Organizations: PARRELLA ANGIE (CONTACT/OWNER)
Housing units lacking complete plumbing facilities: 0.8% Housing units lacking complete kitchen facilities: 1.6%
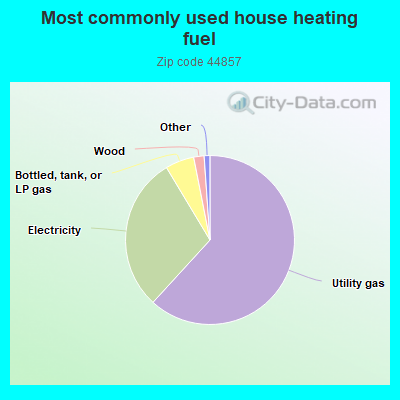
61.8%Utility gas
29.6%Electricity
5.5%Bottled, tank, or LP gas
2.0%Wood
0.6%Other fuel
0.6%Fuel oil, kerosene, etc.
Population in 1990: 21,687. Population change in the 1990s: +1,174 (+5.4%).
Place of birth for U.S.-born residents:
This state: 19,080
Northeast: 928
Midwest: 805
South: 1,288
West: 503
55% of the 44857 zip code residents lived in the same house 5 years ago. Out of people who lived in different houses, 68% lived in this county. Out of people who lived in different counties, 50% lived in Ohio.
92% of the 44857 zip code residents lived in the same house 1 year ago. Out of people who lived in different houses, 55% moved from this county. Out of people who lived in different houses, 40% moved from different county within same state. Out of people who lived in different houses, 6% moved from different state. Out of people who lived in different houses, 1% moved from abroad.
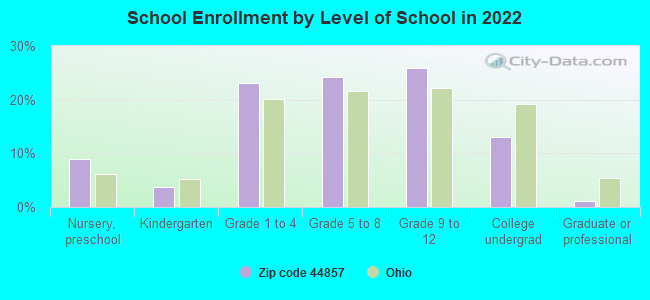
Private vs. public school enrollment:
Students in private schools in grades 1 to 8 (elementary and middle school): 379
Here:
15.8%
Ohio:
16.0%
Students in private schools in grades 9 to 12 (high school): 283
Here:
21.5%
Ohio:
13.1%
Students in private undergraduate colleges: 130
Here:
19.7%
Ohio:
22.3%
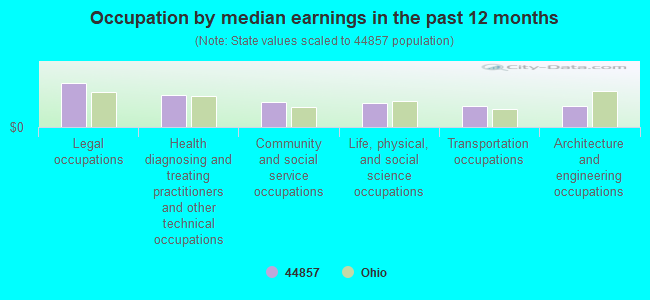
Occupation by median earnings in the past 12 months ($)
112,296Legal occupations
82,057Health diagnosing and treating practitioners and other technical occupations
64,009Community and social service occupations
60,759Life, physical, and social science occupations
54,697Transportation occupations
52,494Architecture and engineering occupations
Companies with federal contracts located in this zip code:
NORWALK CONCRETE INDUSTRIES (80 COMMERCE DRIVE in NORWALK, OH; small business) : $51,620 in 2 contractsin 2001
$25,810 with Air Force for Warehouse Trucks and Tractors, Self-Propelled. Signed on 2001-12-20. Completion date: 2002-01-18.
$25,810, same as above.Signed on 2001-11-09. Completion date: 2001-11-26.
GOODNIGHT INN INC (342 MILAN AVE in NORWALK, OH)
$2,697 with Army for Lodging - Hotel/Motel. Signed on 2004-12-27. Completion date: 2004-11-13.
Top industries in this zip code by the number of employees in 2005:
Health Care and Social Assistance: General Medical and Surgical Hospitals (500-999 employees: 1 establishment)
232 people in nursing facilities/skilled-nursing facilities
95 people in local jails and other municipal confinement facilities
42 people in other noninstitutional facilities
11 people in emergency and transitional shelters (with sleeping facilities) for people experiencing homelessness
11 people in group homes intended for adults
People in group quarters in 2000:
218 people in nursing homes
121 people in local jails and other confinement facilities (including police lockups)
13 people in other group homes
4 people in homes for the mentally retarded
4 people in religious group quarters
Fatal accident statistics in 2014:
Fatal accident count: 1
Vehicles involved in fatal accidents: 2
Fatal accidents caused by drunken drivers: 0
Fatalities: 1
Persons involved in fatal accidents: 4
Pedestrians involved in fatal accidents: 0
Fatal accident statistics in 2012:
Fatal accident count: 2
Vehicles involved in fatal accidents: 3
Fatal accidents caused by drunken drivers: 1
Fatalities: 2
Persons involved in fatal accidents: 4
Pedestrians involved in fatal accidents: 0
2002 - 2018 National Fire Incident Reporting System (NFIRS) incidents
Based on the data from the years 2002 - 2018 the average number of fires per year is 78. The highest number of fires - 105 took place in 2003, and the least - 47 in 2013. The data has a dropping trend.
When looking into fire subcategories, the most reports belonged to: Structure Fires (47.2%), and Outside Fires (38.6%).
Fire incident types reported to NFIRS in Zip Code 44857
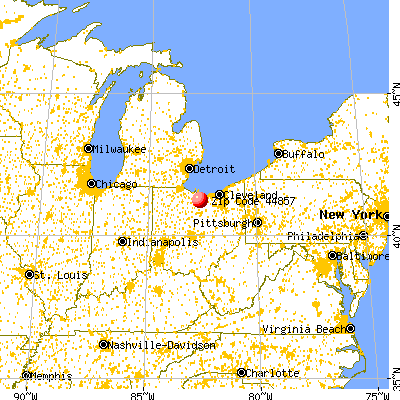


 Nearest zip codes: 44826, 44846, 44855, 44847, 44814, 44839.


 Based on the data from the years 2002 - 2018 the average number of fires per year is 78. The highest number of fires - 105 took place in 2003, and the least - 47 in 2013. The data has a dropping trend.
 When looking into fire subcategories, the most reports belonged to: Structure Fires (47.2%), and Outside Fires (38.6%).