Estimated zip code population in 2022: 12,745 Zip code population in 2010: 12,519 Zip code population in 2000: 12,272
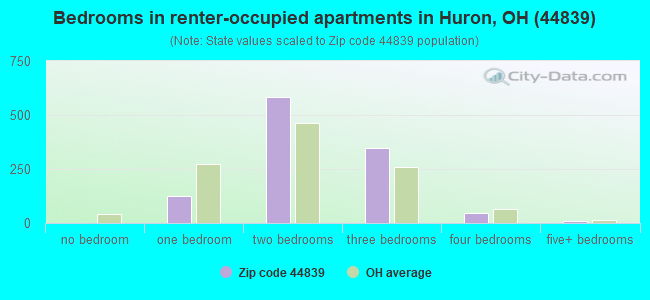
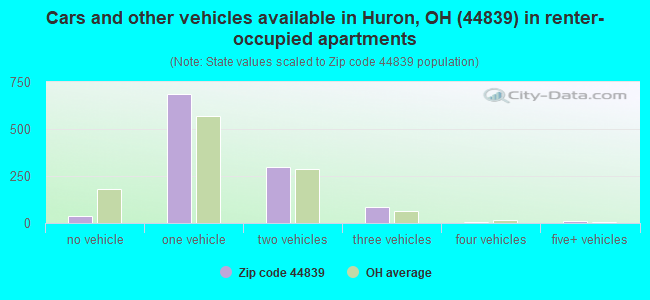
Houses and condos: 6,963 Renter-occupied apartments: 1,115
% of renters here:
19%
State:
33%
March 2022 cost of living index in zip code 44839: 92.8 (less than average, U.S. average is 100)
Land area: 35.4 sq. mi. Water area: 6.9 sq. mi.
Population density: 360 people per square mile
(very low).
OSM Map
General Map
Google Map
MSN Map
OSM Map
General Map
Google Map
MSN Map
OSM Map
General Map
Google Map
MSN Map
OSM Map
General Map
Google Map
MSN Map
Please wait while loading the map...
Real estate property taxes paid for housing units in 2022:
This zip code:
1.1% ($2,731)
Ohio:
1.3% ($2,639)
Median real estate property taxes paid for housing units with mortgages in 2022: $2,875 (1.1%) Median real estate property taxes paid for housing units with no mortgage in 2022: $2,541 (1.2%)
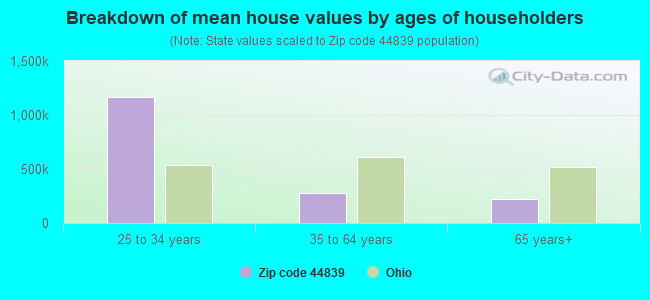
Estimated median house/condo value in 2022: $247,637
44839:
$247,637
Ohio:
$204,100
According to our research of Ohio and other state lists, there were 11 registered sex offenders living in 44839 zip code as of April 25, 2024. The ratio of all residents to sex offenders in zip code 44839 is 1,138 to 1. The ratio of registered sex offenders to all residents in this zip code is lower than the state average.
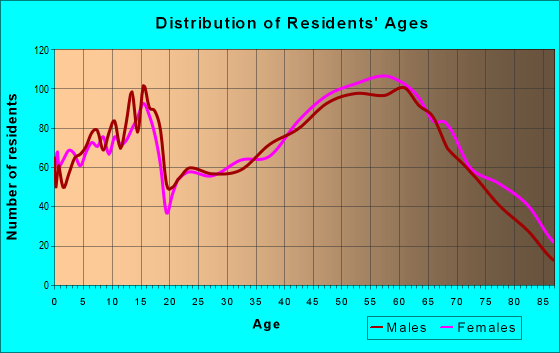
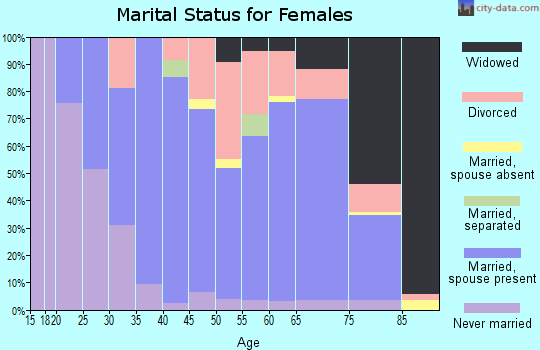
Median resident age:
This zip code:
57.2 years
Ohio median age:
39.9 years
Average household size:
This zip code:
2.1 people
Ohio:
2.4 people
Averages for the 2020 tax year for zip code 44839, filed in 2021:
Average Adjusted Gross Income (AGI) in 2020: $73,499 (Individual Income Tax Returns)
Here:
$73,499
State:
$67,288
Salary/wage: $55,305 (reported on 75.4% of returns)
Here:
$55,305
State:
$55,628
(% of AGI for various income ranges: 1115.9% for AGIs below $25k, 3298.6% for AGIs $25k-50k, 5498.8% for AGIs $50k-75k, 8176.0% for AGIs $75k-100k, 16332.9% for AGIs $100k-200k, 88312.9% for AGIs over 200k)
Taxable interest for individuals: $1,929 (reported on 36.7% of returns)
This zip code:
$1,929
Ohio:
$1,518
(% of AGI for various income ranges: 15.9% for AGIs below $25k, 33.9% for AGIs $25k-50k, 63.3% for AGIs $50k-75k, 82.9% for AGIs $75k-100k, 137.5% for AGIs $100k-200k, 3804.3% for AGIs over 200k)
Ordinary dividends: $9,139 (reported on 28.1% of returns)
Here:
$9,139
State:
$7,167
(% of AGI for various income ranges: 39.2% for AGIs below $25k, 80.9% for AGIs $25k-50k, 172.9% for AGIs $50k-75k, 288.5% for AGIs $75k-100k, 603.1% for AGIs $100k-200k, 14708.6% for AGIs over 200k)
Net capital gain/loss in AGI: +$12,304 (reported on 25.7% of returns)
Here:
+$12,304
State:
+$18,919
(% of AGI for various income ranges: 11.8% for AGIs below $25k, 43.6% for AGIs $25k-50k, 135.0% for AGIs $50k-75k, 234.0% for AGIs $75k-100k, 720.0% for AGIs $100k-200k, 21600.0% for AGIs over 200k)
Profit/loss from business: +$14,944 (reported on 13.3% of returns)
Here:
+$14,944
State:
+$13,744
(% of AGI for various income ranges: 43.1% for AGIs below $25k, 109.0% for AGIs $25k-50k, 204.3% for AGIs $50k-75k, 272.9% for AGIs $75k-100k, 804.7% for AGIs $100k-200k, 6375.7% for AGIs over 200k)
Taxable individual retirement arrangement distribution: $21,560 (reported on 16.4% of returns)
44839:
$21,560
Ohio:
$18,876
(% of AGI for various income ranges: 99.6% for AGIs below $25k, 217.5% for AGIs $25k-50k, 474.9% for AGIs $50k-75k, 748.5% for AGIs $75k-100k, 1335.4% for AGIs $100k-200k, 8432.9% for AGIs over 200k)
Self-employed (Keogh) retirement plans: $18,275 (reported on 0.6% of returns)
44839:
$18,275
Ohio:
$24,898
(% of AGI for various income ranges: 123.9% for AGIs $100k-200k)
Total itemized deductions: $31,379 (reported on 5.6% of returns)
Here:
$31,379
State:
$33,869
(% of AGI for various income ranges: 56.9% for AGIs below $25k, 77.5% for AGIs $25k-50k, 214.7% for AGIs $50k-75k, 274.4% for AGIs $75k-100k, 646.4% for AGIs $100k-200k, 5467.1% for AGIs over 200k)
Charity contributions: $10,529 (reported on 4.4% of returns)
Here:
$10,529
State:
$14,577
(% of AGI for various income ranges: 16.2% for AGIs $25k-50k, 47.8% for AGIs $50k-75k, 57.9% for AGIs $75k-100k, 121.7% for AGIs $100k-200k, 2475.7% for AGIs over 200k)
Taxes paid: $7,269 (reported on 5.6% of returns)
44839:
$7,269
State:
$7,681
(% of AGI for various income ranges: 6.0% for AGIs below $25k, 13.1% for AGIs $25k-50k, 47.6% for AGIs $50k-75k, 69.8% for AGIs $75k-100k, 162.5% for AGIs $100k-200k, 1365.7% for AGIs over 200k)
Earned income credit: $1,958 (reported on 9.4% of returns)
Here:
$1,958
State:
$2,304
(% of AGI for various income ranges: 60.3% for AGIs below $25k, 35.8% for AGIs $25k-50k)
Percentage of individuals using paid preparers for their 2020 taxes: 93.4%
Here:
93%
State:
94%
(% for various income ranges: 91.4% for AGIs below $25k, 93.4% for AGIs $25k-50k, 95.4% for AGIs $50k-75k, 93.3% for AGIs $75k-100k, 94.6% for AGIs $100k-200k, 96.7% for AGIs over 200k)
Averages for the 2012 tax year for zip code 44839, filed in 2013:
Average Adjusted Gross Income (AGI) in 2012: $63,519 (Individual Income Tax Returns)
Here:
$63,519
State:
$54,926
Salary/wage: $47,086 (reported on 82.2% of returns)
Here:
$47,086
State:
$45,869
(% of AGI for various income ranges: 70.7% for AGIs below $25k, 64.1% for AGIs $25k-50k, 66.0% for AGIs $50k-75k, 67.5% for AGIs $75k-100k, 71.2% for AGIs $100k-200k, 42.4% for AGIs over 200k)
Taxable interest for individuals: $1,509 (reported on 40.3% of returns)
This zip code:
$1,509
Ohio:
$1,297
(% of AGI for various income ranges: 1.5% for AGIs below $25k, 0.9% for AGIs $25k-50k, 0.8% for AGIs $50k-75k, 0.7% for AGIs $75k-100k, 0.7% for AGIs $100k-200k, 1.3% for AGIs over 200k)
Ordinary dividends: $7,262 (reported on 28.6% of returns)
Here:
$7,262
State:
$5,821
(% of AGI for various income ranges: 2.4% for AGIs below $25k, 1.8% for AGIs $25k-50k, 1.8% for AGIs $50k-75k, 2.1% for AGIs $75k-100k, 2.3% for AGIs $100k-200k, 6.4% for AGIs over 200k)
Net capital gain/loss in AGI: +$8,713 (reported on 22.3% of returns)
Here:
+$8,713
State:
+$11,232
(% of AGI for various income ranges: 0.3% for AGIs $50k-75k, 0.6% for AGIs $75k-100k, 1.0% for AGIs $100k-200k, 9.8% for AGIs over 200k)
Profit/loss from business: +$11,073 (reported on 12.1% of returns)
Here:
+$11,073
State:
+$12,773
(% of AGI for various income ranges: 4.0% for AGIs below $25k, 2.1% for AGIs $25k-50k, 2.9% for AGIs $50k-75k, 2.1% for AGIs $75k-100k, 2.7% for AGIs $100k-200k, 0.8% for AGIs over 200k)
Taxable individual retirement arrangement distribution: $15,211 (reported on 16.6% of returns)
44839:
$15,211
Ohio:
$14,511
(% of AGI for various income ranges: 4.4% for AGIs below $25k, 4.1% for AGIs $25k-50k, 3.7% for AGIs $50k-75k, 4.9% for AGIs $75k-100k, 4.2% for AGIs $100k-200k, 3.3% for AGIs over 200k)
Self-employment retirement plans: $23,133 (reported on 0.4% of returns)
44839:
$23,133
Ohio:
$20,257
(% of AGI for various income ranges: 0.7% for AGIs $100k-200k)
Total itemized deductions: $20,724 (17% of AGI, reported on 33.9% of returns)
Here:
$20,724
State:
$21,278
Here:
16.8% of AGI
State:
18.8% of AGI
(% of AGI for various income ranges: 9.5% for AGIs below $25k, 8.7% for AGIs $25k-50k, 11.3% for AGIs $50k-75k, 12.4% for AGIs $75k-100k, 12.9% for AGIs $100k-200k, 10.2% for AGIs over 200k)
Charity contributions: $3,095 (reported on 27.3% of returns)
Here:
$3,095
State:
$3,943
(% of AGI for various income ranges: 0.8% for AGIs below $25k, 1.0% for AGIs $25k-50k, 1.3% for AGIs $50k-75k, 1.6% for AGIs $75k-100k, 1.6% for AGIs $100k-200k, 1.3% for AGIs over 200k)
Taxes paid: $9,114 (reported on 33.9% of returns)
44839:
$9,114
State:
$9,568
(% of AGI for various income ranges: 1.9% for AGIs below $25k, 2.3% for AGIs $25k-50k, 3.9% for AGIs $50k-75k, 4.4% for AGIs $75k-100k, 6.0% for AGIs $100k-200k, 6.6% for AGIs over 200k)
Earned income credit: $1,859 (reported on 11.8% of returns)
Here:
$1,859
State:
$2,285
(% of AGI for various income ranges: 4.0% for AGIs below $25k, 0.6% for AGIs $25k-50k)
Percentage of individuals using paid preparers for their 2012 taxes: 56.1%
Here:
56%
State:
51%
(% for various income ranges: 47.8% for AGIs below $25k, 57.2% for AGIs $25k-50k, 62.1% for AGIs $50k-75k, 60.9% for AGIs $75k-100k, 60.8% for AGIs $100k-200k, 81.8% for AGIs over 200k)
Averages for the 2004 tax year for zip code 44839, filed in 2005:
Average Adjusted Gross Income (AGI) in 2004: $52,481 (Individual Income Tax Returns)
Here:
$52,481
State:
$44,480
Salary/wage: $43,893 (reported on 84.1% of returns)
Here:
$43,893
State:
$39,198
(% of AGI for various income ranges: 116.2% for AGIs below $10k, 64.7% for AGIs $10k-25k, 72.4% for AGIs $25k-50k, 75.2% for AGIs $50k-75k, 80.6% for AGIs $75k-100k, 61.9% for AGIs over 100k)
Taxable interest for individuals: $1,730 (reported on 54.0% of returns)
This zip code:
$1,730
Ohio:
$1,532
(% of AGI for various income ranges: 6.2% for AGIs below $10k, 3.1% for AGIs $10k-25k, 1.7% for AGIs $25k-50k, 1.3% for AGIs $50k-75k, 1.1% for AGIs $75k-100k, 2.0% for AGIs over 100k)
Taxable dividends: $3,831 (reported on 35.5% of returns)
Here:
$3,831
State:
$3,496
(% of AGI for various income ranges: 5.5% for AGIs below $10k, 2.5% for AGIs $10k-25k, 1.6% for AGIs $25k-50k, 1.4% for AGIs $50k-75k, 1.6% for AGIs $75k-100k, 4.0% for AGIs over 100k)
Net capital gain/loss: +$8,074 (reported on 27.8% of returns)
Here:
+$8,074
State:
+$8,582
(% of AGI for various income ranges: -3.9% for AGIs below $10k, 0.5% for AGIs $10k-25k, 0.2% for AGIs $25k-50k, 0.9% for AGIs $50k-75k, 1.2% for AGIs $75k-100k, 10.1% for AGIs over 100k)
Profit/loss from business: +$12,227 (reported on 13.3% of returns)
Here:
+$12,227
State:
+$10,813
(% of AGI for various income ranges: 6.6% for AGIs below $10k, 4.5% for AGIs $10k-25k, 2.3% for AGIs $25k-50k, 2.3% for AGIs $50k-75k, 2.6% for AGIs $75k-100k, 3.8% for AGIs over 100k)
IRA payment deduction: $3,029 (reported on 2.7% of returns)
44839:
$3,029
Ohio:
$2,794
(% of AGI for various income ranges: 0.3% for AGIs $10k-25k, 0.3% for AGIs $25k-50k, 0.2% for AGIs $50k-75k, 0.2% for AGIs $75k-100k, 0.1% for AGIs over 100k)
Self-employed pension: $16,474 (reported on 0.6% of returns)
Here:
$16,474
Ohio:
$13,981
Total itemized deductions: $17,722 (20% of AGI, reported on 40.5% of returns)
Here:
$17,722
State:
$17,503
Here:
19.6% of AGI
State:
20.8% of AGI
(% of AGI for various income ranges: 11.6% for AGIs below $10k, 11.6% for AGIs $10k-25k, 12.1% for AGIs $25k-50k, 13.0% for AGIs $50k-75k, 15.0% for AGIs $75k-100k, 14.5% for AGIs over 100k)
Charity contributions deductions: $2,836 (3% of AGI, reported on 34.8% of returns)
Here:
$2,836
State:
$3,087
Here:
3.0% of AGI
State:
3.4% of AGI
(% of AGI for various income ranges: 0.5% for AGIs below $10k, 1.1% for AGIs $10k-25k, 1.2% for AGIs $25k-50k, 1.4% for AGIs $50k-75k, 2.0% for AGIs $75k-100k, 2.6% for AGIs over 100k)
Total tax: $8,129 (reported on 80.6% of returns)
44839:
$8,129
State:
$6,781
(% of AGI for various income ranges: 3.2% for AGIs below $10k, 4.2% for AGIs $10k-25k, 7.5% for AGIs $25k-50k, 9.7% for AGIs $50k-75k, 10.7% for AGIs $75k-100k, 18.5% for AGIs over 100k)
Earned income credit: $1,411 (reported on 8.4% of returns)
Here:
$1,411
State:
$1,696
Percentage of individuals using paid preparers for their 2004 taxes: 59.3%
Here:
59%
State:
55%
(% for various income ranges: 45.2% for AGIs below $10k, 59.2% for AGIs $10k-25k, 63.7% for AGIs $25k-50k, 63.1% for AGIs $50k-75k, 59.4% for AGIs $75k-100k, 68.3% for AGIs over 100k)
Likely homosexual households (counted as self-reported same-sex unmarried-partner households)
Lesbian couples: 0.2% of all households
Gay men: 0.0% of all households
Household received Food Stamps/SNAP in the past 12 months: 326 Household did not receive Food Stamps/SNAP in the past 12 months: 5,548
Women who had a birth in the past 12 months: 49 (50 now married, 0 unmarried) Women who did not have a birth in the past 12 months: 1,749 (775 now married, 974 unmarried)
Housing units in zip code 44839 with a mortgage: 2,628 (314 second mortgage, 11 home equity loan, 298 both second mortgage and home equity loan) Houses without a mortgage: 354
Median monthly owner costs for units with a mortgage: $1,512 Median monthly owner costs for units without a mortgage: $628
Residents with income below the poverty level in 2022:
This zip code:
9.5%
Whole state:
13.4%
Residents with income below 50% of the poverty level in 2022:
This zip code:
5.8%
Whole state:
7.0%
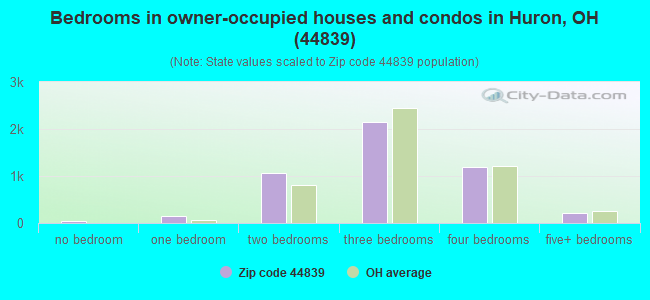
Median number of rooms in houses and condos:
Here:
6.5
State:
6.7
Median number of rooms in apartments:
Here:
4.8
State:
4.4
Notable locations in this zip code not listed on our city pages
Notable locations in zip code 44839: Osborn State Farm (A), Keys Golf Course (B), Sawmill Creek Golf Course (C), Sawmill Industrial park (D), Thunderbird Golf Course (E), Huron Lagoons Marina (F), Huron Yacht Club (G), Pages Corners (H), Ceylon Junction (I), Harbor Yacht Club (J), Harbor Marina Park (K), Enderle Berry Farm (L), Lake Park (M), Mulberry Creek Herb Farm (N), James H McBride Arboretum (O), Erie County Sanitary Landfill (P), Huron Division of Fire (Q), Huron Public Library (R), Huron Inner East Light (S), East Breakwater Light (T). Display/hide their locations on the map
Churches in zip code 44839 include: Christ Episcopal Church (A), First Baptist Church (B), First Presbyterian Church (C), Saint Peter Catholic Church (D), The Chapel in Huron (E), Zion Evangelical Lutheran Church (F). Display/hide their locations on the map
Cemeteries: McMillan Cemetery (1), Scotts Cemetery (2), Huron Cemetery (3), Restlawn Memorial Park (4), Peakes Cemetery (5). Display/hide their locations on the map
Streams, rivers, and creeks: Cranberry Creek (A), Old Woman Creek (B), Mud Brook (C), Sawmill Creek (D), Huron River (E). Display/hide their locations on the map
Parks in zip code 44839 include: Old Woman Creek Nature Preserve (1), Osborn Recreation Area (2), Sheldon Marsh Nature Preserve (3), Nickleplate Park (4), Lake Park (5), Fabens Park (6), Osborne Park (7). Display/hide their locations on the map
In group quarters: 196 (-1 institutionalized population)
Size of family households: 2,291 2-persons, 514 3-persons, 529 4-persons, 268 5-persons, 59 6-persons, 41 7-or-more-persons
Size of nonfamily households: 1,957 1-person, 231 2-persons
1,363 married couples with children.
599 single-parent households (233 men, 366 women).
96.1% of residents of 44839 zip code speak English at home.
1.8% of residents speak Spanish at home (26% very well, 42% well, 32% not well).
2.1% of residents speak other Indo-European language at home (95% very well, 5% not well).
0.7% of residents speak Asian or Pacific Island language at home (35% very well, 65% well).
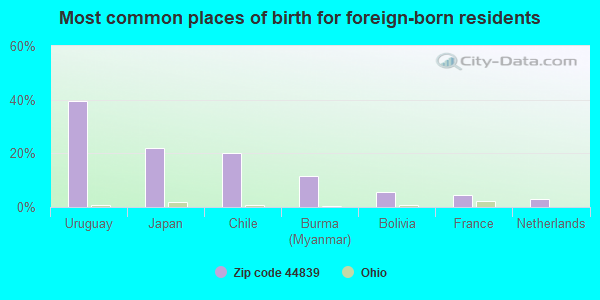
Foreign born population: 367 (2.9%) (64.4% of them are naturalized citizens)
This zip code:
2.9%
Whole state:
5.0%
39%Uruguay
22%Japan
20%Chile
11%Burma (Myanmar)
5%Bolivia
5%France
3%Netherlands
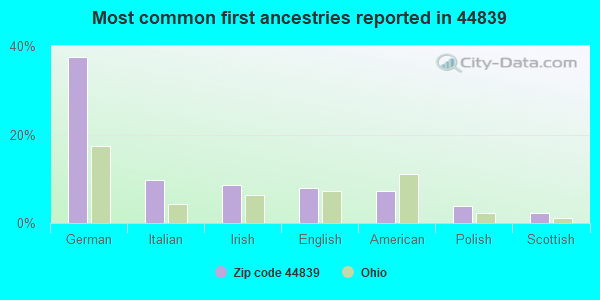
38%German
10%Italian
9%Irish
8%English
7%American
4%Polish
2%Scottish
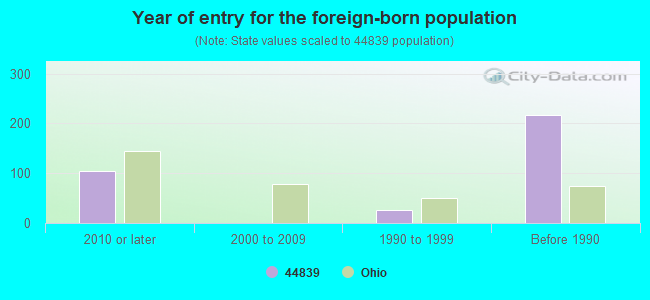
Year of entry for the foreign-born population
1052010 or later
02000 to 2009
271990 to 1999
217Before 1990
Facilities with environmental interests located in this zip code:
AMBER MILLING CO (41 CLEVELAND ROAD EAST in HURON, OH)
AIR MINOR (AIRS/AFS) ENFORCEMENT/COMPLIANCE ACTIVITY (Integrated Compliance Information System) - ICIS-05-1999-0519, FORMAL ENFORCEMENT ACTION (Integrated Compliance Information System) - ICIS-05-1999-0519, FORMAL ENFORCEMENT ACTION STATE MASTER (Ohio general info) - AIR MAJOR, RCRA-OHR000019737, HAZARDOUS WASTE PROGRAM Small Quantity Generators, between 100 kg and 1000 kg of hazardous waste/month (Resource Conservation and Recovery Act (tracking hazardous waste)) - notification Business SIC classification: FLOUR AND OTHER GRAIN MILL PRODUCTS Organizations: PEVEY GREEN (CONTACT/OWNER)
ALPINE TRAILS MHP (2719 ALPINE TRAIL in HURON, OH)
STATE MASTER (Ohio general info) - PCS-OH0126900, National Pollutant Discharge Elimination System Permit, SDWIS-2200012, DRINKING WATER PROGRAM National Pollutant Discharge Elimination System NON-MAJOR (Tracking pollutant discharge elimination systems) - permit Business SIC classification: SEWERAGE SYSTEMS
BOWLING GREEN STATE U FIRELANDS CAMPUS (901 RYE BEACH RD in HURON, OH)
STATE MASTER (Ohio general info) - AIR MAJOR, RCRA-OH0000990291, HAZARDOUS WASTE PROGRAM Conditionally Exempt Small Quantity Generators, less than 100 kg/month of hazardous waste (Resource Conservation and Recovery Act (tracking hazardous waste)) - notification Organizations: STATE OF OHIO (CONTACT/OWNER)
Alternative names: BOWLING GREEN STATE UNIV FIRELANDS
BARNES NURSERY INC (3511 CLEVELAND ROAD W in HURON, OH)
Conditionally Exempt Small Quantity Generators, less than 100 kg/month of hazardous waste (Resource Conservation and Recovery Act (tracking hazardous waste)) Organizations: ROBERT W BARNES (CONTACT/OPERATOR)
Housing units lacking complete plumbing facilities: 0.4% Housing units lacking complete kitchen facilities: 1.1%
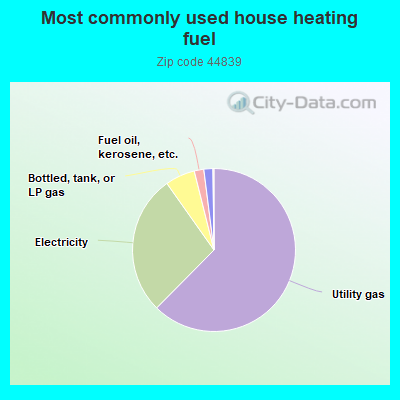
62.5%Utility gas
27.8%Electricity
5.9%Bottled, tank, or LP gas
1.9%Fuel oil, kerosene, etc.
1.8%Wood
Population in 1990: 10,386. Population change in the 1990s: +1,886 (+18.2%).
Place of birth for U.S.-born residents:
This state: 9,547
Northeast: 949
Midwest: 1,107
South: 554
West: 223
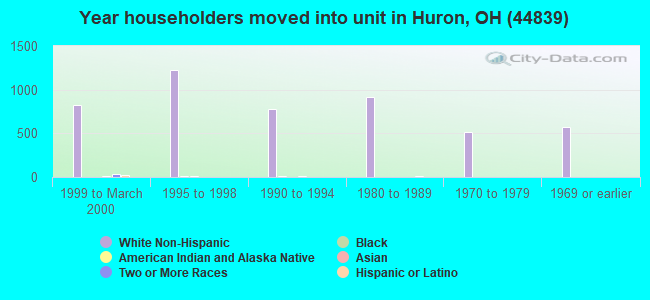
61% of the 44839 zip code residents lived in the same house 5 years ago. Out of people who lived in different houses, 61% lived in this county. Out of people who lived in different counties, 50% lived in Ohio.
93% of the 44839 zip code residents lived in the same house 1 year ago. Out of people who lived in different houses, 30% moved from this county. Out of people who lived in different houses, 61% moved from different county within same state. Out of people who lived in different houses, 12% moved from different state. Out of people who lived in different houses, 5% moved from abroad.
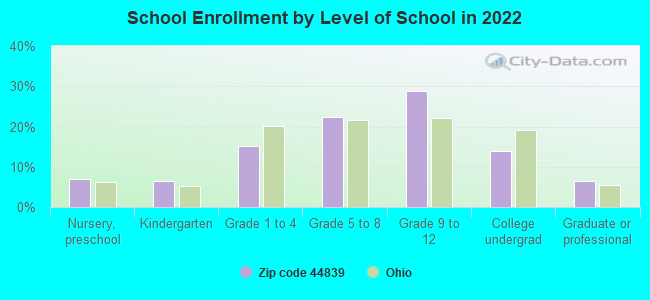
Private vs. public school enrollment:
Students in private schools in grades 1 to 8 (elementary and middle school): 227
Here:
25.3%
Ohio:
16.0%
Students in private schools in grades 9 to 12 (high school): 46
Here:
6.8%
Ohio:
13.1%
Students in private undergraduate colleges: 29
Here:
8.9%
Ohio:
22.3%
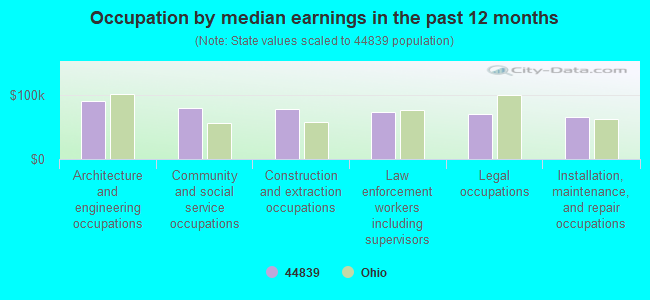
Occupation by median earnings in the past 12 months ($)
89,762Architecture and engineering occupations
79,059Community and social service occupations
77,976Construction and extraction occupations
73,137Law enforcement workers including supervisors
69,746Legal occupations
65,352Installation, maintenance, and repair occupations
Companies with federal contracts located in this zip code:
PACIFIC OIL COOLER SERVICE OF (1710 SAWMILL PARKWAY in HURON, OH; small business) : $470,124 in 10 contractsfrom 2003 to 2004
Contracts for Engine Cooling System Components, Nonaircraft, Vehicular Power Transmission Components by Army Signed by year:2000: $0; 2001: $0; 2002: $0; 2003: $0; 2004: $470,124; 2005: $0; 2006: $0.
Biggest contracts:
$470,124 with Army for Engine Cooling System Components, Nonaircraft. Signed on 2004-06-14. Completion date: 2005-05-16.
$163,500, same as above.Signed on 2003-04-15. Completion date: 2003-11-12.
$148,785, same as above.Signed on 2003-08-11. Completion date: 2004-01-28.
$83,160 with Army for Vehicular Power Transmission Components. Signed on 2003-06-25. Completion date: 2004-01-22.
DAN-MAR COMPANY INC (10319 WIKEL RD in HURON, OH) : $125,216 in 4 contractsfrom 2005 to 2006
$65,000 with Defense Logistics Agency for Lubrication and Fuel Dispensing Equipment. Signed on 2006-06-12. Completion date: 2006-11-13.
$45,456, same as above.Signed on 2005-09-16. Completion date: 2006-01-14.
$10,660, same as above.Signed on 2005-12-20. Completion date: 2006-03-21.
$4,100, same as above.Signed on 2005-12-20. Completion date: 2006-03-21.
HEATECH CLEANING SYSTEMS & EQU (360 N MAIN ST in HURON, OH; small business)
$3,488 with Air Force for Miscellaneous Maintenance and Repair Shop Specialized Equipment. Signed on 2006-02-10. Completion date: 2006-03-31.
Top industries in this zip code by the number of employees in 2005:
2002 - 2018 National Fire Incident Reporting System (NFIRS) incidents
According to the data from the years 2002 - 2018 the average number of fire incidents per year is 33. The highest number of fires - 44 took place in 2006, and the least - 20 in 2018. The data has a decreasing trend.
When looking into fire subcategories, the most incidents belonged to: Structure Fires (43.4%), and Outside Fires (39.5%).
Fire incident types reported to NFIRS in Zip Code 44839


 Nearest zip codes: 44846, 44814, 44826, 44857, 44089, 44870.


 According to the data from the years 2002 - 2018 the average number of fire incidents per year is 33. The highest number of fires - 44 took place in 2006, and the least - 20 in 2018. The data has a decreasing trend.
 When looking into fire subcategories, the most incidents belonged to: Structure Fires (43.4%), and Outside Fires (39.5%).