Estimated zip code population in 2022: 52,869 Zip code population in 2010: 52,613 Zip code population in 2000: 49,282
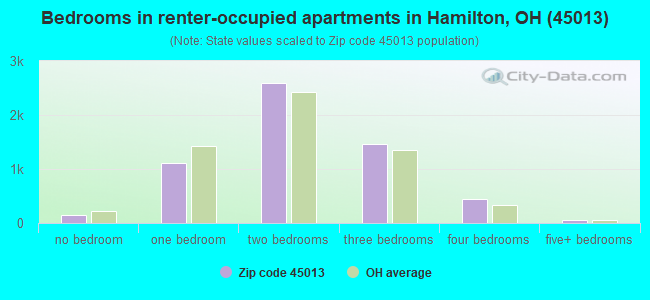
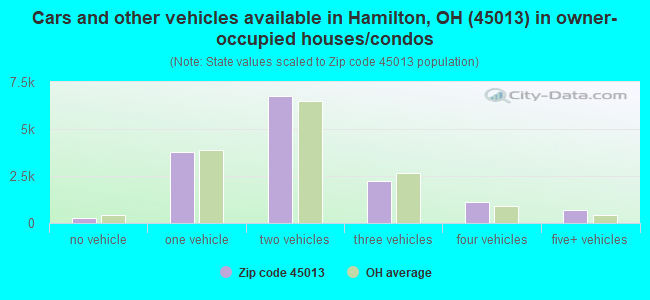
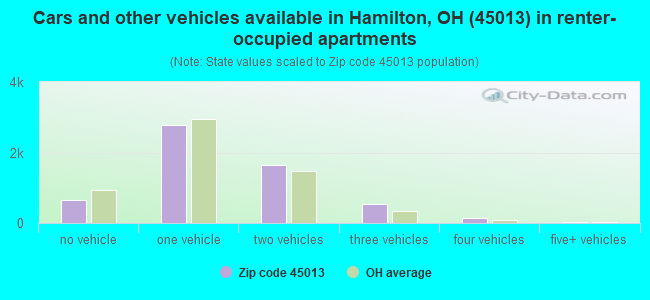
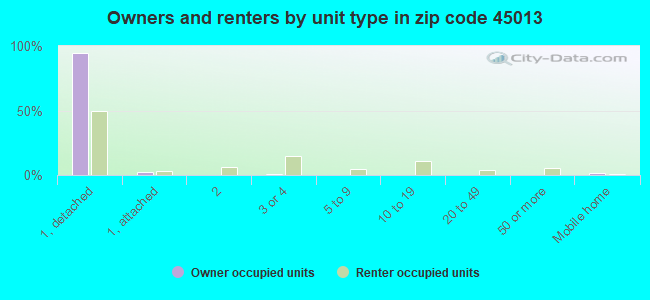
Houses and condos: 21,744 Renter-occupied apartments: 5,813
% of renters here:
28%
State:
33%
March 2022 cost of living index in zip code 45013: 88.2 (less than average, U.S. average is 100)
Land area: 115.5 sq. mi. Water area: 0.6 sq. mi.
Population density: 458 people per square mile
(low).
OSM Map
General Map
Google Map
MSN Map
OSM Map
General Map
Google Map
MSN Map
OSM Map
General Map
Google Map
MSN Map
OSM Map
General Map
Google Map
MSN Map
Please wait while loading the map...
Real estate property taxes paid for housing units in 2022:
This zip code:
1.0% ($2,263)
Ohio:
1.3% ($2,639)
Median real estate property taxes paid for housing units with mortgages in 2022: $2,270 (1.0%) Median real estate property taxes paid for housing units with no mortgage in 2022: $2,263 (1.1%)
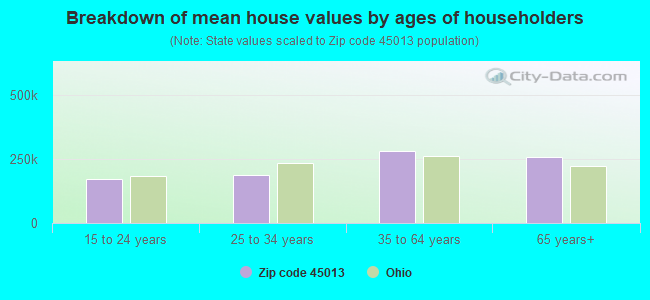
Estimated median house/condo value in 2022: $217,016
45013:
$217,016
Ohio:
$204,100
According to our research of Ohio and other state lists, there were 61 registered sex offenders living in 45013 zip code as of April 27, 2024. The ratio of all residents to sex offenders in zip code 45013 is 882 to 1. The ratio of registered sex offenders to all residents in this zip code is lower than the state average.
Median resident age:
This zip code:
38.7 years
Ohio median age:
39.9 years
Average household size:
This zip code:
2.5 people
Ohio:
2.4 people
Averages for the 2020 tax year for zip code 45013, filed in 2021:
Average Adjusted Gross Income (AGI) in 2020: $60,120 (Individual Income Tax Returns)
Here:
$60,120
State:
$67,288
Salary/wage: $50,083 (reported on 81.1% of returns)
Here:
$50,083
State:
$55,628
(% of AGI for various income ranges: 1154.5% for AGIs below $25k, 3553.0% for AGIs $25k-50k, 6336.3% for AGIs $50k-75k, 9377.8% for AGIs $75k-100k, 16479.6% for AGIs $100k-200k, 58963.0% for AGIs over 200k)
Taxable interest for individuals: $1,164 (reported on 23.7% of returns)
This zip code:
$1,164
Ohio:
$1,518
(% of AGI for various income ranges: 13.0% for AGIs below $25k, 13.8% for AGIs $25k-50k, 28.3% for AGIs $50k-75k, 58.3% for AGIs $75k-100k, 110.7% for AGIs $100k-200k, 847.0% for AGIs over 200k)
Ordinary dividends: $6,216 (reported on 17.9% of returns)
Here:
$6,216
State:
$7,167
(% of AGI for various income ranges: 21.1% for AGIs below $25k, 31.7% for AGIs $25k-50k, 98.6% for AGIs $50k-75k, 198.7% for AGIs $75k-100k, 449.3% for AGIs $100k-200k, 5573.0% for AGIs over 200k)
Net capital gain/loss in AGI: +$10,835 (reported on 13.8% of returns)
Here:
+$10,835
State:
+$18,919
(% of AGI for various income ranges: 8.4% for AGIs below $25k, 24.8% for AGIs $25k-50k, 70.3% for AGIs $50k-75k, 168.3% for AGIs $75k-100k, 550.3% for AGIs $100k-200k, 10982.5% for AGIs over 200k)
Profit/loss from business: +$16,386 (reported on 11.8% of returns)
Here:
+$16,386
State:
+$13,744
(% of AGI for various income ranges: 101.0% for AGIs below $25k, 122.2% for AGIs $25k-50k, 181.2% for AGIs $50k-75k, 367.0% for AGIs $75k-100k, 707.6% for AGIs $100k-200k, 6205.0% for AGIs over 200k)
Taxable individual retirement arrangement distribution: $18,641 (reported on 9.6% of returns)
45013:
$18,641
Ohio:
$18,876
(% of AGI for various income ranges: 58.2% for AGIs below $25k, 117.2% for AGIs $25k-50k, 196.9% for AGIs $50k-75k, 385.1% for AGIs $75k-100k, 832.8% for AGIs $100k-200k, 4017.0% for AGIs over 200k)
Self-employed (Keogh) retirement plans: $20,350 (reported on 0.3% of returns)
45013:
$20,350
Ohio:
$24,898
(% of AGI for various income ranges: 3.1% for AGIs below $25k, 27.5% for AGIs $100k-200k, 465.0% for AGIs over 200k)
Total itemized deductions: $29,519 (reported on 4.1% of returns)
Here:
$29,519
State:
$33,869
(% of AGI for various income ranges: 19.6% for AGIs below $25k, 51.3% for AGIs $25k-50k, 137.9% for AGIs $50k-75k, 263.4% for AGIs $75k-100k, 551.5% for AGIs $100k-200k, 4114.0% for AGIs over 200k)
Charity contributions: $11,308 (reported on 3.0% of returns)
Here:
$11,308
State:
$14,577
(% of AGI for various income ranges: 1.5% for AGIs below $25k, 5.9% for AGIs $25k-50k, 23.0% for AGIs $50k-75k, 52.2% for AGIs $75k-100k, 154.2% for AGIs $100k-200k, 2018.0% for AGIs over 200k)
Taxes paid: $6,727 (reported on 4.1% of returns)
45013:
$6,727
State:
$7,681
(% of AGI for various income ranges: 2.1% for AGIs below $25k, 7.9% for AGIs $25k-50k, 30.8% for AGIs $50k-75k, 57.7% for AGIs $75k-100k, 145.9% for AGIs $100k-200k, 924.5% for AGIs over 200k)
Earned income credit: $2,320 (reported on 14.2% of returns)
Here:
$2,320
State:
$2,304
(% of AGI for various income ranges: 92.0% for AGIs below $25k, 57.2% for AGIs $25k-50k, 0.9% for AGIs $50k-75k)
Percentage of individuals using paid preparers for their 2020 taxes: 93.8%
Here:
94%
State:
94%
(% for various income ranges: 93.2% for AGIs below $25k, 94.7% for AGIs $25k-50k, 93.8% for AGIs $50k-75k, 94.5% for AGIs $75k-100k, 92.5% for AGIs $100k-200k, 94.0% for AGIs over 200k)
Averages for the 2012 tax year for zip code 45013, filed in 2013:
Average Adjusted Gross Income (AGI) in 2012: $48,441 (Individual Income Tax Returns)
Here:
$48,441
State:
$54,926
Salary/wage: $40,986 (reported on 82.3% of returns)
Here:
$40,986
State:
$45,869
(% of AGI for various income ranges: 72.3% for AGIs below $25k, 74.9% for AGIs $25k-50k, 73.7% for AGIs $50k-75k, 74.1% for AGIs $75k-100k, 70.9% for AGIs $100k-200k, 40.4% for AGIs over 200k)
Taxable interest for individuals: $1,112 (reported on 29.0% of returns)
This zip code:
$1,112
Ohio:
$1,297
(% of AGI for various income ranges: 1.0% for AGIs below $25k, 0.5% for AGIs $25k-50k, 0.5% for AGIs $50k-75k, 0.6% for AGIs $75k-100k, 0.7% for AGIs $100k-200k, 1.0% for AGIs over 200k)
Ordinary dividends: $5,396 (reported on 20.7% of returns)
Here:
$5,396
State:
$5,821
(% of AGI for various income ranges: 1.3% for AGIs below $25k, 1.0% for AGIs $25k-50k, 1.4% for AGIs $50k-75k, 1.6% for AGIs $75k-100k, 2.4% for AGIs $100k-200k, 8.1% for AGIs over 200k)
Net capital gain/loss in AGI: +$9,243 (reported on 13.1% of returns)
Here:
+$9,243
State:
+$11,232
(% of AGI for various income ranges: 0.3% for AGIs $25k-50k, 0.3% for AGIs $50k-75k, 1.0% for AGIs $75k-100k, 1.6% for AGIs $100k-200k, 17.3% for AGIs over 200k)
Profit/loss from business: +$15,017 (reported on 12.0% of returns)
Here:
+$15,017
State:
+$12,773
(% of AGI for various income ranges: 6.8% for AGIs below $25k, 2.7% for AGIs $25k-50k, 2.3% for AGIs $50k-75k, 2.1% for AGIs $75k-100k, 4.1% for AGIs $100k-200k, 7.2% for AGIs over 200k)
Taxable individual retirement arrangement distribution: $14,534 (reported on 11.6% of returns)
45013:
$14,534
Ohio:
$14,511
(% of AGI for various income ranges: 3.4% for AGIs below $25k, 2.6% for AGIs $25k-50k, 3.0% for AGIs $50k-75k, 3.5% for AGIs $75k-100k, 4.2% for AGIs $100k-200k, 4.3% for AGIs over 200k)
Self-employment retirement plans: $16,211 (reported on 0.4% of returns)
45013:
$16,211
Ohio:
$20,257
(% of AGI for various income ranges: 0.1% for AGIs $50k-75k, 0.2% for AGIs $100k-200k, 0.5% for AGIs over 200k)
Total itemized deductions: $18,088 (20% of AGI, reported on 30.0% of returns)
Here:
$18,088
State:
$21,278
Here:
20.3% of AGI
State:
18.8% of AGI
(% of AGI for various income ranges: 6.1% for AGIs below $25k, 8.3% for AGIs $25k-50k, 10.7% for AGIs $50k-75k, 12.7% for AGIs $75k-100k, 14.5% for AGIs $100k-200k, 12.7% for AGIs over 200k)
Charity contributions: $3,365 (reported on 22.1% of returns)
Here:
$3,365
State:
$3,943
(% of AGI for various income ranges: 0.5% for AGIs below $25k, 0.9% for AGIs $25k-50k, 1.3% for AGIs $50k-75k, 1.5% for AGIs $75k-100k, 2.0% for AGIs $100k-200k, 3.2% for AGIs over 200k)
Taxes paid: $6,961 (reported on 29.9% of returns)
45013:
$6,961
State:
$9,568
(% of AGI for various income ranges: 1.1% for AGIs below $25k, 2.5% for AGIs $25k-50k, 3.6% for AGIs $50k-75k, 4.9% for AGIs $75k-100k, 6.3% for AGIs $100k-200k, 6.4% for AGIs over 200k)
Earned income credit: $2,272 (reported on 17.3% of returns)
Here:
$2,272
State:
$2,285
(% of AGI for various income ranges: 6.3% for AGIs below $25k, 0.9% for AGIs $25k-50k)
Percentage of individuals using paid preparers for their 2012 taxes: 52.7%
Here:
53%
State:
51%
(% for various income ranges: 46.7% for AGIs below $25k, 54.4% for AGIs $25k-50k, 57.6% for AGIs $50k-75k, 56.8% for AGIs $75k-100k, 57.0% for AGIs $100k-200k, 78.8% for AGIs over 200k)
Averages for the 2004 tax year for zip code 45013, filed in 2005:
Average Adjusted Gross Income (AGI) in 2004: $41,927 (Individual Income Tax Returns)
Here:
$41,927
State:
$44,480
Salary/wage: $36,588 (reported on 84.6% of returns)
Here:
$36,588
State:
$39,198
(% of AGI for various income ranges: 102.1% for AGIs below $10k, 72.8% for AGIs $10k-25k, 79.7% for AGIs $25k-50k, 79.4% for AGIs $50k-75k, 79.7% for AGIs $75k-100k, 57.2% for AGIs over 100k)
Taxable interest for individuals: $1,423 (reported on 40.7% of returns)
This zip code:
$1,423
Ohio:
$1,532
(% of AGI for various income ranges: 4.9% for AGIs below $10k, 2.2% for AGIs $10k-25k, 1.2% for AGIs $25k-50k, 1.1% for AGIs $50k-75k, 0.8% for AGIs $75k-100k, 1.7% for AGIs over 100k)
Taxable dividends: $3,742 (reported on 23.8% of returns)
Here:
$3,742
State:
$3,496
(% of AGI for various income ranges: 3.7% for AGIs below $10k, 1.6% for AGIs $10k-25k, 1.0% for AGIs $25k-50k, 1.3% for AGIs $50k-75k, 1.6% for AGIs $75k-100k, 4.6% for AGIs over 100k)
Net capital gain/loss: +$8,456 (reported on 17.1% of returns)
Here:
+$8,456
State:
+$8,582
(% of AGI for various income ranges: -1.1% for AGIs below $10k, 0.3% for AGIs $10k-25k, 0.5% for AGIs $25k-50k, 1.2% for AGIs $50k-75k, 1.7% for AGIs $75k-100k, 11.2% for AGIs over 100k)
Profit/loss from business: +$12,546 (reported on 11.8% of returns)
Here:
+$12,546
State:
+$10,813
(% of AGI for various income ranges: 7.1% for AGIs below $10k, 4.9% for AGIs $10k-25k, 2.8% for AGIs $25k-50k, 2.6% for AGIs $50k-75k, 3.7% for AGIs $75k-100k, 4.4% for AGIs over 100k)
IRA payment deduction: $3,033 (reported on 1.9% of returns)
45013:
$3,033
Ohio:
$2,794
(% of AGI for various income ranges: 0.1% for AGIs $10k-25k, 0.2% for AGIs $25k-50k, 0.2% for AGIs $50k-75k, 0.1% for AGIs $75k-100k, 0.1% for AGIs over 100k)
Self-employed pension: $10,623 (reported on 0.6% of returns)
Here:
$10,623
Ohio:
$13,981
(% of AGI for various income ranges: 0.1% for AGIs $25k-50k, 0.0% for AGIs $50k-75k, 0.2% for AGIs $75k-100k, 0.4% for AGIs over 100k)
Total itemized deductions: $15,454 (22% of AGI, reported on 36.5% of returns)
Here:
$15,454
State:
$17,503
Here:
21.7% of AGI
State:
20.8% of AGI
(% of AGI for various income ranges: 11.9% for AGIs below $10k, 7.6% for AGIs $10k-25k, 11.5% for AGIs $25k-50k, 14.3% for AGIs $50k-75k, 15.6% for AGIs $75k-100k, 15.6% for AGIs over 100k)
Charity contributions deductions: $2,769 (4% of AGI, reported on 29.6% of returns)
Here:
$2,769
State:
$3,087
Here:
3.7% of AGI
State:
3.4% of AGI
(% of AGI for various income ranges: 0.6% for AGIs below $10k, 0.8% for AGIs $10k-25k, 1.3% for AGIs $25k-50k, 1.7% for AGIs $50k-75k, 2.0% for AGIs $75k-100k, 3.4% for AGIs over 100k)
Total tax: $5,455 (reported on 78.2% of returns)
45013:
$5,455
State:
$6,781
(% of AGI for various income ranges: 2.7% for AGIs below $10k, 4.4% for AGIs $10k-25k, 7.4% for AGIs $25k-50k, 8.9% for AGIs $50k-75k, 10.5% for AGIs $75k-100k, 16.9% for AGIs over 100k)
Earned income credit: $1,652 (reported on 12.5% of returns)
Here:
$1,652
State:
$1,696
Percentage of individuals using paid preparers for their 2004 taxes: 55.4%
Here:
55%
State:
55%
(% for various income ranges: 43.8% for AGIs below $10k, 55.3% for AGIs $10k-25k, 60.2% for AGIs $25k-50k, 56.4% for AGIs $50k-75k, 57.0% for AGIs $75k-100k, 63.1% for AGIs over 100k)
Likely homosexual households (counted as self-reported same-sex unmarried-partner households)
Lesbian couples: 0.0% of all households
Gay men: 0.1% of all households
Household received Food Stamps/SNAP in the past 12 months: 2,328 Household did not receive Food Stamps/SNAP in the past 12 months: 18,285
Women who had a birth in the past 12 months: 629 (299 now married, 324 unmarried) Women who did not have a birth in the past 12 months: 10,889 (4,642 now married, 6,246 unmarried)
Housing units in zip code 45013 with a mortgage: 9,137 (749 second mortgage, 19 home equity loan, 593 both second mortgage and home equity loan) Houses without a mortgage: 271
Median monthly owner costs for units with a mortgage: $1,395 Median monthly owner costs for units without a mortgage: $554
Residents with income below the poverty level in 2022:
This zip code:
10.4%
Whole state:
13.4%
Residents with income below 50% of the poverty level in 2022:
This zip code:
5.2%
Whole state:
7.0%
Median number of rooms in houses and condos:
Here:
6.7
State:
6.7
Median number of rooms in apartments:
Here:
4.8
State:
4.4
Notable locations in this zip code not listed on our city pages
Notable locations in zip code 45013: Shandon Station (A), Camp Ross Trail (B), Tri-State Dragway (C), Village of New Miami Wastewater Treatment Plant (D), Owens Orchards (E), Potters Park Municipal Golf Course (F), Twin Run Golf Course (G), Holiday Auto Theatre (H), Ross Township Fire Department Station 2 Headquarters (I), City of Hamilton Fire Department Station 1 (J), Hanover Township Fire and Emergency Medical Services (K), Ross Township Fire Department Station 1 (L), Milford Township Fire Department Station 1 (M), Morgan Township Volunteer Fire Department Shandon Station (N), City of Hamilton Fire Department Station 4 (O). Display/hide their locations on the map
Shopping Centers: Town and Country Shopping Center (1), Hamilton West Shopping Center (2), Churchway Mall Shopping Center (3), West Shopping Center (4), Twinbrook Plaza Shopping Center (5), Champion West Shopping Center (6), Hamilton Meadows Shopping Center (7), Plaza West Shopping Center (8). Display/hide their locations on the map
Churches in zip code 45013 include: Western Avenue Church of God (A), Westview Church of Christ (B), Ross Avenue Church of God (C), Park Avenue United Methodist Church (D), Landmark Baptist Church (E), Saint Charles Methodist Church (F), Immanuel Lutheran Church (G), McGonigle-Millville United Methodist Church (H), Queen of Peace Roman Catholic Church (I). Display/hide their locations on the map
Cemeteries: Scott Cemetery (1), Bethel Cemetery (2), Butterfield Cemetery (3), Shandon Cemetery (4), Saint Charles Cemetery (5), Ross Township Cemetery (6), Fenton Cemetery (7). Display/hide their locations on the map
Reservoirs: Bunker Hill Haven Lake (A), Dever Pond (B), Island Pond (C), Tanglewood Lake (D), Holiday Lake (E), Camp Ross Trails Lake (F), Island Fishing Lakes (G). Display/hide their locations on the map
Streams, rivers, and creeks: Lick Run (A), Becketts Run (B), Beals Run (C), Sevenmile Creek (D), Indian Creek (E), Salmon Run (F), Stony Run (G), Twomile Creek (H). Display/hide their locations on the map
Parks in zip code 45013 include: Kingston Tot Lot (1), Sanders Park (2), Schwartzwald Playground (3), Smalley Playfield (4), Virginia Avenue Park (5), Wilson Pool (6), Rossville Historic District (7), Sutherland Park (8), Thompson Park (9). Display/hide their locations on the map
7,236 married couples with children.
3,737 single-parent households (1,113 men, 2,624 women).
97.9% of residents of 45013 zip code speak English at home.
1.1% of residents speak Spanish at home (75% very well, 7% well, 11% not well, 7% not at all).
0.5% of residents speak other Indo-European language at home (100% very well).
0.3% of residents speak Asian or Pacific Island language at home (68% very well, 23% well, 9% not at all).
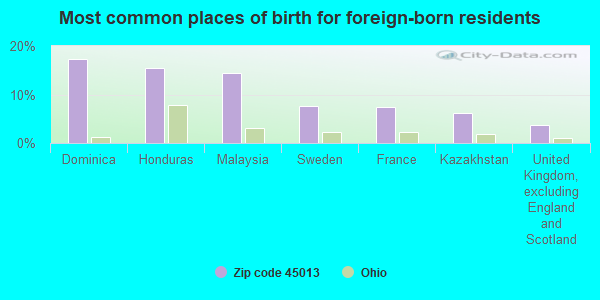
Foreign born population: 694 (1.3%) (54.7% of them are naturalized citizens)
This zip code:
1.3%
Whole state:
5.0%
17%Dominica
16%Honduras
14%Malaysia
8%Sweden
7%France
6%Kazakhstan
4%United Kingdom, excluding England and Scotland
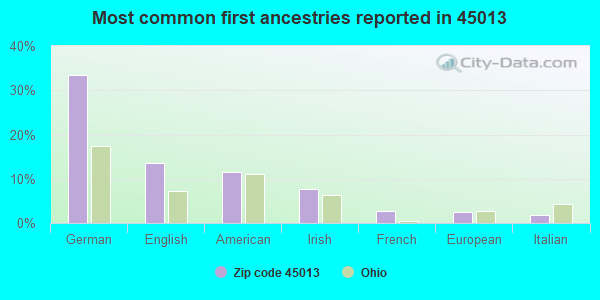
33%German
14%English
11%American
8%Irish
3%French
2%European
2%Italian
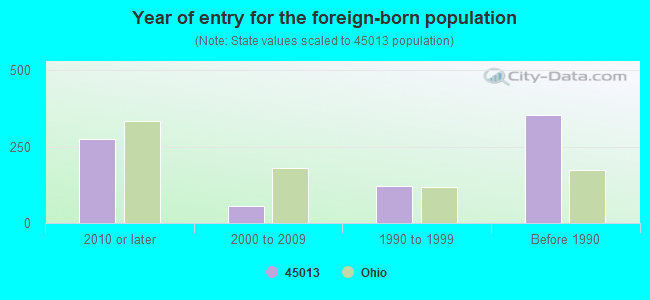
Year of entry for the foreign-born population
2752010 or later
562000 to 2009
1211990 to 1999
353Before 1990
Facilities with environmental interests located in this zip code:
BP OIL CO * (202 MAIN ST in HAMILTON, OH)
STATE MASTER (Ohio general info) - RCRA-OHD987014313, HAZARDOUS WASTE PROGRAM, AIR MAJOR STATE MASTER (Ohio general info) - -09-5541-659-1, EPCRA Conditionally Exempt Small Quantity Generators, less than 100 kg/month of hazardous waste (Resource Conservation and Recovery Act (tracking hazardous waste)) - notification Business SIC classification: GASOLINE SERVICE STATIONS Organizations: BP OIL COMPANY (CONTACT/OWNER)
Alternative names: BP OIL SITE NO 09186 *
ACCURATE RACK CO (253 EDGEWOOD AVE in HAMILTON, OH)
AIR MINOR (AIRS/AFS) STATE MASTER (Ohio general info) - AIR MAJOR, EPCRA Small Quantity Generators, between 100 kg and 1000 kg of hazardous waste/month (Resource Conservation and Recovery Act (tracking hazardous waste)) - notification TRI REPORTER (Tracking of toxic chemicals releasing facilities) Business SIC classification: MISCELLANEOUS FABRICATED WIRE PRODUCTS; FABRICATED METAL PRODUCTS Organizations: FAULMAN WILLIAM (CONTACT/OWNER)
Alternative names: ASSOCIATED RACK CORP. ACCURATE RACK CO.
BOWLING GASTON INC (3370 HAMILTON CLEVES HWY in HAMILTON, OH)
STATE MASTER (Ohio general info) - RCRA-OHD986998136, HAZARDOUS WASTE PROGRAM Small Quantity Generators, between 100 kg and 1000 kg of hazardous waste/month (Resource Conservation and Recovery Act (tracking hazardous waste)) - notification TRANSPORTER (Resource Conservation and Recovery Act (tracking hazardous waste)) - notification Organizations: UNKNOWN (CONTACT/OWNER)
BP OIL CO SITE 09262 (811 LIBERTY ST in HAMILTON, OH)
(Resource Conservation and Recovery Act (tracking hazardous waste)) Organizations: BP OIL COMPANY (CONTACT/OWNER)
Housing units lacking complete plumbing facilities: 1.3% Housing units lacking complete kitchen facilities: 2.3%
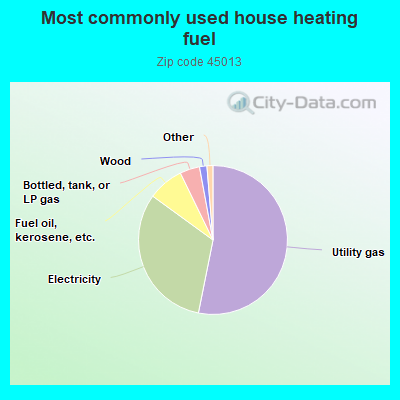
53.2%Utility gas
31.9%Electricity
7.8%Fuel oil, kerosene, etc.
4.3%Bottled, tank, or LP gas
1.6%Wood
0.7%Other fuel
0.5%No fuel used
Population in 1990: 48,553. Population change in the 1990s: +729 (+1.5%).
Place of birth for U.S.-born residents:
This state: 43,131
Northeast: 1,272
Midwest: 2,002
South: 4,868
West: 653
61% of the 45013 zip code residents lived in the same house 5 years ago. Out of people who lived in different houses, 76% lived in this county. Out of people who lived in different counties, 50% lived in Ohio.
91% of the 45013 zip code residents lived in the same house 1 year ago. Out of people who lived in different houses, 60% moved from this county. Out of people who lived in different houses, 26% moved from different county within same state. Out of people who lived in different houses, 13% moved from different state. Out of people who lived in different houses, 1% moved from abroad.
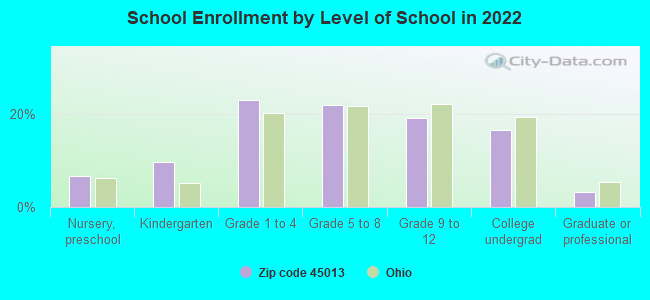
Private vs. public school enrollment:
Students in private schools in grades 1 to 8 (elementary and middle school): 579
Here:
10.5%
Ohio:
16.0%
Students in private schools in grades 9 to 12 (high school): 236
Here:
10.1%
Ohio:
13.1%
Students in private undergraduate colleges: 380
Here:
18.7%
Ohio:
22.3%
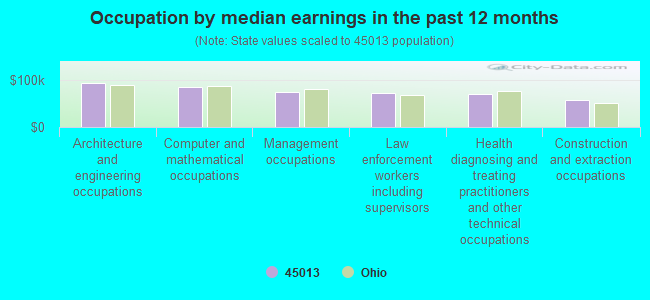
Occupation by median earnings in the past 12 months ($)
93,059Architecture and engineering occupations
83,739Computer and mathematical occupations
73,873Management occupations
72,951Law enforcement workers including supervisors
69,744Health diagnosing and treating practitioners and other technical occupations
57,305Construction and extraction occupations
Companies with federal contracts located in this zip code:
SONITROL SYSTEMS OF BUTLER COU (900 ROSS AVENUE in HAMILTON, OH; small business)
$67,570 with Defense Logistics Agency for X-Ray Equipment and Supplies: Medical, Dental, Veterinary. Signed on 2000-10-30. Completion date: 2001-11-30.
Top industries in this zip code by the number of employees in 2005:
Administrative and Support and Waste Management and Remediation Services: Employment Placement Agencies (over 1000 employees: 1 establishment)
Administrative and Support and Waste Management and Remediation Services: Remediation Services (over 1000: 1)
Health Care and Social Assistance: General Medical and Surgical Hospitals (over 1000: 1)
2002 - 2018 National Fire Incident Reporting System (NFIRS) incidents
According to the data from the years 2002 - 2018 the average number of fires per year is 171. The highest number of reported fire incidents - 244 took place in 2008, and the least - 124 in 2013. The data has an increasing trend.
When looking into fire subcategories, the most reports belonged to: Outside Fires (42.1%), and Structure Fires (39.8%).
Fire incident types reported to NFIRS in Zip Code 45013

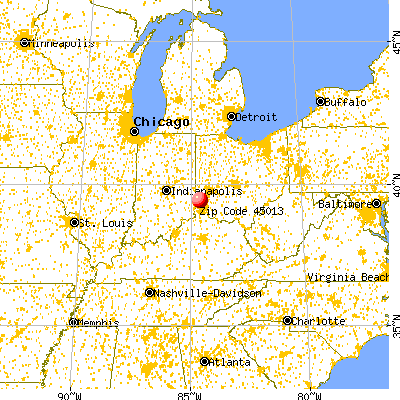


 Nearest zip codes: 45015, 45062, 45056, 45014, 45252, 45053.


 According to the data from the years 2002 - 2018 the average number of fires per year is 171. The highest number of reported fire incidents - 244 took place in 2008, and the least - 124 in 2013. The data has an increasing trend.
 When looking into fire subcategories, the most reports belonged to: Outside Fires (42.1%), and Structure Fires (39.8%).