Estimated zip code population in 2022: 24,012 Zip code population in 2010: 24,915 Zip code population in 2000: 22,315
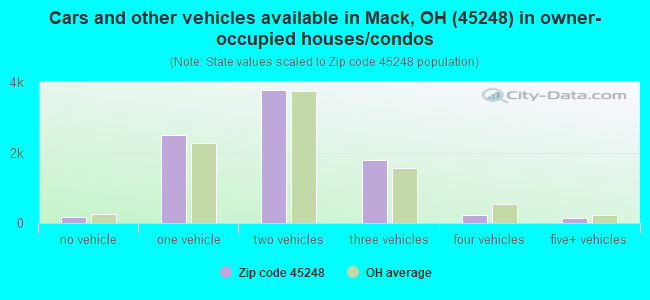
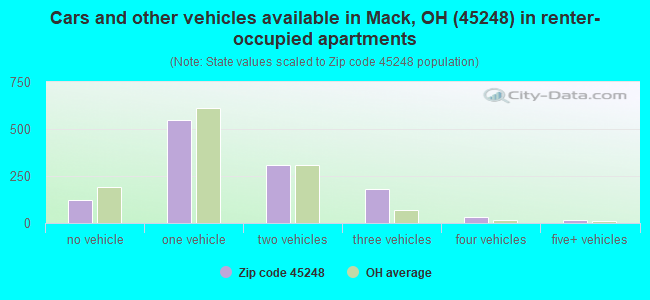
Houses and condos: 9,840 Renter-occupied apartments: 1,215
% of renters here:
12%
State:
33%
March 2022 cost of living index in zip code 45248: 88.0 (less than average, U.S. average is 100)
Land area: 11.9 sq. mi. Water area: 0.0 sq. mi.
Population density: 2,018 people per square mile
(low).
OSM Map
General Map
Google Map
MSN Map
OSM Map
General Map
Google Map
MSN Map
OSM Map
General Map
Google Map
MSN Map
OSM Map
General Map
Google Map
MSN Map
Please wait while loading the map...
Real estate property taxes paid for housing units in 2022:
This zip code:
1.3% ($2,863)
Ohio:
1.3% ($2,639)
Median real estate property taxes paid for housing units with mortgages in 2022: $2,926 (1.3%) Median real estate property taxes paid for housing units with no mortgage in 2022: $2,772 (1.4%)
Business Search- 14 Million verified businesses
Males: 11,633
(48.4%)
Females: 12,378
(51.6%)
For population 25 years and over in 45248:
High school or higher: 94.8%
Bachelor's degree or higher: 35.0%
Graduate or professional degree: 11.1%
Unemployed: 2.3%
Mean travel time to work (commute): 24.3 minutes
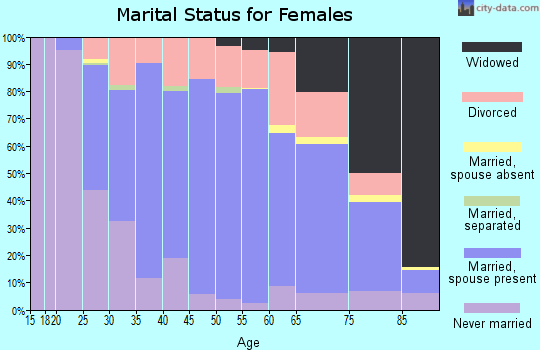
For population 15 years and over in 45248:
Never married: 27.6%
Now married: 54.2%
Separated: 1.2%
Widowed: 6.0%
Divorced: 11.0%
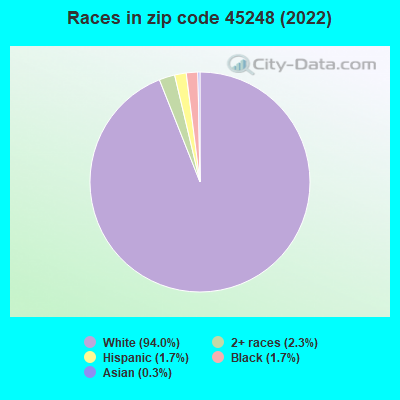
Zip code 45248 compared to state average:
Black race population percentage significantly below state average.
Hispanic race population percentage below state average.
Foreign-born population percentage significantly below state average.
Renting percentage significantly below state average.
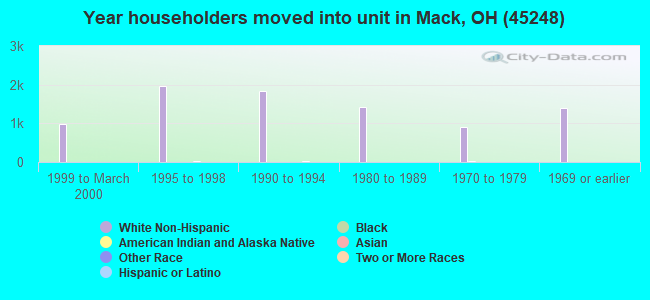
Length of stay since moving in above state average.
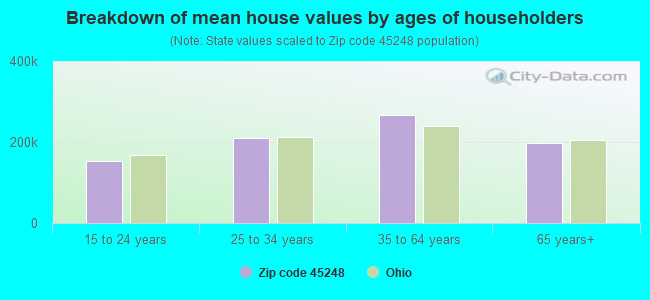
Estimated median house/condo value in 2022: $212,117
45248:
$212,117
Ohio:
$204,100
According to our research of Ohio and other state lists, there were 8 registered sex offenders living in 45248 zip code as of April 27, 2024. The ratio of all residents to sex offenders in zip code 45248 is 3,142 to 1. The ratio of registered sex offenders to all residents in this zip code is much lower than the state average.
Median resident age:
This zip code:
40.2 years
Ohio median age:
39.9 years
Average household size:
This zip code:
2.4 people
Ohio:
2.4 people
Averages for the 2020 tax year for zip code 45248, filed in 2021:
Average Adjusted Gross Income (AGI) in 2020: $77,722 (Individual Income Tax Returns)
Here:
$77,722
State:
$67,288
Salary/wage: $61,966 (reported on 80.9% of returns)
Here:
$61,966
State:
$55,628
(% of AGI for various income ranges: 1188.4% for AGIs below $25k, 3635.6% for AGIs $25k-50k, 6356.0% for AGIs $50k-75k, 9507.3% for AGIs $75k-100k, 17739.0% for AGIs $100k-200k, 80348.8% for AGIs over 200k)
Taxable interest for individuals: $1,324 (reported on 33.7% of returns)
This zip code:
$1,324
Ohio:
$1,518
(% of AGI for various income ranges: 20.0% for AGIs below $25k, 27.3% for AGIs $25k-50k, 53.7% for AGIs $50k-75k, 63.3% for AGIs $75k-100k, 139.7% for AGIs $100k-200k, 947.1% for AGIs over 200k)
Ordinary dividends: $8,106 (reported on 30.6% of returns)
Here:
$8,106
State:
$7,167
(% of AGI for various income ranges: 52.3% for AGIs below $25k, 70.2% for AGIs $25k-50k, 131.8% for AGIs $50k-75k, 294.8% for AGIs $75k-100k, 653.7% for AGIs $100k-200k, 10102.9% for AGIs over 200k)
Net capital gain/loss in AGI: +$12,240 (reported on 22.3% of returns)
Here:
+$12,240
State:
+$18,919
(% of AGI for various income ranges: 13.4% for AGIs below $25k, 52.1% for AGIs $25k-50k, 88.4% for AGIs $50k-75k, 236.0% for AGIs $75k-100k, 664.4% for AGIs $100k-200k, 13612.9% for AGIs over 200k)
Profit/loss from business: +$19,425 (reported on 12.3% of returns)
Here:
+$19,425
State:
+$13,744
(% of AGI for various income ranges: 109.4% for AGIs below $25k, 126.4% for AGIs $25k-50k, 202.8% for AGIs $50k-75k, 344.1% for AGIs $75k-100k, 732.2% for AGIs $100k-200k, 6285.3% for AGIs over 200k)
Taxable individual retirement arrangement distribution: $19,898 (reported on 13.1% of returns)
45248:
$19,898
Ohio:
$18,876
(% of AGI for various income ranges: 115.0% for AGIs below $25k, 161.3% for AGIs $25k-50k, 300.8% for AGIs $50k-75k, 509.2% for AGIs $75k-100k, 978.3% for AGIs $100k-200k, 3705.9% for AGIs over 200k)
Self-employed (Keogh) retirement plans: $27,878 (reported on 0.7% of returns)
45248:
$27,878
Ohio:
$24,898
(% of AGI for various income ranges: 55.6% for AGIs $100k-200k, 1070.6% for AGIs over 200k)
Total itemized deductions: $35,675 (reported on 5.4% of returns)
Here:
$35,675
State:
$33,869
(% of AGI for various income ranges: 75.6% for AGIs below $25k, 49.8% for AGIs $25k-50k, 143.9% for AGIs $50k-75k, 291.7% for AGIs $75k-100k, 591.5% for AGIs $100k-200k, 6112.9% for AGIs over 200k)
Charity contributions: $17,846 (reported on 4.0% of returns)
Here:
$17,846
State:
$14,577
(% of AGI for various income ranges: 6.8% for AGIs $25k-50k, 11.5% for AGIs $50k-75k, 47.7% for AGIs $75k-100k, 141.5% for AGIs $100k-200k, 4141.2% for AGIs over 200k)
Taxes paid: $7,451 (reported on 5.3% of returns)
45248:
$7,451
State:
$7,681
(% of AGI for various income ranges: 5.3% for AGIs below $25k, 8.0% for AGIs $25k-50k, 33.7% for AGIs $50k-75k, 86.7% for AGIs $75k-100k, 165.1% for AGIs $100k-200k, 915.9% for AGIs over 200k)
Earned income credit: $2,038 (reported on 9.5% of returns)
Here:
$2,038
State:
$2,304
(% of AGI for various income ranges: 65.2% for AGIs below $25k, 45.4% for AGIs $25k-50k, 1.0% for AGIs $50k-75k)
Percentage of individuals using paid preparers for their 2020 taxes: 92.1%
Here:
92%
State:
94%
(% for various income ranges: 90.5% for AGIs below $25k, 92.6% for AGIs $25k-50k, 92.5% for AGIs $50k-75k, 92.1% for AGIs $75k-100k, 92.0% for AGIs $100k-200k, 96.6% for AGIs over 200k)
Averages for the 2012 tax year for zip code 45248, filed in 2013:
Average Adjusted Gross Income (AGI) in 2012: $61,142 (Individual Income Tax Returns)
Here:
$61,142
State:
$54,926
Salary/wage: $52,005 (reported on 81.8% of returns)
Here:
$52,005
State:
$45,869
(% of AGI for various income ranges: 70.1% for AGIs below $25k, 74.2% for AGIs $25k-50k, 72.9% for AGIs $50k-75k, 75.9% for AGIs $75k-100k, 75.7% for AGIs $100k-200k, 51.2% for AGIs over 200k)
Taxable interest for individuals: $1,183 (reported on 40.4% of returns)
This zip code:
$1,183
Ohio:
$1,297
(% of AGI for various income ranges: 1.2% for AGIs below $25k, 0.7% for AGIs $25k-50k, 0.8% for AGIs $50k-75k, 0.6% for AGIs $75k-100k, 0.6% for AGIs $100k-200k, 1.0% for AGIs over 200k)
Ordinary dividends: $5,712 (reported on 34.1% of returns)
Here:
$5,712
State:
$5,821
(% of AGI for various income ranges: 2.8% for AGIs below $25k, 2.0% for AGIs $25k-50k, 2.1% for AGIs $50k-75k, 1.9% for AGIs $75k-100k, 2.8% for AGIs $100k-200k, 6.5% for AGIs over 200k)
Net capital gain/loss in AGI: +$6,471 (reported on 21.1% of returns)
Here:
+$6,471
State:
+$11,232
(% of AGI for various income ranges: 0.4% for AGIs $25k-50k, 0.7% for AGIs $50k-75k, 0.6% for AGIs $75k-100k, 1.7% for AGIs $100k-200k, 7.4% for AGIs over 200k)
Profit/loss from business: +$18,073 (reported on 11.8% of returns)
Here:
+$18,073
State:
+$12,773
(% of AGI for various income ranges: 5.8% for AGIs below $25k, 3.2% for AGIs $25k-50k, 2.4% for AGIs $50k-75k, 2.6% for AGIs $75k-100k, 2.8% for AGIs $100k-200k, 5.4% for AGIs over 200k)
Taxable individual retirement arrangement distribution: $16,567 (reported on 16.1% of returns)
45248:
$16,567
Ohio:
$14,511
(% of AGI for various income ranges: 7.1% for AGIs below $25k, 4.1% for AGIs $25k-50k, 4.2% for AGIs $50k-75k, 4.3% for AGIs $75k-100k, 4.7% for AGIs $100k-200k, 3.4% for AGIs over 200k)
Self-employment retirement plans: $18,100 (reported on 0.8% of returns)
45248:
$18,100
Ohio:
$20,257
(% of AGI for various income ranges: 0.2% for AGIs $25k-50k, 0.2% for AGIs $100k-200k, 0.7% for AGIs over 200k)
Total itemized deductions: $20,082 (19% of AGI, reported on 37.1% of returns)
Here:
$20,082
State:
$21,278
Here:
18.7% of AGI
State:
18.8% of AGI
(% of AGI for various income ranges: 9.1% for AGIs below $25k, 8.8% for AGIs $25k-50k, 11.8% for AGIs $50k-75k, 11.8% for AGIs $75k-100k, 14.2% for AGIs $100k-200k, 13.6% for AGIs over 200k)
Charity contributions: $3,812 (reported on 30.2% of returns)
Here:
$3,812
State:
$3,943
(% of AGI for various income ranges: 0.6% for AGIs below $25k, 0.7% for AGIs $25k-50k, 1.2% for AGIs $50k-75k, 1.3% for AGIs $75k-100k, 1.9% for AGIs $100k-200k, 4.1% for AGIs over 200k)
Taxes paid: $8,407 (reported on 36.9% of returns)
45248:
$8,407
State:
$9,568
(% of AGI for various income ranges: 1.6% for AGIs below $25k, 2.5% for AGIs $25k-50k, 4.0% for AGIs $50k-75k, 4.7% for AGIs $75k-100k, 6.8% for AGIs $100k-200k, 6.9% for AGIs over 200k)
Earned income credit: $2,026 (reported on 9.6% of returns)
Here:
$2,026
State:
$2,285
(% of AGI for various income ranges: 3.5% for AGIs below $25k, 0.6% for AGIs $25k-50k)
Percentage of individuals using paid preparers for their 2012 taxes: 47.8%
Here:
48%
State:
51%
(% for various income ranges: 42.1% for AGIs below $25k, 47.8% for AGIs $25k-50k, 52.1% for AGIs $50k-75k, 50.0% for AGIs $75k-100k, 48.7% for AGIs $100k-200k, 75.0% for AGIs over 200k)
Averages for the 2004 tax year for zip code 45248, filed in 2005:
Average Adjusted Gross Income (AGI) in 2004: $50,676 (Individual Income Tax Returns)
Here:
$50,676
State:
$44,480
Salary/wage: $44,029 (reported on 81.5% of returns)
Here:
$44,029
State:
$39,198
(% of AGI for various income ranges: 119.6% for AGIs below $10k, 66.4% for AGIs $10k-25k, 74.8% for AGIs $25k-50k, 76.7% for AGIs $50k-75k, 78.8% for AGIs $75k-100k, 61.1% for AGIs over 100k)
Taxable interest for individuals: $1,590 (reported on 57.5% of returns)
This zip code:
$1,590
Ohio:
$1,532
(% of AGI for various income ranges: 7.2% for AGIs below $10k, 3.5% for AGIs $10k-25k, 1.9% for AGIs $25k-50k, 1.7% for AGIs $50k-75k, 1.4% for AGIs $75k-100k, 1.5% for AGIs over 100k)
Taxable dividends: $3,888 (reported on 40.8% of returns)
Here:
$3,888
State:
$3,496
(% of AGI for various income ranges: 8.6% for AGIs below $10k, 3.6% for AGIs $10k-25k, 2.1% for AGIs $25k-50k, 2.2% for AGIs $50k-75k, 2.3% for AGIs $75k-100k, 4.3% for AGIs over 100k)
Net capital gain/loss: +$6,145 (reported on 27.9% of returns)
Here:
+$6,145
State:
+$8,582
(% of AGI for various income ranges: -2.7% for AGIs below $10k, 0.4% for AGIs $10k-25k, 0.6% for AGIs $25k-50k, 0.7% for AGIs $50k-75k, 1.8% for AGIs $75k-100k, 7.8% for AGIs over 100k)
Profit/loss from business: +$15,655 (reported on 11.8% of returns)
Here:
+$15,655
State:
+$10,813
(% of AGI for various income ranges: 2.2% for AGIs below $10k, 4.2% for AGIs $10k-25k, 3.0% for AGIs $25k-50k, 2.4% for AGIs $50k-75k, 2.9% for AGIs $75k-100k, 5.0% for AGIs over 100k)
IRA payment deduction: $3,112 (reported on 2.9% of returns)
45248:
$3,112
Ohio:
$2,794
(% of AGI for various income ranges: 0.3% for AGIs $10k-25k, 0.3% for AGIs $25k-50k, 0.2% for AGIs $50k-75k, 0.1% for AGIs $75k-100k, 0.1% for AGIs over 100k)
Self-employed pension: $12,917 (reported on 1.1% of returns)
Here:
$12,917
Ohio:
$13,981
(% of AGI for various income ranges: 0.1% for AGIs $25k-50k, 0.1% for AGIs $50k-75k, 0.1% for AGIs $75k-100k, 0.5% for AGIs over 100k)
Total itemized deductions: $17,002 (20% of AGI, reported on 43.1% of returns)
Here:
$17,002
State:
$17,503
Here:
20.1% of AGI
State:
20.8% of AGI
(% of AGI for various income ranges: 15.3% for AGIs below $10k, 10.6% for AGIs $10k-25k, 12.7% for AGIs $25k-50k, 14.8% for AGIs $50k-75k, 16.4% for AGIs $75k-100k, 15.0% for AGIs over 100k)
Charity contributions deductions: $2,734 (3% of AGI, reported on 38.4% of returns)
Here:
$2,734
State:
$3,087
Here:
3.1% of AGI
State:
3.4% of AGI
(% of AGI for various income ranges: 0.9% for AGIs below $10k, 1.0% for AGIs $10k-25k, 1.4% for AGIs $25k-50k, 1.7% for AGIs $50k-75k, 2.0% for AGIs $75k-100k, 2.9% for AGIs over 100k)
Total tax: $7,461 (reported on 81.4% of returns)
45248:
$7,461
State:
$6,781
(% of AGI for various income ranges: 2.8% for AGIs below $10k, 4.6% for AGIs $10k-25k, 7.7% for AGIs $25k-50k, 9.2% for AGIs $50k-75k, 10.2% for AGIs $75k-100k, 18.2% for AGIs over 100k)
Earned income credit: $1,499 (reported on 6.0% of returns)
Here:
$1,499
State:
$1,696
Percentage of individuals using paid preparers for their 2004 taxes: 50.5%
Here:
50%
State:
55%
(% for various income ranges: 39.2% for AGIs below $10k, 48.7% for AGIs $10k-25k, 54.1% for AGIs $25k-50k, 54.2% for AGIs $50k-75k, 49.6% for AGIs $75k-100k, 60.4% for AGIs over 100k)
Likely homosexual households (counted as self-reported same-sex unmarried-partner households)
Lesbian couples: 0.1% of all households
Gay men: 0.3% of all households
Household received Food Stamps/SNAP in the past 12 months: 181 Household did not receive Food Stamps/SNAP in the past 12 months: 9,549
Women who had a birth in the past 12 months: 222 (224 now married, 2 unmarried) Women who did not have a birth in the past 12 months: 4,938 (2,215 now married, 2,721 unmarried)
Housing units in zip code 45248 with a mortgage: 5,826 (788 second mortgage, 24 home equity loan, 712 both second mortgage and home equity loan) Houses without a mortgage: 74
Median monthly owner costs for units with a mortgage: $1,409 Median monthly owner costs for units without a mortgage: $580
Residents with income below the poverty level in 2022:
This zip code:
5.2%
Whole state:
13.4%
Residents with income below 50% of the poverty level in 2022:
This zip code:
2.8%
Whole state:
7.0%
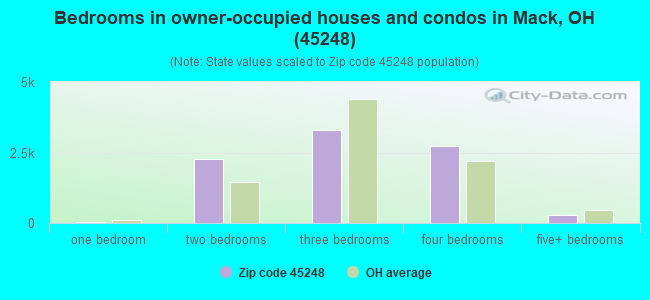
Median number of rooms in houses and condos:
Here:
6.8
State:
6.7
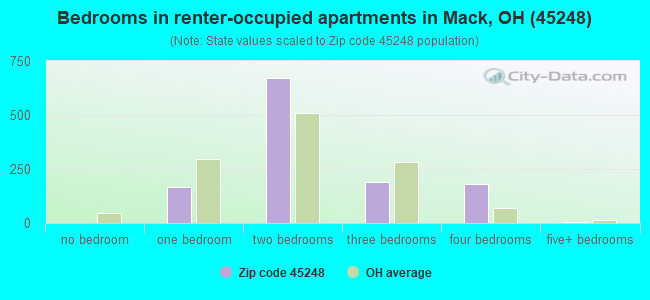
Median number of rooms in apartments:
Here:
5.2
State:
4.4
Notable locations in this zip code not listed on our city pages
Notable locations in zip code 45248: Neuman Golf Course (A), Hollmeyer's Orchards (B), Green Township Fire and Emergency Medical Services Department Station 53 (C), Green Township Fire and Emergency Medical Services Department Station 54 (D), Green Township Office (E). Display/hide their locations on the map
Churches in zip code 45248 include: Gloria Dei Church (A), Philippi Baptist Church (B), First Baptist Church of Christ (C), Kingdom Hall Church (D), Our Lady of Visitation Catholic Church (E), Saint Jude Catholic Church of Bridgetown (F), Oak Hills Church (G), Oak Hills United Methodist Church (H). Display/hide their locations on the map
In group quarters: 105 (-1 institutionalized population)
Size of family households: 2,737 2-persons, 1,328 3-persons, 1,321 4-persons, 754 5-persons, 162 6-persons, 24 7-or-more-persons
Size of nonfamily households: 2,809 1-person, 489 2-persons, 106 3-persons
4,304 married couples with children.
1,022 single-parent households (362 men, 660 women).
98.3% of residents of 45248 zip code speak English at home.
0.3% of residents speak Spanish at home (66% very well, 34% well).
0.7% of residents speak other Indo-European language at home (92% very well, 8% well).
0.3% of residents speak Asian or Pacific Island language at home (37% very well, 63% well).
0.1% of residents speak other language at home (35% very well, 65% well).
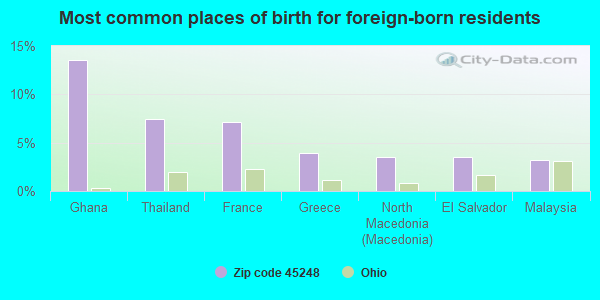
Foreign born population: 281 (1.2%) (61.2% of them are naturalized citizens)
This zip code:
1.2%
Whole state:
5.0%
14%Ghana
7%Thailand
7%France
4%Greece
4%North Macedonia (Macedonia)
4%El Salvador
3%Malaysia
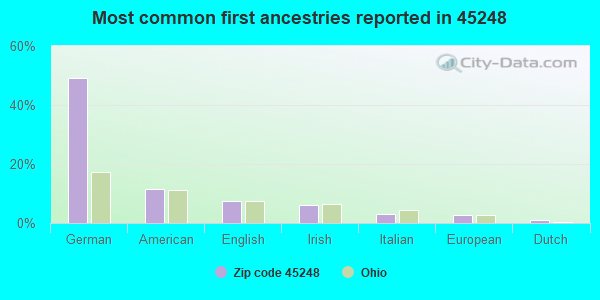
49%German
11%American
7%English
6%Irish
3%Italian
3%European
1%Dutch
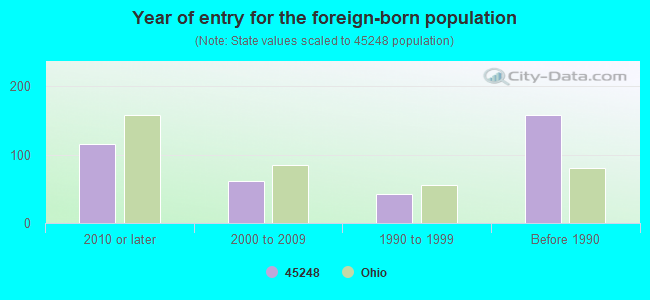
Year of entry for the foreign-born population
1162010 or later
622000 to 2009
431990 to 1999
158Before 1990
Facilities with environmental interests located in this zip code:
CEEMCO INC (5313 ROBERT AVE in CINCINNATI, OH)
AIR MINOR (AIRS/AFS) STATE MASTER (Ohio general info) - AIR MAJOR, RCRA-OHD004250346, HAZARDOUS WASTE PROGRAM Small Quantity Generators, between 100 kg and 1000 kg of hazardous waste/month (Resource Conservation and Recovery Act (tracking hazardous waste)) - notification Business SIC classification: OFFICE AND STORE FIXTURES, PARTITIONS, SHELVING, AND LOCKERS, EXCEPT WOOD
BP OIL NO 08842 (6115 BRIDGETOWN RD in CINCINNATI, OH)
STATE MASTER (Ohio general info) - AIR MAJOR, -31-5541-1038-M, EPCRA, RCRA-OHD987027984, HAZARDOUS WASTE PROGRAM Conditionally Exempt Small Quantity Generators, less than 100 kg/month of hazardous waste (Resource Conservation and Recovery Act (tracking hazardous waste)) - notification Organizations: BP OIL CO (CONTACT/OWNER)
, BP OIL COMPANY (CONTACT/OWNER)
Alternative names: BP OIL CO SITE 08842
CHARLES W SPRINGMYER ELEMENTA (4179 EBENEZER RD in CINCINNATI, OH)
(National Center for Education Statistics) - STATE ID-005967 Organizations: OAK HILLS LOCAL SD (SCHOOL DISTRICT)
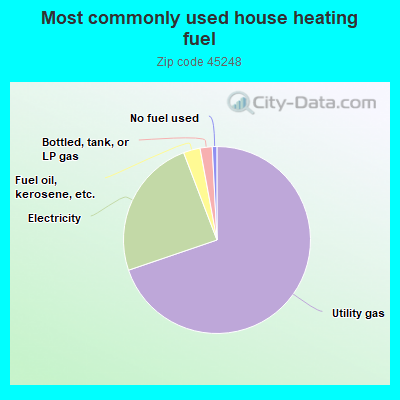
69.7%Utility gas
24.4%Electricity
2.9%Fuel oil, kerosene, etc.
2.1%Bottled, tank, or LP gas
0.8%No fuel used
Population in 1990: 20,735. Population change in the 1990s: +1,580 (+7.6%).
Place of birth for U.S.-born residents:
This state: 20,607
Northeast: 354
Midwest: 852
South: 1,606
West: 155
68% of the 45248 zip code residents lived in the same house 5 years ago. Out of people who lived in different houses, 87% lived in this county. Out of people who lived in different counties, 50% lived in Ohio.
92% of the 45248 zip code residents lived in the same house 1 year ago. Out of people who lived in different houses, 72% moved from this county. Out of people who lived in different houses, 12% moved from different county within same state. Out of people who lived in different houses, 14% moved from different state.
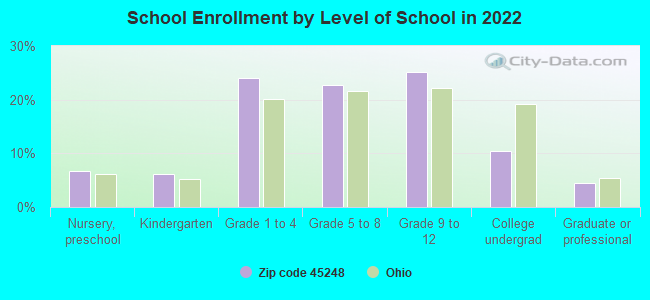
Private vs. public school enrollment:
Students in private schools in grades 1 to 8 (elementary and middle school): 644
Here:
24.2%
Ohio:
16.0%
Students in private schools in grades 9 to 12 (high school): 275
Here:
19.3%
Ohio:
13.1%
Students in private undergraduate colleges: 175
Here:
29.8%
Ohio:
22.3%
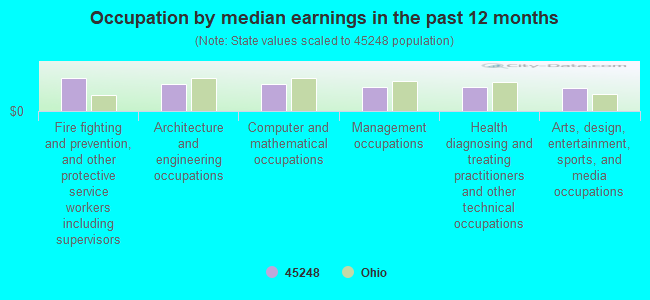
Occupation by median earnings in the past 12 months ($)
111,356Fire fighting and prevention, and other protective service workers including supervisors
91,299Architecture and engineering occupations
89,000Computer and mathematical occupations
80,994Management occupations
80,331Health diagnosing and treating practitioners and other technical occupations
77,692Arts, design, entertainment, sports, and media occupations
Companies with federal contracts located in this zip code:
HOME CITY ICE COMPANY, INC (5709 HARRISON AVE in CINCINNATI, OH) : $23,334 in 6 contractsfrom 2004 to 2005
Contracts for Food Items For Resale, Non-Food Items For Resale by Defense Commissary Agency Signed by year:2000: $0; 2001: $0; 2002: $0; 2003: $0; 2004: $2,683; 2005: $20,651; 2006: $0.
Biggest contracts:
$11,915 with Defense Commissary Agency for Food Items For Resale. Signed on 2005-09-01. Completion date: 2005-09-30.
$5,992, same as above.Signed on 2005-04-01. Completion date: 2005-08-31.
$1,984 with Defense Commissary Agency for Non-Food Items For Resale. Signed on 2005-10-01. Completion date: 2005-12-31.
$1,784 with Defense Commissary Agency for Food Items For Resale. Signed on 2004-10-01. Completion date: 2005-02-28.
JONES, PAUL E (5414 JAMIES OAK COURT in CINCINNATI, OH; small business)
$2,501 with Air Force for Lectures For Training. Signed on 2005-03-25. Completion date: 2005-04-29.
WOOD GROUNDSKEEPING (4531 SCHINKAL RD in CINCINNATI, OH; small business) : $0 in 2 contractsin 2003
$29,874 with U.S. Army Corps of Engineers - civil program financing only for Landscaping/Groundskeeping Services. Signed on 2003-02-26. Completion date: 2003-12-31.
-$29,874, same as above.Signed on 2003-03-11. Completion date: 2003-12-31.
Top industries in this zip code by the number of employees in 2005:
2002 - 2018 National Fire Incident Reporting System (NFIRS) incidents
According to the data from the years 2002 - 2018 the average number of fire incidents per year is 49. The highest number of fires - 79 took place in 2006, and the least - 25 in 2013. The data has a growing trend.
When looking into fire subcategories, the most incidents belonged to: Structure Fires (52.2%), and Outside Fires (37.1%).
Fire incident types reported to NFIRS in Zip Code 45248


 Nearest zip codes: 45233, 45247, 45001, 45041, 45211, 45051.
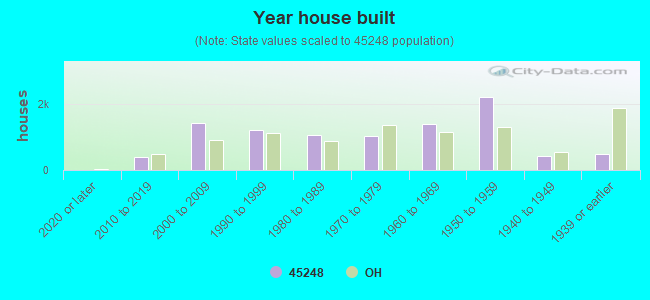


 According to the data from the years 2002 - 2018 the average number of fire incidents per year is 49. The highest number of fires - 79 took place in 2006, and the least - 25 in 2013. The data has a growing trend.
 When looking into fire subcategories, the most incidents belonged to: Structure Fires (52.2%), and Outside Fires (37.1%).