Estimated zip code population in 2022: 37,243 Zip code population in 2010: 36,111 Zip code population in 2000: 38,441
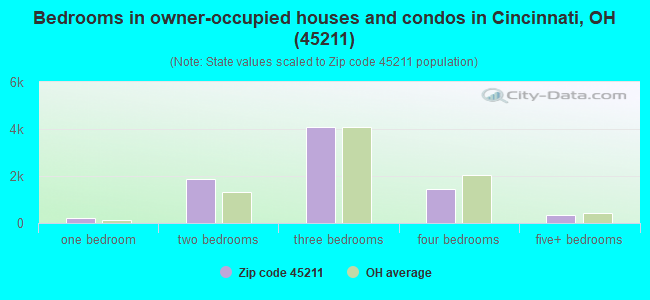
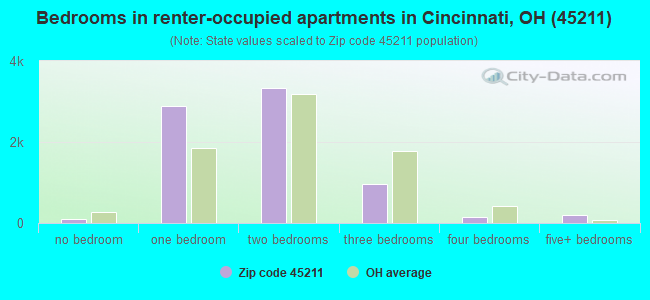
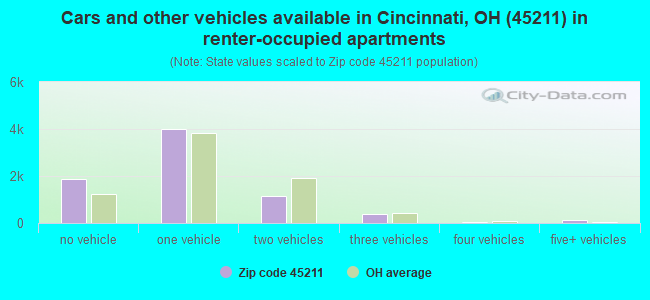
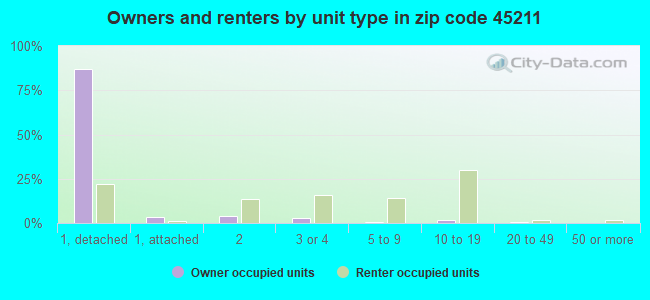
Houses and condos: 17,256 Renter-occupied apartments: 7,561
% of renters here:
49%
State:
33%
March 2022 cost of living index in zip code 45211: 87.6 (less than average, U.S. average is 100)
Land area: 9.0 sq. mi. Water area: 0.0 sq. mi.
Population density: 4,118 people per square mile
(average).
OSM Map
General Map
Google Map
MSN Map
OSM Map
General Map
Google Map
MSN Map
OSM Map
General Map
Google Map
MSN Map
OSM Map
General Map
Google Map
MSN Map
Please wait while loading the map...
Real estate property taxes paid for housing units in 2022:
This zip code:
1.5% ($2,286)
Ohio:
1.3% ($2,639)
Median real estate property taxes paid for housing units with mortgages in 2022: $2,370 (1.5%) Median real estate property taxes paid for housing units with no mortgage in 2022: $2,095 (1.6%)
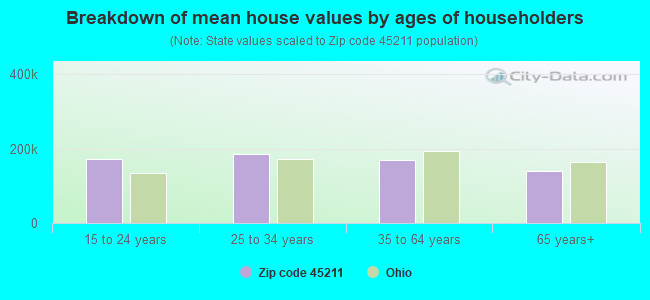
Estimated median house/condo value in 2022: $153,771
45211:
$153,771
Ohio:
$204,100
According to our research of Ohio and other state lists, there were 63 registered sex offenders living in 45211 zip code as of April 26, 2024. The ratio of all residents to sex offenders in zip code 45211 is 614 to 1. The ratio of registered sex offenders to all residents in this zip code is near the state average.
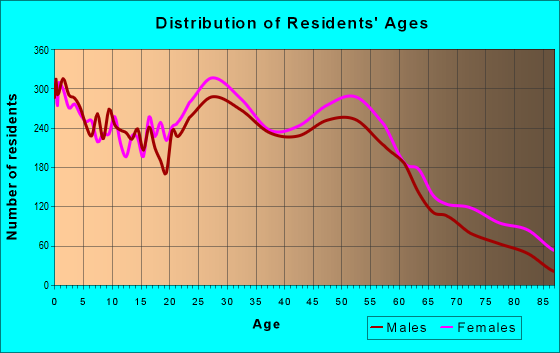
Median resident age:
This zip code:
34.0 years
Ohio median age:
39.9 years
Average household size:
This zip code:
2.3 people
Ohio:
2.4 people
Averages for the 2020 tax year for zip code 45211, filed in 2021:
Average Adjusted Gross Income (AGI) in 2020: $44,235 (Individual Income Tax Returns)
Here:
$44,235
State:
$67,288
Salary/wage: $39,477 (reported on 86.2% of returns)
Here:
$39,477
State:
$55,628
(% of AGI for various income ranges: 1158.0% for AGIs below $25k, 3723.5% for AGIs $25k-50k, 6698.8% for AGIs $50k-75k, 9939.8% for AGIs $75k-100k, 17364.1% for AGIs $100k-200k, 65754.0% for AGIs over 200k)
Taxable interest for individuals: $988 (reported on 16.8% of returns)
This zip code:
$988
Ohio:
$1,518
(% of AGI for various income ranges: 6.6% for AGIs below $25k, 7.1% for AGIs $25k-50k, 24.6% for AGIs $50k-75k, 43.1% for AGIs $75k-100k, 109.6% for AGIs $100k-200k, 1376.0% for AGIs over 200k)
Ordinary dividends: $4,721 (reported on 13.7% of returns)
Here:
$4,721
State:
$7,167
(% of AGI for various income ranges: 12.5% for AGIs below $25k, 24.2% for AGIs $25k-50k, 87.3% for AGIs $50k-75k, 210.6% for AGIs $75k-100k, 485.8% for AGIs $100k-200k, 5816.0% for AGIs over 200k)
Net capital gain/loss in AGI: +$7,080 (reported on 9.6% of returns)
Here:
+$7,080
State:
+$18,919
(% of AGI for various income ranges: 5.6% for AGIs below $25k, 12.3% for AGIs $25k-50k, 69.0% for AGIs $50k-75k, 133.7% for AGIs $75k-100k, 486.8% for AGIs $100k-200k, 11122.0% for AGIs over 200k)
Profit/loss from business: +$9,079 (reported on 13.2% of returns)
Here:
+$9,079
State:
+$13,744
(% of AGI for various income ranges: 107.4% for AGIs below $25k, 85.5% for AGIs $25k-50k, 154.8% for AGIs $50k-75k, 346.8% for AGIs $75k-100k, 700.4% for AGIs $100k-200k, 1718.0% for AGIs over 200k)
Taxable individual retirement arrangement distribution: $15,848 (reported on 5.9% of returns)
45211:
$15,848
Ohio:
$18,876
(% of AGI for various income ranges: 33.7% for AGIs below $25k, 56.9% for AGIs $25k-50k, 150.4% for AGIs $50k-75k, 292.3% for AGIs $75k-100k, 724.4% for AGIs $100k-200k, 3760.0% for AGIs over 200k)
Self-employed (Keogh) retirement plans: $11,825 (reported on 0.2% of returns)
45211:
$11,825
Ohio:
$24,898
(% of AGI for various income ranges: 64.8% for AGIs $100k-200k)
Total itemized deductions: $26,370 (reported on 2.5% of returns)
Here:
$26,370
State:
$33,869
(% of AGI for various income ranges: 15.7% for AGIs below $25k, 38.2% for AGIs $25k-50k, 136.9% for AGIs $50k-75k, 189.3% for AGIs $75k-100k, 433.7% for AGIs $100k-200k, 4090.0% for AGIs over 200k)
Charity contributions: $10,142 (reported on 1.9% of returns)
Here:
$10,142
State:
$14,577
(% of AGI for various income ranges: 1.2% for AGIs below $25k, 6.8% for AGIs $25k-50k, 21.0% for AGIs $50k-75k, 54.1% for AGIs $75k-100k, 174.2% for AGIs $100k-200k, 2152.0% for AGIs over 200k)
Taxes paid: $6,170 (reported on 2.5% of returns)
45211:
$6,170
State:
$7,681
(% of AGI for various income ranges: 1.4% for AGIs below $25k, 5.9% for AGIs $25k-50k, 28.3% for AGIs $50k-75k, 59.4% for AGIs $75k-100k, 135.5% for AGIs $100k-200k, 778.0% for AGIs over 200k)
Earned income credit: $2,459 (reported on 24.7% of returns)
Here:
$2,459
State:
$2,304
(% of AGI for various income ranges: 137.6% for AGIs below $25k, 75.3% for AGIs $25k-50k, 0.7% for AGIs $50k-75k)
Percentage of individuals using paid preparers for their 2020 taxes: 93.1%
Here:
93%
State:
94%
(% for various income ranges: 92.7% for AGIs below $25k, 94.2% for AGIs $25k-50k, 93.2% for AGIs $50k-75k, 92.4% for AGIs $75k-100k, 90.1% for AGIs $100k-200k, 94.4% for AGIs over 200k)
Averages for the 2012 tax year for zip code 45211, filed in 2013:
Average Adjusted Gross Income (AGI) in 2012: $38,386 (Individual Income Tax Returns)
Here:
$38,386
State:
$54,926
Salary/wage: $35,082 (reported on 86.6% of returns)
Here:
$35,082
State:
$45,869
(% of AGI for various income ranges: 79.2% for AGIs below $25k, 84.9% for AGIs $25k-50k, 78.8% for AGIs $50k-75k, 79.9% for AGIs $75k-100k, 76.7% for AGIs $100k-200k, 51.9% for AGIs over 200k)
Taxable interest for individuals: $889 (reported on 22.4% of returns)
This zip code:
$889
Ohio:
$1,297
(% of AGI for various income ranges: 0.5% for AGIs below $25k, 0.4% for AGIs $25k-50k, 0.5% for AGIs $50k-75k, 0.6% for AGIs $75k-100k, 0.6% for AGIs $100k-200k, 0.8% for AGIs over 200k)
Ordinary dividends: $3,856 (reported on 17.1% of returns)
Here:
$3,856
State:
$5,821
(% of AGI for various income ranges: 1.1% for AGIs below $25k, 0.9% for AGIs $25k-50k, 1.6% for AGIs $50k-75k, 1.6% for AGIs $75k-100k, 2.7% for AGIs $100k-200k, 5.8% for AGIs over 200k)
Net capital gain/loss in AGI: +$3,296 (reported on 9.7% of returns)
Here:
+$3,296
State:
+$11,232
(% of AGI for various income ranges: 0.1% for AGIs below $25k, 0.1% for AGIs $25k-50k, 0.4% for AGIs $50k-75k, 0.6% for AGIs $75k-100k, 1.5% for AGIs $100k-200k, 7.5% for AGIs over 200k)
Profit/loss from business: +$9,873 (reported on 12.6% of returns)
Here:
+$9,873
State:
+$12,773
(% of AGI for various income ranges: 7.9% for AGIs below $25k, 1.9% for AGIs $25k-50k, 2.2% for AGIs $50k-75k, 2.1% for AGIs $75k-100k, 2.9% for AGIs $100k-200k, 5.8% for AGIs over 200k)
Taxable individual retirement arrangement distribution: $12,442 (reported on 8.2% of returns)
45211:
$12,442
Ohio:
$14,511
(% of AGI for various income ranges: 2.4% for AGIs below $25k, 2.0% for AGIs $25k-50k, 2.3% for AGIs $50k-75k, 2.5% for AGIs $75k-100k, 4.2% for AGIs $100k-200k, 3.8% for AGIs over 200k)
Self-employment retirement plans: $12,850 (reported on 0.2% of returns)
45211:
$12,850
Ohio:
$20,257
(% of AGI for various income ranges: 0.4% for AGIs $100k-200k)
Total itemized deductions: $15,168 (21% of AGI, reported on 23.6% of returns)
Here:
$15,168
State:
$21,278
Here:
20.8% of AGI
State:
18.8% of AGI
(% of AGI for various income ranges: 4.3% for AGIs below $25k, 6.8% for AGIs $25k-50k, 10.8% for AGIs $50k-75k, 11.5% for AGIs $75k-100k, 12.6% for AGIs $100k-200k, 14.4% for AGIs over 200k)
Charity contributions: $2,735 (reported on 17.7% of returns)
Here:
$2,735
State:
$3,943
(% of AGI for various income ranges: 0.3% for AGIs below $25k, 0.7% for AGIs $25k-50k, 1.4% for AGIs $50k-75k, 1.5% for AGIs $75k-100k, 1.8% for AGIs $100k-200k, 4.3% for AGIs over 200k)
Taxes paid: $5,893 (reported on 23.5% of returns)
45211:
$5,893
State:
$9,568
(% of AGI for various income ranges: 0.8% for AGIs below $25k, 2.2% for AGIs $25k-50k, 4.0% for AGIs $50k-75k, 4.5% for AGIs $75k-100k, 6.0% for AGIs $100k-200k, 6.8% for AGIs over 200k)
Earned income credit: $2,488 (reported on 26.0% of returns)
Here:
$2,488
State:
$2,285
(% of AGI for various income ranges: 9.3% for AGIs below $25k, 1.0% for AGIs $25k-50k)
Percentage of individuals using paid preparers for their 2012 taxes: 42.1%
Here:
42%
State:
51%
(% for various income ranges: 38.8% for AGIs below $25k, 43.4% for AGIs $25k-50k, 45.5% for AGIs $50k-75k, 46.1% for AGIs $75k-100k, 47.9% for AGIs $100k-200k, 70.0% for AGIs over 200k)
Averages for the 2004 tax year for zip code 45211, filed in 2005:
Average Adjusted Gross Income (AGI) in 2004: $34,616 (Individual Income Tax Returns)
Here:
$34,616
State:
$44,480
Salary/wage: $32,399 (reported on 87.5% of returns)
Here:
$32,399
State:
$39,198
(% of AGI for various income ranges: 102.6% for AGIs below $10k, 81.9% for AGIs $10k-25k, 86.9% for AGIs $25k-50k, 82.7% for AGIs $50k-75k, 85.0% for AGIs $75k-100k, 64.0% for AGIs over 100k)
Taxable interest for individuals: $1,275 (reported on 35.3% of returns)
This zip code:
$1,275
Ohio:
$1,532
(% of AGI for various income ranges: 4.0% for AGIs below $10k, 1.7% for AGIs $10k-25k, 1.0% for AGIs $25k-50k, 1.3% for AGIs $50k-75k, 0.9% for AGIs $75k-100k, 1.4% for AGIs over 100k)
Taxable dividends: $2,849 (reported on 22.8% of returns)
Here:
$2,849
State:
$3,496
(% of AGI for various income ranges: 3.0% for AGIs below $10k, 1.6% for AGIs $10k-25k, 0.9% for AGIs $25k-50k, 1.7% for AGIs $50k-75k, 1.4% for AGIs $75k-100k, 4.6% for AGIs over 100k)
Net capital gain/loss: +$3,158 (reported on 14.4% of returns)
Here:
+$3,158
State:
+$8,582
(% of AGI for various income ranges: -0.7% for AGIs below $10k, 0.3% for AGIs $10k-25k, 0.4% for AGIs $25k-50k, 1.1% for AGIs $50k-75k, 1.6% for AGIs $75k-100k, 4.5% for AGIs over 100k)
Profit/loss from business: +$8,258 (reported on 10.7% of returns)
Here:
+$8,258
State:
+$10,813
(% of AGI for various income ranges: 2.1% for AGIs below $10k, 3.9% for AGIs $10k-25k, 1.8% for AGIs $25k-50k, 2.3% for AGIs $50k-75k, 2.0% for AGIs $75k-100k, 3.9% for AGIs over 100k)
IRA payment deduction: $2,561 (reported on 2.1% of returns)
45211:
$2,561
Ohio:
$2,794
(% of AGI for various income ranges: 0.2% for AGIs $10k-25k, 0.2% for AGIs $25k-50k, 0.2% for AGIs $50k-75k, 0.1% for AGIs $75k-100k, 0.1% for AGIs over 100k)
Self-employed pension: $8,895 (reported on 0.4% of returns)
Here:
$8,895
Ohio:
$13,981
(% of AGI for various income ranges: 0.0% for AGIs $25k-50k, 0.1% for AGIs $50k-75k, 0.2% for AGIs $75k-100k, 0.4% for AGIs over 100k)
Total itemized deductions: $13,756 (22% of AGI, reported on 30.9% of returns)
Here:
$13,756
State:
$17,503
Here:
22.5% of AGI
State:
20.8% of AGI
(% of AGI for various income ranges: 7.8% for AGIs below $10k, 5.5% for AGIs $10k-25k, 10.9% for AGIs $25k-50k, 14.5% for AGIs $50k-75k, 15.7% for AGIs $75k-100k, 15.7% for AGIs over 100k)
Charity contributions deductions: $2,311 (4% of AGI, reported on 25.9% of returns)
Here:
$2,311
State:
$3,087
Here:
3.6% of AGI
State:
3.4% of AGI
(% of AGI for various income ranges: 0.5% for AGIs below $10k, 0.6% for AGIs $10k-25k, 1.2% for AGIs $25k-50k, 1.8% for AGIs $50k-75k, 2.0% for AGIs $75k-100k, 3.5% for AGIs over 100k)
Total tax: $4,279 (reported on 73.1% of returns)
45211:
$4,279
State:
$6,781
(% of AGI for various income ranges: 2.3% for AGIs below $10k, 4.0% for AGIs $10k-25k, 7.4% for AGIs $25k-50k, 9.5% for AGIs $50k-75k, 10.3% for AGIs $75k-100k, 16.2% for AGIs over 100k)
Earned income credit: $1,844 (reported on 19.8% of returns)
Here:
$1,844
State:
$1,696
Percentage of individuals using paid preparers for their 2004 taxes: 50.9%
Here:
51%
State:
55%
(% for various income ranges: 46.4% for AGIs below $10k, 56.2% for AGIs $10k-25k, 50.5% for AGIs $25k-50k, 49.0% for AGIs $50k-75k, 45.9% for AGIs $75k-100k, 50.6% for AGIs over 100k)
Likely homosexual households (counted as self-reported same-sex unmarried-partner households)
Lesbian couples: 0.3% of all households
Gay men: 0.4% of all households
Household received Food Stamps/SNAP in the past 12 months: 3,357 Household did not receive Food Stamps/SNAP in the past 12 months: 12,273
Women who had a birth in the past 12 months: 914 (433 now married, 472 unmarried) Women who did not have a birth in the past 12 months: 8,449 (2,426 now married, 6,026 unmarried)
Housing units in zip code 45211 with a mortgage: 5,605 (401 second mortgage, 255 both second mortgage and home equity loan) Houses without a mortgage: 164
Median monthly owner costs for units with a mortgage: $1,220 Median monthly owner costs for units without a mortgage: $546
Residents with income below the poverty level in 2022:
This zip code:
17.7%
Whole state:
13.4%
Residents with income below 50% of the poverty level in 2022:
This zip code:
9.8%
Whole state:
7.0%
Median number of rooms in houses and condos:
Here:
6.4
State:
6.7
Median number of rooms in apartments:
Here:
4.1
State:
4.4
Notable locations in this zip code not listed on our city pages
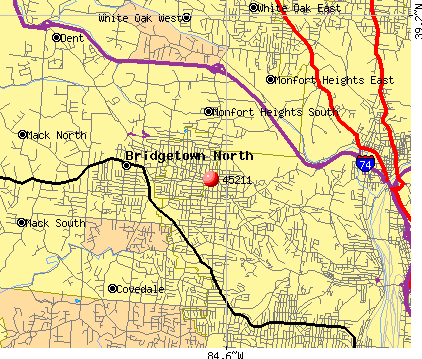
Notable locations in zip code 45211: Cheviot City Hall (A), Cincinnati Fire Department Engine and Truck 35 (B), Number 35 Engine House (C), Cheviot Memorial Fieldhouse (D), Cheviot Police Department (E), Cheviot Fire Department (F), Cheviot Branch Public Library of Cincinnati and Hamilton County (G). Display/hide their locations on the map
Churches in zip code 45211 include: Westwood First Presbyterian Church (A), Saint James Episcopal Church (B), Westwood Baptist Church (C), Westwood Salem United Presbyterian Church (D), Montana Avenue Church of the Nazarene (E), Grace Lutheran Church (F), Cheviot Church of God (G), Westwood-Cheviot Church of Christ (H), Cornerstone Fellowship Church (I). Display/hide their locations on the map
Cemeteries: Baltimore Pike Cemetery (1), Westwood Baptist Cemetery (2), Green Township Cemetery (3), Bethel Baptist Cemetery (4), Bridgetown Protestant Cemetery (5). Display/hide their locations on the map
Parks in zip code 45211 include: Cheviot Municipal Swimming Pool (1), Westwood Town Center Historic District (2), Harvest Home Park (3), Westwood Common (4), Bracken Woods Park (5). Display/hide their locations on the map
Tourist attraction (not listed on the city page) : General Cluster's Golf & Gulp (Amusement & Theme Parks; 3325 Westbrn Drive).
3,628 married couples with children.
4,862 single-parent households (947 men, 3,915 women).
91.3% of residents of 45211 zip code speak English at home.
3.4% of residents speak Spanish at home (34% very well, 50% well, 16% not well).
2.5% of residents speak other Indo-European language at home (66% very well, 28% well, 6% not well).
0.6% of residents speak Asian or Pacific Island language at home (57% very well, 29% well, 14% not well).
1.9% of residents speak other language at home (64% very well, 22% well, 1% not well, 13% not at all).
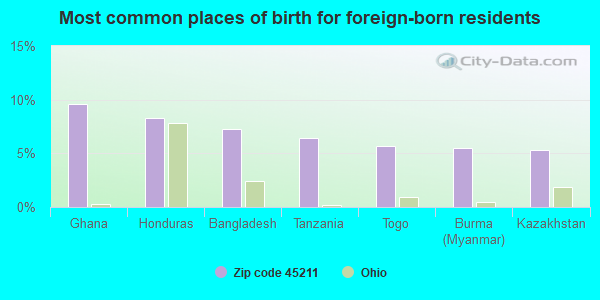
Foreign born population: 1,962 (5.3%) (50.4% of them are naturalized citizens)
This zip code:
5.3%
Whole state:
5.0%
10%Ghana
8%Honduras
7%Bangladesh
6%Tanzania
6%Togo
5%Burma (Myanmar)
5%Kazakhstan
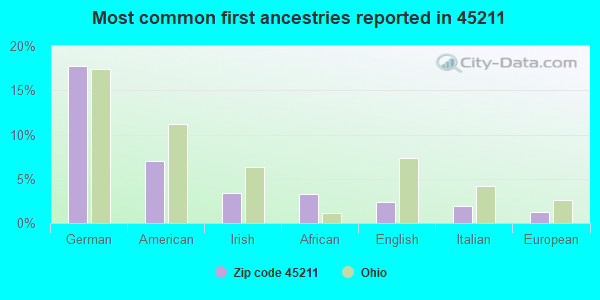
18%German
7%American
3%Irish
3%African
2%English
2%Italian
1%European
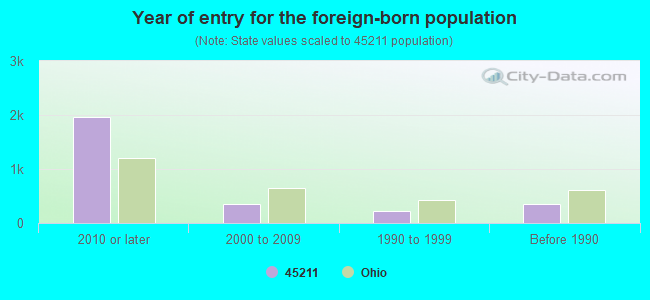
Year of entry for the foreign-born population
1,9662010 or later
3442000 to 2009
2261990 to 1999
347Before 1990
Facilities with environmental interests located in this zip code:
AIRY POINTE CONDO ASSOC WWTP (3507 W FORK RD UNIT NO 14 in CINCINNATI, OH)
STATE MASTER (Ohio general info) - PCS-OH0072184, National Pollutant Discharge Elimination System Permit National Pollutant Discharge Elimination System NON-MAJOR (Tracking pollutant discharge elimination systems) - permit Business SIC classification: SEWERAGE SYSTEMS Organizations: AIRY POINTE CONDOMINIUMS ASSOC (CONTACT/OWNER)
Alternative names: AIRY POINTE CONDOMINIUMS WWTP
BARR S AUTO BODY (3918 BOUDINOT AVE in CINCINNATI, OH)
STATE MASTER (Ohio general info) - AIR MAJOR Conditionally Exempt Small Quantity Generators, less than 100 kg/month of hazardous waste (Resource Conservation and Recovery Act (tracking hazardous waste)) - notification Organizations: BARR DON (CONTACT/OWNER)
Alternative names: BARR'S AUTO BODY, BARRS AUTO BODY AND PAINT SHOP INC
BIEDERMAN EDUCATIONAL CNTR (5195 N BEND RD in CINCINNATI, OH)
STATE MASTER (Ohio general info) - PCS-OH0112461, National Pollutant Discharge Elimination System Permit National Pollutant Discharge Elimination System NON-MAJOR (Tracking pollutant discharge elimination systems) - permit Business SIC classification: SEWERAGE SYSTEMS
BP OIL CO SITE 08982 (6289 GLENWAY in CINCINNATI, OH)
STATE MASTER (Ohio general info) - RCRA-OHD987027372, HAZARDOUS WASTE PROGRAM Conditionally Exempt Small Quantity Generators, less than 100 kg/month of hazardous waste (Resource Conservation and Recovery Act (tracking hazardous waste)) - notification Organizations: BP OIL COMPANY (CONTACT/OWNER)
BP OIL NO 08836 (3200 HARRISON AVE in CINCINNATI, OH)
STATE MASTER (Ohio general info) - AIR MAJOR, -31-5541-1038-2, EPCRA, RCRA-OHD987028768, HAZARDOUS WASTE PROGRAM Conditionally Exempt Small Quantity Generators, less than 100 kg/month of hazardous waste (Resource Conservation and Recovery Act (tracking hazardous waste)) - notification Organizations: BP OIL CO (CONTACT/OWNER)
, BP OIL COMPANY (CONTACT/OWNER)
Alternative names: BP OIL CO SITE 08836
BP OIL NO 09074 (2110 MONTANA AVE in CINCINNATI, OH)
STATE MASTER (Ohio general info) - AIR MAJOR, -315541-1038-FF, EPCRA, RCRA-OHD987028370, HAZARDOUS WASTE PROGRAM Conditionally Exempt Small Quantity Generators, less than 100 kg/month of hazardous waste (Resource Conservation and Recovery Act (tracking hazardous waste)) - notification Organizations: BP OIL CO (CONTACT/OWNER)
, BP OIL COMPANY (CONTACT/OWNER)
Alternative names: BP OIL CO SITE 09074
AT&T LONG LINES WHITE OAK (ON CHEVIOT RD 2MI N OF CHEVIOT in CHEVIOT, OH)
(Resource Conservation and Recovery Act (tracking hazardous waste)) Organizations: AMERICAN TELEPHONE AND TELEGRAPH (CONTACT/OWNER)
BP OIL CO SITE 8987 (3289 WERK RD in CINCINNATI, OH)
(Resource Conservation and Recovery Act (tracking hazardous waste)) Organizations: BP OIL COMPANY (CONTACT/OWNER)
BODY WORKS LTD (4293 HARRISON AVE in CINCINNATI, OH)
Small Quantity Generators, between 100 kg and 1000 kg of hazardous waste/month (Resource Conservation and Recovery Act (tracking hazardous waste)) - notification Organizations: BODYWORKS LTD INC (CONTACT/OWNER)
Housing units lacking complete plumbing facilities: 1.0% Housing units lacking complete kitchen facilities: 1.4%
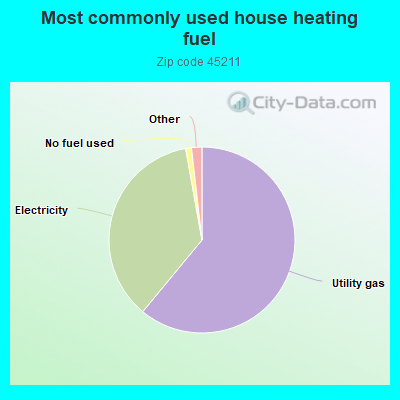
61.0%Utility gas
36.2%Electricity
1.0%No fuel used
1.0%Bottled, tank, or LP gas
0.6%Other fuel
Population in 1990: 44,072.
Place of birth for U.S.-born residents:
This state: 28,601
Northeast: 967
Midwest: 1,198
South: 3,215
West: 520
55% of the 45211 zip code residents lived in the same house 5 years ago. Out of people who lived in different houses, 84% lived in this county. Out of people who lived in different counties, 50% lived in Ohio.
86% of the 45211 zip code residents lived in the same house 1 year ago. Out of people who lived in different houses, 75% moved from this county. Out of people who lived in different houses, 9% moved from different county within same state. Out of people who lived in different houses, 8% moved from different state. Out of people who lived in different houses, 2% moved from abroad.
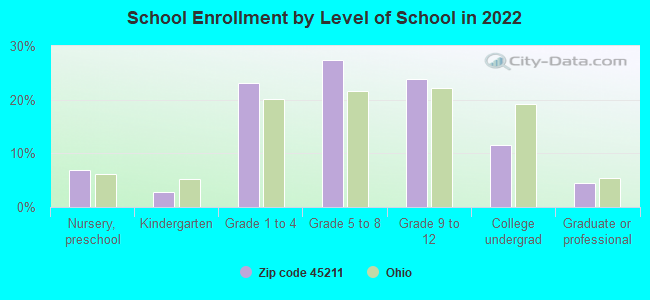
Private vs. public school enrollment:
Students in private schools in grades 1 to 8 (elementary and middle school): 1,622
Here:
34.0%
Ohio:
16.0%
Students in private schools in grades 9 to 12 (high school): 453
Here:
20.4%
Ohio:
13.1%
Students in private undergraduate colleges: 220
Here:
20.4%
Ohio:
22.3%
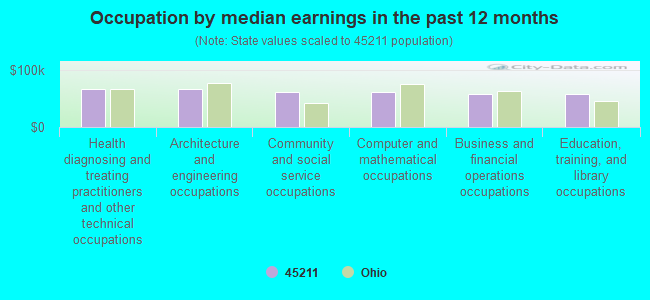
Occupation by median earnings in the past 12 months ($)
67,243Health diagnosing and treating practitioners and other technical occupations
66,332Architecture and engineering occupations
61,860Community and social service occupations
61,232Computer and mathematical occupations
58,745Business and financial operations occupations
57,907Education, training, and library occupations
Companies with federal contracts located in this zip code:
WATER QUALITY SYSTEMS, INC (2928 TIMBERVIEW DR in CINCINNATI, OH; small business) : $1,145,941 in 15 contractsfrom 2003 to 2006
Contracts for Facilities Operations Support Services, Water Quality Support Services by Air Force Signed by year:2000: $0; 2001: $0; 2002: $0; 2003: $399,366; 2004: $448,090; 2005: $204,895; 2006: $93,590.
Biggest contracts:
$237,366 with Air Force for Facilities Operations Support Services. Signed on 2003-02-26. Completion date: 2003-09-30.
$231,500, same as above.Signed on 2005-10-31. Completion date: 2006-09-30.
$227,871, same as above.Signed on 2004-12-14. Completion date: 2005-09-30.
$162,000, same as above.Signed on 2003-10-17. Completion date: 2004-09-30.
GEILER COMPANY (6561 GLENWAY AVE in CINCINNATI, OH; small business) : $15,511 in 3 contractsfrom 2005 to 2006
$11,600 with Army for Maintenance, Repair and Rebuilding of Equipment -- Plumbing, Heating, and Waste Disposal Equipment. Signed on 2005-06-14. Completion date: 2005-07-29.
$6,000, same as above.Signed on 2005-09-14. Completion date: 2005-09-24.
-$2,089, same as above.Signed on 2006-03-22. Completion date: 2005-09-24.
EQM RESEARCH, INC (2814 URWILER AVE in CINCINNATI, OH; small business)
$3,600 with Army for Laboratory Equipment and Supplies. Signed on 2002-07-18. Completion date: 2002-08-09.
Top industries in this zip code by the number of employees in 2005:
2002 - 2018 National Fire Incident Reporting System (NFIRS) incidents
According to the data from the years 2002 - 2018 the average number of fire incidents per year is 157. The highest number of reported fires - 228 took place in 2007, and the least - 56 in 2002. The data has a rising trend.
When looking into fire subcategories, the most reports belonged to: Structure Fires (47.3%), and Outside Fires (27.6%).
Fire incident types reported to NFIRS in Zip Code 45211
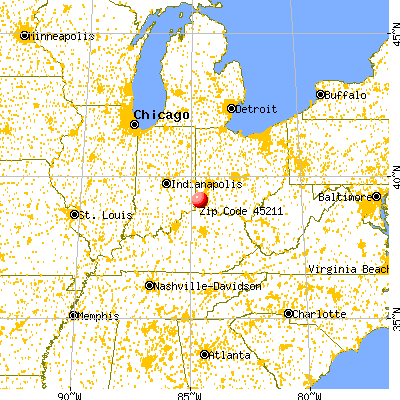


 Nearest zip codes: 45225, 45223, 45239, 45238, 45205, 45204.
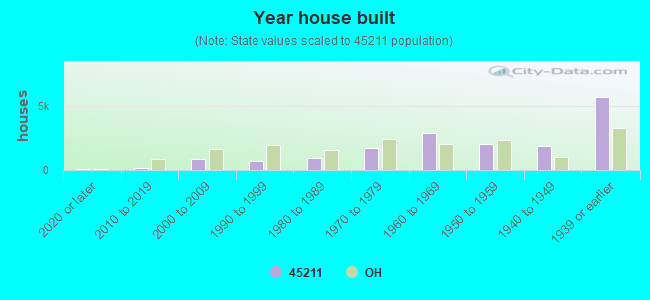


 According to the data from the years 2002 - 2018 the average number of fire incidents per year is 157. The highest number of reported fires - 228 took place in 2007, and the least - 56 in 2002. The data has a rising trend.
 When looking into fire subcategories, the most reports belonged to: Structure Fires (47.3%), and Outside Fires (27.6%).