Estimated zip code population in 2022: 19,056
Zip code population in 2010: 19,389
Zip code population in 2000: 23,143
Houses and condos: 8,239
Renter-occupied apartments: 4,210
% of renters here:
59%State:
33%
March 2022 cost of living index in zip code 45205: 87.3
(less than average, U.S. average is 100)
Land area: 2.9
sq. mi.
Water area: 0.0
sq. mi.
Population density: 6,572 people per square mile (high).
OSM Map
General Map
Google Map
MSN Map
OSM Map
General Map
Google Map
MSN Map
OSM Map
General Map
Google Map
MSN Map
OSM Map
General Map
Google Map
MSN Map
Please wait while loading the map...
Real estate property taxes paid for housing units in 2022:
This zip code:
1.7% ($1,726)Ohio:
1.3% ($2,639)
Median real estate property taxes paid for housing units with mortgages in 2022: $1,825 (1.8%)
Median real estate property taxes paid for housing units with no mortgage in 2022: $1,672 (1.7%)
Business Search - 14 Million verified businesses
Males: 9,266 Females: 9,789
For population 25 years and over in 45205:
High school or higher: 76.3%Bachelor's degree or higher: 16.3%Graduate or professional degree: 4.5%Unemployed: 7.6%Mean travel time to work (commute): 24.9 minutes
For population 15 years and over in 45205:
Never married: 50.7%Now married: 33.1%Separated: 1.9%Widowed: 3.6%Divorced: 10.8%
Zip code 45205 compared to state average:
Median household income below state average. Median house value below state average. Unemployed percentage above state average. Black race population percentage significantly above state average. Hispanic race population percentage significantly above state average. Median age below state average. Foreign-born population percentage significantly above state average. Renting percentage above state average. Length of stay since moving in significantly above state average. House age above state average. Percentage of population with a bachelor's degree or higher below state average. 7,226 37.9% Black 6,983 36.7% White 3,119 16.4% Hispanic or Latino 651 3.4% Some other race 591 3.1% Two or more races 473 2.5% Asian 10 0.05% American Indian
Data:
Median household income ($)
Median household income (% change since 2000)
Household income diversity
Ratio of average income to average house value (%)
Ratio of average income to average rent
Median household income ($) - White
Median household income ($) - Black or African American
Median household income ($) - Asian
Median household income ($) - Hispanic or Latino
Median household income ($) - American Indian and Alaska Native
Median household income ($) - Multirace
Median household income ($) - Other Race
Median household income for houses/condos with a mortgage ($)
Median household income for apartments without a mortgage ($)
Races - White alone (%)
Races - White alone (% change since 2000)
Races - Black alone (%)
Races - Black alone (% change since 2000)
Races - American Indian alone (%)
Races - American Indian alone (% change since 2000)
Races - Asian alone (%)
Races - Asian alone (% change since 2000)
Races - Hispanic (%)
Races - Hispanic (% change since 2000)
Races - Native Hawaiian and Other Pacific Islander alone (%)
Races - Native Hawaiian and Other Pacific Islander alone (% change since 2000)
Races - Two or more races (%)
Races - Two or more races (% change since 2000)
Races - Other race alone (%)
Races - Other race alone (% change since 2000)
Racial diversity
Unemployment (%)
Unemployment (% change since 2000)
Unemployment (%) - White
Unemployment (%) - Black or African American
Unemployment (%) - Asian
Unemployment (%) - Hispanic or Latino
Unemployment (%) - American Indian and Alaska Native
Unemployment (%) - Multirace
Unemployment (%) - Other Race
Population density (people per square mile)
Population - Males (%)
Population - Females (%)
Population - Males (%) - White
Population - Males (%) - Black or African American
Population - Males (%) - Asian
Population - Males (%) - Hispanic or Latino
Population - Males (%) - American Indian and Alaska Native
Population - Males (%) - Multirace
Population - Males (%) - Other Race
Population - Females (%) - White
Population - Females (%) - Black or African American
Population - Females (%) - Asian
Population - Females (%) - Hispanic or Latino
Population - Females (%) - American Indian and Alaska Native
Population - Females (%) - Multirace
Population - Females (%) - Other Race
Coronavirus confirmed cases (Apr 27, 2024)
Deaths caused by coronavirus (Apr 27, 2024)
Coronavirus confirmed cases (per 100k population) (Apr 27, 2024)
Deaths caused by coronavirus (per 100k population) (Apr 27, 2024)
Daily increase in number of cases (Apr 27, 2024)
Weekly increase in number of cases (Apr 27, 2024)
Cases doubled (in days) (Apr 27, 2024)
Hospitalized patients (Apr 18, 2022)
Negative test results (Apr 18, 2022)
Total test results (Apr 18, 2022)
COVID Vaccine doses distributed (per 100k population) (Sep 19, 2023)
COVID Vaccine doses administered (per 100k population) (Sep 19, 2023)
COVID Vaccine doses distributed (Sep 19, 2023)
COVID Vaccine doses administered (Sep 19, 2023)
Likely homosexual households (%)
Likely homosexual households (% change since 2000)
Likely homosexual households - Lesbian couples (%)
Likely homosexual households - Lesbian couples (% change since 2000)
Likely homosexual households - Gay men (%)
Likely homosexual households - Gay men (% change since 2000)
Cost of living index
Median gross rent ($)
Median contract rent ($)
Median monthly housing costs ($)
Median house or condo value ($)
Median house or condo value ($ change since 2000)
Mean house or condo value by units in structure - 1, detached ($)
Mean house or condo value by units in structure - 1, attached ($)
Mean house or condo value by units in structure - 2 ($)
Mean house or condo value by units in structure by units in structure - 3 or 4 ($)
Mean house or condo value by units in structure - 5 or more ($)
Mean house or condo value by units in structure - Boat, RV, van, etc. ($)
Mean house or condo value by units in structure - Mobile home ($)
Median house or condo value ($) - White
Median house or condo value ($) - Black or African American
Median house or condo value ($) - Asian
Median house or condo value ($) - Hispanic or Latino
Median house or condo value ($) - American Indian and Alaska Native
Median house or condo value ($) - Multirace
Median house or condo value ($) - Other Race
Median resident age
Resident age diversity
Median resident age - Males
Median resident age - Females
Median resident age - White
Median resident age - Black or African American
Median resident age - Asian
Median resident age - Hispanic or Latino
Median resident age - American Indian and Alaska Native
Median resident age - Multirace
Median resident age - Other Race
Median resident age - Males - White
Median resident age - Males - Black or African American
Median resident age - Males - Asian
Median resident age - Males - Hispanic or Latino
Median resident age - Males - American Indian and Alaska Native
Median resident age - Males - Multirace
Median resident age - Males - Other Race
Median resident age - Females - White
Median resident age - Females - Black or African American
Median resident age - Females - Asian
Median resident age - Females - Hispanic or Latino
Median resident age - Females - American Indian and Alaska Native
Median resident age - Females - Multirace
Median resident age - Females - Other Race
Commute - mean travel time to work (minutes)
Travel time to work - Less than 5 minutes (%)
Travel time to work - Less than 5 minutes (% change since 2000)
Travel time to work - 5 to 9 minutes (%)
Travel time to work - 5 to 9 minutes (% change since 2000)
Travel time to work - 10 to 19 minutes (%)
Travel time to work - 10 to 19 minutes (% change since 2000)
Travel time to work - 20 to 29 minutes (%)
Travel time to work - 20 to 29 minutes (% change since 2000)
Travel time to work - 30 to 39 minutes (%)
Travel time to work - 30 to 39 minutes (% change since 2000)
Travel time to work - 40 to 59 minutes (%)
Travel time to work - 40 to 59 minutes (% change since 2000)
Travel time to work - 60 to 89 minutes (%)
Travel time to work - 60 to 89 minutes (% change since 2000)
Travel time to work - 90 or more minutes (%)
Travel time to work - 90 or more minutes (% change since 2000)
Marital status - Never married (%)
Marital status - Now married (%)
Marital status - Separated (%)
Marital status - Widowed (%)
Marital status - Divorced (%)
Median family income ($)
Median family income (% change since 2000)
Median non-family income ($)
Median non-family income (% change since 2000)
Median per capita income ($)
Median per capita income (% change since 2000)
Median family income ($) - White
Median family income ($) - Black or African American
Median family income ($) - Asian
Median family income ($) - Hispanic or Latino
Median family income ($) - American Indian and Alaska Native
Median family income ($) - Multirace
Median family income ($) - Other Race
Median year house/condo built
Median year apartment built
Year house built - Built 2005 or later (%)
Year house built - Built 2000 to 2004 (%)
Year house built - Built 1990 to 1999 (%)
Year house built - Built 1980 to 1989 (%)
Year house built - Built 1970 to 1979 (%)
Year house built - Built 1960 to 1969 (%)
Year house built - Built 1950 to 1959 (%)
Year house built - Built 1940 to 1949 (%)
Year house built - Built 1939 or earlier (%)
Average household size
Household density (households per square mile)
Average household size - White
Average household size - Black or African American
Average household size - Asian
Average household size - Hispanic or Latino
Average household size - American Indian and Alaska Native
Average household size - Multirace
Average household size - Other Race
Occupied housing units (%)
Vacant housing units (%)
Owner occupied housing units (%)
Renter occupied housing units (%)
Vacancy status - For rent (%)
Vacancy status - For sale only (%)
Vacancy status - Rented or sold, not occupied (%)
Vacancy status - For seasonal, recreational, or occasional use (%)
Vacancy status - For migrant workers (%)
Vacancy status - Other vacant (%)
Residents with income below the poverty level (%)
Residents with income below 50% of the poverty level (%)
Children below poverty level (%)
Poor families by family type - Married-couple family (%)
Poor families by family type - Male, no wife present (%)
Poor families by family type - Female, no husband present (%)
Poverty status for native-born residents (%)
Poverty status for foreign-born residents (%)
Poverty among high school graduates not in families (%)
Poverty among people who did not graduate high school not in families (%)
Residents with income below the poverty level (%) - White
Residents with income below the poverty level (%) - Black or African American
Residents with income below the poverty level (%) - Asian
Residents with income below the poverty level (%) - Hispanic or Latino
Residents with income below the poverty level (%) - American Indian and Alaska Native
Residents with income below the poverty level (%) - Multirace
Residents with income below the poverty level (%) - Other Race
Air pollution - Air Quality Index (AQI)
Air pollution - CO
Air pollution - NO2
Air pollution - SO2
Air pollution - Ozone
Air pollution - PM10
Air pollution - PM25
Air pollution - Pb
Crime - Murders per 100,000 population
Crime - Rapes per 100,000 population
Crime - Robberies per 100,000 population
Crime - Assaults per 100,000 population
Crime - Burglaries per 100,000 population
Crime - Thefts per 100,000 population
Crime - Auto thefts per 100,000 population
Crime - Arson per 100,000 population
Crime - City-data.com crime index
Crime - Violent crime index
Crime - Property crime index
Crime - Murders per 100,000 population (5 year average)
Crime - Rapes per 100,000 population (5 year average)
Crime - Robberies per 100,000 population (5 year average)
Crime - Assaults per 100,000 population (5 year average)
Crime - Burglaries per 100,000 population (5 year average)
Crime - Thefts per 100,000 population (5 year average)
Crime - Auto thefts per 100,000 population (5 year average)
Crime - Arson per 100,000 population (5 year average)
Crime - City-data.com crime index (5 year average)
Crime - Violent crime index (5 year average)
Crime - Property crime index (5 year average)
1996 Presidential Elections Results (%) - Democratic Party (Clinton)
1996 Presidential Elections Results (%) - Republican Party (Dole)
1996 Presidential Elections Results (%) - Other
2000 Presidential Elections Results (%) - Democratic Party (Gore)
2000 Presidential Elections Results (%) - Republican Party (Bush)
2000 Presidential Elections Results (%) - Other
2004 Presidential Elections Results (%) - Democratic Party (Kerry)
2004 Presidential Elections Results (%) - Republican Party (Bush)
2004 Presidential Elections Results (%) - Other
2008 Presidential Elections Results (%) - Democratic Party (Obama)
2008 Presidential Elections Results (%) - Republican Party (McCain)
2008 Presidential Elections Results (%) - Other
2012 Presidential Elections Results (%) - Democratic Party (Obama)
2012 Presidential Elections Results (%) - Republican Party (Romney)
2012 Presidential Elections Results (%) - Other
2016 Presidential Elections Results (%) - Democratic Party (Clinton)
2016 Presidential Elections Results (%) - Republican Party (Trump)
2016 Presidential Elections Results (%) - Other
2020 Presidential Elections Results (%) - Democratic Party (Biden)
2020 Presidential Elections Results (%) - Republican Party (Trump)
2020 Presidential Elections Results (%) - Other
Ancestries Reported - Arab (%)
Ancestries Reported - Czech (%)
Ancestries Reported - Danish (%)
Ancestries Reported - Dutch (%)
Ancestries Reported - English (%)
Ancestries Reported - French (%)
Ancestries Reported - French Canadian (%)
Ancestries Reported - German (%)
Ancestries Reported - Greek (%)
Ancestries Reported - Hungarian (%)
Ancestries Reported - Irish (%)
Ancestries Reported - Italian (%)
Ancestries Reported - Lithuanian (%)
Ancestries Reported - Norwegian (%)
Ancestries Reported - Polish (%)
Ancestries Reported - Portuguese (%)
Ancestries Reported - Russian (%)
Ancestries Reported - Scotch-Irish (%)
Ancestries Reported - Scottish (%)
Ancestries Reported - Slovak (%)
Ancestries Reported - Subsaharan African (%)
Ancestries Reported - Swedish (%)
Ancestries Reported - Swiss (%)
Ancestries Reported - Ukrainian (%)
Ancestries Reported - United States (%)
Ancestries Reported - Welsh (%)
Ancestries Reported - West Indian (%)
Ancestries Reported - Other (%)
Educational Attainment - No schooling completed (%)
Educational Attainment - Less than high school (%)
Educational Attainment - High school or equivalent (%)
Educational Attainment - Less than 1 year of college (%)
Educational Attainment - 1 or more years of college (%)
Educational Attainment - Associate degree (%)
Educational Attainment - Bachelor's degree (%)
Educational Attainment - Master's degree (%)
Educational Attainment - Professional school degree (%)
Educational Attainment - Doctorate degree (%)
School Enrollment - Nursery, preschool (%)
School Enrollment - Kindergarten (%)
School Enrollment - Grade 1 to 4 (%)
School Enrollment - Grade 5 to 8 (%)
School Enrollment - Grade 9 to 12 (%)
School Enrollment - College undergrad (%)
School Enrollment - Graduate or professional (%)
School Enrollment - Not enrolled in school (%)
School enrollment - Public schools (%)
School enrollment - Private schools (%)
School enrollment - Not enrolled (%)
Median number of rooms in houses and condos
Median number of rooms in apartments
Housing units lacking complete plumbing facilities (%)
Housing units lacking complete kitchen facilities (%)
Density of houses
Urban houses (%)
Rural houses (%)
Households with people 60 years and over (%)
Households with people 65 years and over (%)
Households with people 75 years and over (%)
Households with one or more nonrelatives (%)
Households with no nonrelatives (%)
Population in households (%)
Family households (%)
Nonfamily households (%)
Population in families (%)
Family households with own children (%)
Median number of bedrooms in owner occupied houses
Mean number of bedrooms in owner occupied houses
Median number of bedrooms in renter occupied houses
Mean number of bedrooms in renter occupied houses
Median number of vehichles in owner occupied houses
Mean number of vehichles in owner occupied houses
Median number of vehichles in renter occupied houses
Mean number of vehichles in renter occupied houses
Mortgage status - with mortgage (%)
Mortgage status - with second mortgage (%)
Mortgage status - with home equity loan (%)
Mortgage status - with both second mortgage and home equity loan (%)
Mortgage status - without a mortgage (%)
Average family size
Average family size - White
Average family size - Black or African American
Average family size - Asian
Average family size - Hispanic or Latino
Average family size - American Indian and Alaska Native
Average family size - Multirace
Average family size - Other Race
Geographical mobility - Same house 1 year ago (%)
Geographical mobility - Moved within same county (%)
Geographical mobility - Moved from different county within same state (%)
Geographical mobility - Moved from different state (%)
Geographical mobility - Moved from abroad (%)
Place of birth - Born in state of residence (%)
Place of birth - Born in other state (%)
Place of birth - Native, outside of US (%)
Place of birth - Foreign born (%)
Housing units in structures - 1, detached (%)
Housing units in structures - 1, attached (%)
Housing units in structures - 2 (%)
Housing units in structures - 3 or 4 (%)
Housing units in structures - 5 to 9 (%)
Housing units in structures - 10 to 19 (%)
Housing units in structures - 20 to 49 (%)
Housing units in structures - 50 or more (%)
Housing units in structures - Mobile home (%)
Housing units in structures - Boat, RV, van, etc. (%)
House/condo owner moved in on average (years ago)
Renter moved in on average (years ago)
Year householder moved into unit - Moved in 1999 to March 2000 (%)
Year householder moved into unit - Moved in 1995 to 1998 (%)
Year householder moved into unit - Moved in 1990 to 1994 (%)
Year householder moved into unit - Moved in 1980 to 1989 (%)
Year householder moved into unit - Moved in 1970 to 1979 (%)
Year householder moved into unit - Moved in 1969 or earlier (%)
Means of transportation to work - Drove car alone (%)
Means of transportation to work - Carpooled (%)
Means of transportation to work - Public transportation (%)
Means of transportation to work - Bus or trolley bus (%)
Means of transportation to work - Streetcar or trolley car (%)
Means of transportation to work - Subway or elevated (%)
Means of transportation to work - Railroad (%)
Means of transportation to work - Ferryboat (%)
Means of transportation to work - Taxicab (%)
Means of transportation to work - Motorcycle (%)
Means of transportation to work - Bicycle (%)
Means of transportation to work - Walked (%)
Means of transportation to work - Other means (%)
Working at home (%)
Industry diversity
Most Common Industries - Agriculture, forestry, fishing and hunting, and mining (%)
Most Common Industries - Agriculture, forestry, fishing and hunting (%)
Most Common Industries - Mining, quarrying, and oil and gas extraction (%)
Most Common Industries - Construction (%)
Most Common Industries - Manufacturing (%)
Most Common Industries - Wholesale trade (%)
Most Common Industries - Retail trade (%)
Most Common Industries - Transportation and warehousing, and utilities (%)
Most Common Industries - Transportation and warehousing (%)
Most Common Industries - Utilities (%)
Most Common Industries - Information (%)
Most Common Industries - Finance and insurance, and real estate and rental and leasing (%)
Most Common Industries - Finance and insurance (%)
Most Common Industries - Real estate and rental and leasing (%)
Most Common Industries - Professional, scientific, and management, and administrative and waste management services (%)
Most Common Industries - Professional, scientific, and technical services (%)
Most Common Industries - Management of companies and enterprises (%)
Most Common Industries - Administrative and support and waste management services (%)
Most Common Industries - Educational services, and health care and social assistance (%)
Most Common Industries - Educational services (%)
Most Common Industries - Health care and social assistance (%)
Most Common Industries - Arts, entertainment, and recreation, and accommodation and food services (%)
Most Common Industries - Arts, entertainment, and recreation (%)
Most Common Industries - Accommodation and food services (%)
Most Common Industries - Other services, except public administration (%)
Most Common Industries - Public administration (%)
Occupation diversity
Most Common Occupations - Management, business, science, and arts occupations (%)
Most Common Occupations - Management, business, and financial occupations (%)
Most Common Occupations - Management occupations (%)
Most Common Occupations - Business and financial operations occupations (%)
Most Common Occupations - Computer, engineering, and science occupations (%)
Most Common Occupations - Computer and mathematical occupations (%)
Most Common Occupations - Architecture and engineering occupations (%)
Most Common Occupations - Life, physical, and social science occupations (%)
Most Common Occupations - Education, legal, community service, arts, and media occupations (%)
Most Common Occupations - Community and social service occupations (%)
Most Common Occupations - Legal occupations (%)
Most Common Occupations - Education, training, and library occupations (%)
Most Common Occupations - Arts, design, entertainment, sports, and media occupations (%)
Most Common Occupations - Healthcare practitioners and technical occupations (%)
Most Common Occupations - Health diagnosing and treating practitioners and other technical occupations (%)
Most Common Occupations - Health technologists and technicians (%)
Most Common Occupations - Service occupations (%)
Most Common Occupations - Healthcare support occupations (%)
Most Common Occupations - Protective service occupations (%)
Most Common Occupations - Fire fighting and prevention, and other protective service workers including supervisors (%)
Most Common Occupations - Law enforcement workers including supervisors (%)
Most Common Occupations - Food preparation and serving related occupations (%)
Most Common Occupations - Building and grounds cleaning and maintenance occupations (%)
Most Common Occupations - Personal care and service occupations (%)
Most Common Occupations - Sales and office occupations (%)
Most Common Occupations - Sales and related occupations (%)
Most Common Occupations - Office and administrative support occupations (%)
Most Common Occupations - Natural resources, construction, and maintenance occupations (%)
Most Common Occupations - Farming, fishing, and forestry occupations (%)
Most Common Occupations - Construction and extraction occupations (%)
Most Common Occupations - Installation, maintenance, and repair occupations (%)
Most Common Occupations - Production, transportation, and material moving occupations (%)
Most Common Occupations - Production occupations (%)
Most Common Occupations - Transportation occupations (%)
Most Common Occupations - Material moving occupations (%)
People in Group quarters - Institutionalized population (%)
People in Group quarters - Correctional institutions (%)
People in Group quarters - Federal prisons and detention centers (%)
People in Group quarters - Halfway houses (%)
People in Group quarters - Local jails and other confinement facilities (including police lockups) (%)
People in Group quarters - Military disciplinary barracks (%)
People in Group quarters - State prisons (%)
People in Group quarters - Other types of correctional institutions (%)
People in Group quarters - Nursing homes (%)
People in Group quarters - Hospitals/wards, hospices, and schools for the handicapped (%)
People in Group quarters - Hospitals/wards and hospices for chronically ill (%)
People in Group quarters - Hospices or homes for chronically ill (%)
People in Group quarters - Military hospitals or wards for chronically ill (%)
People in Group quarters - Other hospitals or wards for chronically ill (%)
People in Group quarters - Hospitals or wards for drug/alcohol abuse (%)
People in Group quarters - Mental (Psychiatric) hospitals or wards (%)
People in Group quarters - Schools, hospitals, or wards for the mentally retarded (%)
People in Group quarters - Schools, hospitals, or wards for the physically handicapped (%)
People in Group quarters - Institutions for the deaf (%)
People in Group quarters - Institutions for the blind (%)
People in Group quarters - Orthopedic wards and institutions for the physically handicapped (%)
People in Group quarters - Wards in general hospitals for patients who have no usual home elsewhere (%)
People in Group quarters - Wards in military hospitals for patients who have no usual home elsewhere (%)
People in Group quarters - Juvenile institutions (%)
People in Group quarters - Long-term care (%)
People in Group quarters - Homes for abused, dependent, and neglected children (%)
People in Group quarters - Residential treatment centers for emotionally disturbed children (%)
People in Group quarters - Training schools for juvenile delinquents (%)
People in Group quarters - Short-term care, detention or diagnostic centers for delinquent children (%)
People in Group quarters - Type of juvenile institution unknown (%)
People in Group quarters - Noninstitutionalized population (%)
People in Group quarters - College dormitories (includes college quarters off campus) (%)
People in Group quarters - Military quarters (%)
People in Group quarters - On base (%)
People in Group quarters - Barracks, unaccompanied personnel housing (UPH), (Enlisted/Officer), ;and similar group living quarters for military personnel (%)
People in Group quarters - Transient quarters for temporary residents (%)
People in Group quarters - Military ships (%)
People in Group quarters - Group homes (%)
People in Group quarters - Homes or halfway houses for drug/alcohol abuse (%)
People in Group quarters - Homes for the mentally ill (%)
People in Group quarters - Homes for the mentally retarded (%)
People in Group quarters - Homes for the physically handicapped (%)
People in Group quarters - Other group homes (%)
People in Group quarters - Religious group quarters (%)
People in Group quarters - Dormitories (%)
People in Group quarters - Agriculture workers' dormitories on farms (%)
People in Group quarters - Job Corps and vocational training facilities (%)
People in Group quarters - Other workers' dormitories (%)
People in Group quarters - Crews of maritime vessels (%)
People in Group quarters - Other nonhousehold living situations (%)
People in Group quarters - Other noninstitutional group quarters (%)
Residents speaking English at home (%)
Residents speaking English at home - Born in the United States (%)
Residents speaking English at home - Native, born elsewhere (%)
Residents speaking English at home - Foreign born (%)
Residents speaking Spanish at home (%)
Residents speaking Spanish at home - Born in the United States (%)
Residents speaking Spanish at home - Native, born elsewhere (%)
Residents speaking Spanish at home - Foreign born (%)
Residents speaking other language at home (%)
Residents speaking other language at home - Born in the United States (%)
Residents speaking other language at home - Native, born elsewhere (%)
Residents speaking other language at home - Foreign born (%)
Class of Workers - Employee of private company (%)
Class of Workers - Self-employed in own incorporated business (%)
Class of Workers - Private not-for-profit wage and salary workers (%)
Class of Workers - Local government workers (%)
Class of Workers - State government workers (%)
Class of Workers - Federal government workers (%)
Class of Workers - Self-employed workers in own not incorporated business and Unpaid family workers (%)
House heating fuel used in houses and condos - Utility gas (%)
House heating fuel used in houses and condos - Bottled, tank, or LP gas (%)
House heating fuel used in houses and condos - Electricity (%)
House heating fuel used in houses and condos - Fuel oil, kerosene, etc. (%)
House heating fuel used in houses and condos - Coal or coke (%)
House heating fuel used in houses and condos - Wood (%)
House heating fuel used in houses and condos - Solar energy (%)
House heating fuel used in houses and condos - Other fuel (%)
House heating fuel used in houses and condos - No fuel used (%)
House heating fuel used in apartments - Utility gas (%)
House heating fuel used in apartments - Bottled, tank, or LP gas (%)
House heating fuel used in apartments - Electricity (%)
House heating fuel used in apartments - Fuel oil, kerosene, etc. (%)
House heating fuel used in apartments - Coal or coke (%)
House heating fuel used in apartments - Wood (%)
House heating fuel used in apartments - Solar energy (%)
House heating fuel used in apartments - Other fuel (%)
House heating fuel used in apartments - No fuel used (%)
Armed forces status - In Armed Forces (%)
Armed forces status - Civilian (%)
Armed forces status - Civilian - Veteran (%)
Armed forces status - Civilian - Nonveteran (%)
Fatal accidents locations in years 2005-2021
Fatal accidents locations in 2005
Fatal accidents locations in 2006
Fatal accidents locations in 2007
Fatal accidents locations in 2008
Fatal accidents locations in 2009
Fatal accidents locations in 2010
Fatal accidents locations in 2011
Fatal accidents locations in 2012
Fatal accidents locations in 2013
Fatal accidents locations in 2014
Fatal accidents locations in 2015
Fatal accidents locations in 2016
Fatal accidents locations in 2017
Fatal accidents locations in 2018
Fatal accidents locations in 2019
Fatal accidents locations in 2020
Fatal accidents locations in 2021
Alcohol use - People drinking some alcohol every month (%)
Alcohol use - People not drinking at all (%)
Alcohol use - Average days/month drinking alcohol
Alcohol use - Average drinks/week
Alcohol use - Average days/year people drink much
Audiometry - Average condition of hearing (%)
Audiometry - People that can hear a whisper from across a quiet room (%)
Audiometry - People that can hear normal voice from across a quiet room (%)
Audiometry - Ears ringing, roaring, buzzing (%)
Audiometry - Had a job exposure to loud noise (%)
Audiometry - Had off-work exposure to loud noise (%)
Blood Pressure & Cholesterol - Has high blood pressure (%)
Blood Pressure & Cholesterol - Checking blood pressure at home (%)
Blood Pressure & Cholesterol - Frequently checking blood cholesterol (%)
Blood Pressure & Cholesterol - Has high cholesterol level (%)
Consumer Behavior - Money monthly spent on food at supermarket/grocery store
Consumer Behavior - Money monthly spent on food at other stores
Consumer Behavior - Money monthly spent on eating out
Consumer Behavior - Money monthly spent on carryout/delivered foods
Consumer Behavior - Income spent on food at supermarket/grocery store (%)
Consumer Behavior - Income spent on food at other stores (%)
Consumer Behavior - Income spent on eating out (%)
Consumer Behavior - Income spent on carryout/delivered foods (%)
Current Health Status - General health condition (%)
Current Health Status - Blood donors (%)
Current Health Status - Has blood ever tested for HIV virus (%)
Current Health Status - Left-handed people (%)
Dermatology - People using sunscreen (%)
Diabetes - Diabetics (%)
Diabetes - Had a blood test for high blood sugar (%)
Diabetes - People taking insulin (%)
Diet Behavior & Nutrition - Diet health (%)
Diet Behavior & Nutrition - Milk product consumption (# of products/month)
Diet Behavior & Nutrition - Meals not home prepared (#/week)
Diet Behavior & Nutrition - Meals from fast food or pizza place (#/week)
Diet Behavior & Nutrition - Ready-to-eat foods (#/month)
Diet Behavior & Nutrition - Frozen meals/pizza (#/month)
Drug Use - People that ever used marijuana or hashish (%)
Drug Use - Ever used hard drugs (%)
Drug Use - Ever used any form of cocaine (%)
Drug Use - Ever used heroin (%)
Drug Use - Ever used methamphetamine (%)
Health Insurance - People covered by health insurance (%)
Kidney Conditions-Urology - Avg. # of times urinating at night
Medical Conditions - People with asthma (%)
Medical Conditions - People with anemia (%)
Medical Conditions - People with psoriasis (%)
Medical Conditions - People with overweight (%)
Medical Conditions - Elderly people having difficulties in thinking or remembering (%)
Medical Conditions - People who ever received blood transfusion (%)
Medical Conditions - People having trouble seeing even with glass/contacts (%)
Medical Conditions - People with arthritis (%)
Medical Conditions - People with gout (%)
Medical Conditions - People with congestive heart failure (%)
Medical Conditions - People with coronary heart disease (%)
Medical Conditions - People with angina pectoris (%)
Medical Conditions - People who ever had heart attack (%)
Medical Conditions - People who ever had stroke (%)
Medical Conditions - People with emphysema (%)
Medical Conditions - People with thyroid problem (%)
Medical Conditions - People with chronic bronchitis (%)
Medical Conditions - People with any liver condition (%)
Medical Conditions - People who ever had cancer or malignancy (%)
Mental Health - People who have little interest in doing things (%)
Mental Health - People feeling down, depressed, or hopeless (%)
Mental Health - People who have trouble sleeping or sleeping too much (%)
Mental Health - People feeling tired or having little energy (%)
Mental Health - People with poor appetite or overeating (%)
Mental Health - People feeling bad about themself (%)
Mental Health - People who have trouble concentrating on things (%)
Mental Health - People moving or speaking slowly or too fast (%)
Mental Health - People having thoughts they would be better off dead (%)
Oral Health - Average years since last visit a dentist
Oral Health - People embarrassed because of mouth (%)
Oral Health - People with gum disease (%)
Oral Health - General health of teeth and gums (%)
Oral Health - Average days a week using dental floss/device
Oral Health - Average days a week using mouthwash for dental problem
Oral Health - Average number of teeth
Pesticide Use - Households using pesticides to control insects (%)
Pesticide Use - Households using pesticides to kill weeds (%)
Physical Activity - People doing vigorous-intensity work activities (%)
Physical Activity - People doing moderate-intensity work activities (%)
Physical Activity - People walking or bicycling (%)
Physical Activity - People doing vigorous-intensity recreational activities (%)
Physical Activity - People doing moderate-intensity recreational activities (%)
Physical Activity - Average hours a day doing sedentary activities
Physical Activity - Average hours a day watching TV or videos
Physical Activity - Average hours a day using computer
Physical Functioning - People having limitations keeping them from working (%)
Physical Functioning - People limited in amount of work they can do (%)
Physical Functioning - People that need special equipment to walk (%)
Physical Functioning - People experiencing confusion/memory problems (%)
Physical Functioning - People requiring special healthcare equipment (%)
Prescription Medications - Average number of prescription medicines taking
Preventive Aspirin Use - Adults 40+ taking low-dose aspirin (%)
Reproductive Health - Vaginal deliveries (%)
Reproductive Health - Cesarean deliveries (%)
Reproductive Health - Deliveries resulted in a live birth (%)
Reproductive Health - Pregnancies resulted in a delivery (%)
Reproductive Health - Women breastfeeding newborns (%)
Reproductive Health - Women that had a hysterectomy (%)
Reproductive Health - Women that had both ovaries removed (%)
Reproductive Health - Women that have ever taken birth control pills (%)
Reproductive Health - Women taking birth control pills (%)
Reproductive Health - Women that have ever used Depo-Provera or injectables (%)
Reproductive Health - Women that have ever used female hormones (%)
Sexual Behavior - People 18+ that ever had sex (vaginal, anal, or oral) (%)
Sexual Behavior - Males 18+ that ever had vaginal sex with a woman (%)
Sexual Behavior - Males 18+ that ever performed oral sex on a woman (%)
Sexual Behavior - Males 18+ that ever had anal sex with a woman (%)
Sexual Behavior - Males 18+ that ever had any sex with a man (%)
Sexual Behavior - Females 18+ that ever had vaginal sex with a man (%)
Sexual Behavior - Females 18+ that ever performed oral sex on a man (%)
Sexual Behavior - Females 18+ that ever had anal sex with a man (%)
Sexual Behavior - Females 18+ that ever had any kind of sex with a woman (%)
Sexual Behavior - Average age people first had sex
Sexual Behavior - Average number of female sex partners in lifetime (males 18+)
Sexual Behavior - Average number of female vaginal sex partners in lifetime (males 18+)
Sexual Behavior - Average age people first performed oral sex on a woman (18+)
Sexual Behavior - Average number of woman performed oral sex on in lifetime (18+)
Sexual Behavior - Average number of male sex partners in lifetime (males 18+)
Sexual Behavior - Average number of male anal sex partners in lifetime (males 18+)
Sexual Behavior - Average age people first performed oral sex on a man (18+)
Sexual Behavior - Average number of male oral sex partners in lifetime (18+)
Sexual Behavior - People using protection when performing oral sex (%)
Sexual Behavior - Average number of times people have vaginal or anal sex a year
Sexual Behavior - People having sex without condom (%)
Sexual Behavior - Average number of male sex partners in lifetime (females 18+)
Sexual Behavior - Average number of male vaginal sex partners in lifetime (females 18+)
Sexual Behavior - Average number of female sex partners in lifetime (females 18+)
Sexual Behavior - Circumcised males 18+ (%)
Sleep Disorders - Average hours sleeping at night
Sleep Disorders - People that has trouble sleeping (%)
Smoking-Cigarette Use - People smoking cigarettes (%)
Taste & Smell - People 40+ having problems with smell (%)
Taste & Smell - People 40+ having problems with taste (%)
Taste & Smell - People 40+ that ever had wisdom teeth removed (%)
Taste & Smell - People 40+ that ever had tonsils teeth removed (%)
Taste & Smell - People 40+ that ever had a loss of consciousness because of a head injury (%)
Taste & Smell - People 40+ that ever had a broken nose or other serious injury to face or skull (%)
Taste & Smell - People 40+ that ever had two or more sinus infections (%)
Weight - Average height (inches)
Weight - Average weight (pounds)
Weight - Average BMI
Weight - People that are obese (%)
Weight - People that ever were obese (%)
Weight - People trying to lose weight (%)
100%
urban population.
Estimated median house/condo value in 2022: $101,215
45205:
$101,215Ohio:
$204,100
Median resident age: This zip code:
32.4 yearsOhio median age:
39.9 years
Average household size: This zip code:
2.6 peopleOhio:
2.4 people
Averages for the 2020 tax year for zip code 45205, filed in 2021:
Average Adjusted Gross Income (AGI) in 2020: $32,557 (Individual Income Tax Returns) Here:
$32,557State:
$67,288
Salary/wage: $29,911 (reported on 87.1% of returns )Here:
$29,911State:
$55,628
(% of AGI for various income ranges: 1149.2% for AGIs below $25k , 3683.1% for AGIs $25k-50k , 6850.0% for AGIs $50k-75k , 9596.3% for AGIs $75k-100k , 15628.5% for AGIs $100k-200k ) Taxable interest for individuals: $545 (reported on 9.2% of returns )This zip code:
$545Ohio:
$1,518
(% of AGI for various income ranges: 4.9% for AGIs below $25k , 2.8% for AGIs $25k-50k , 13.0% for AGIs $50k-75k , 12.6% for AGIs $75k-100k , 53.1% for AGIs $100k-200k ) Ordinary dividends: $2,393 (reported on 6.0% of returns )(% of AGI for various income ranges: 3.0% for AGIs below $25k , 10.8% for AGIs $25k-50k , 27.4% for AGIs $50k-75k , 33.2% for AGIs $75k-100k , 413.1% for AGIs $100k-200k ) Net capital gain/loss in AGI: +$9,845 (reported on 4.4% of returns )Here:
+$9,845State:
+$18,919
(% of AGI for various income ranges: 1.6% for AGIs below $25k , 8.0% for AGIs $25k-50k , 52.1% for AGIs $50k-75k , 227.9% for AGIs $75k-100k , 1771.5% for AGIs $100k-200k ) Profit/loss from business: +$8,119 (reported on 13.1% of returns )Here:
+$8,119State:
+$13,744
(% of AGI for various income ranges: 112.0% for AGIs below $25k , 119.4% for AGIs $25k-50k , 120.5% for AGIs $50k-75k , 283.7% for AGIs $75k-100k , 690.8% for AGIs $100k-200k ) Taxable individual retirement arrangement distribution: $13,123 (reported on 2.9% of returns )45205:
$13,123Ohio:
$18,876
(% of AGI for various income ranges: 16.3% for AGIs below $25k , 23.1% for AGIs $25k-50k , 48.2% for AGIs $50k-75k , 314.2% for AGIs $75k-100k , 795.4% for AGIs $100k-200k ) Total itemized deductions: $24,643 (reported on 0.9% of returns )Here:
$24,643State:
$33,869
(% of AGI for various income ranges: 41.6% for AGIs $25k-50k , 648.5% for AGIs $100k-200k ) Charity contributions: $11,275 (reported on 0.5% of returns )Here:
$11,275State:
$14,577
(% of AGI for various income ranges: 237.4% for AGIs $75k-100k ) Taxes paid: $5,257 (reported on 0.9% of returns )(% of AGI for various income ranges: 7.5% for AGIs $25k-50k , 161.5% for AGIs $100k-200k ) Earned income credit: $2,716 (reported on 35.3% of returns )(% of AGI for various income ranges: 171.3% for AGIs below $25k , 96.7% for AGIs $25k-50k ) Percentage of individuals using paid preparers for their 2020 taxes: 93.0%(% for various income ranges: 91.9% for AGIs below $25k , 94.5% for AGIs $25k-50k , 93.5% for AGIs $50k-75k , 92.6% for AGIs $75k-100k , 90.9% for AGIs $100k-200k , 100.0% for AGIs over 200k )
Averages for the 2012 tax year for zip code 45205, filed in 2013:
Average Adjusted Gross Income (AGI) in 2012: $26,703 (Individual Income Tax Returns) Here:
$26,703State:
$54,926
Salary/wage: $25,360 (reported on 88.7% of returns )Here:
$25,360State:
$45,869
(% of AGI for various income ranges: 81.4% for AGIs below $25k , 90.5% for AGIs $25k-50k , 85.7% for AGIs $50k-75k , 81.3% for AGIs $75k-100k , 71.6% for AGIs $100k-200k ) Taxable interest for individuals: $629 (reported on 11.0% of returns )This zip code:
$629Ohio:
$1,297
(% of AGI for various income ranges: 0.3% for AGIs below $25k , 0.1% for AGIs $25k-50k , 0.4% for AGIs $50k-75k , 0.2% for AGIs $75k-100k , 0.3% for AGIs $100k-200k ) Ordinary dividends: $2,535 (reported on 6.7% of returns )(% of AGI for various income ranges: 0.5% for AGIs below $25k , 0.3% for AGIs $25k-50k , 0.9% for AGIs $50k-75k , 0.4% for AGIs $75k-100k , 2.1% for AGIs $100k-200k ) Net capital gain/loss in AGI: +$1,018 (reported on 3.9% of returns )Here:
+$1,018State:
+$11,232
(% of AGI for various income ranges: 1.5% for AGIs $100k-200k ) Profit/loss from business: +$9,549 (reported on 12.7% of returns )Here:
+$9,549State:
+$12,773
(% of AGI for various income ranges: 10.6% for AGIs below $25k , 1.3% for AGIs $25k-50k , 0.9% for AGIs $50k-75k , 4.3% for AGIs $75k-100k , 4.0% for AGIs $100k-200k ) Taxable individual retirement arrangement distribution: $10,578 (reported on 3.8% of returns )45205:
$10,578Ohio:
$14,511
(% of AGI for various income ranges: 0.8% for AGIs below $25k , 1.1% for AGIs $25k-50k , 1.8% for AGIs $50k-75k , 5.4% for AGIs $75k-100k ) Total itemized deductions: $13,663 (23% of AGI, reported on 10.6% of returns )Here:
$13,663State:
$21,278
Here:
22.6% of AGIState:
18.8% of AGI
(% of AGI for various income ranges: 2.0% for AGIs below $25k , 4.3% for AGIs $25k-50k , 7.9% for AGIs $50k-75k , 7.9% for AGIs $75k-100k , 12.7% for AGIs $100k-200k ) Charity contributions: $2,718 (reported on 7.1% of returns )(% of AGI for various income ranges: 0.2% for AGIs below $25k , 0.5% for AGIs $25k-50k , 1.0% for AGIs $50k-75k , 0.8% for AGIs $75k-100k , 2.5% for AGIs $100k-200k ) Taxes paid: $5,116 (reported on 10.6% of returns )(% of AGI for various income ranges: 0.6% for AGIs below $25k , 1.3% for AGIs $25k-50k , 2.8% for AGIs $50k-75k , 3.7% for AGIs $75k-100k , 6.0% for AGIs $100k-200k ) Earned income credit: $2,835 (reported on 41.3% of returns )(% of AGI for various income ranges: 13.1% for AGIs below $25k , 1.5% for AGIs $25k-50k ) Percentage of individuals using paid preparers for their 2012 taxes: 45.2%(% for various income ranges: 44.0% for AGIs below $25k , 47.8% for AGIs $25k-50k , 45.3% for AGIs $50k-75k , 43.5% for AGIs $75k-100k , 50.0% for AGIs $100k-200k )
Averages for the 2004 tax year for zip code 45205, filed in 2005:
Average Adjusted Gross Income (AGI) in 2004: $25,569 (Individual Income Tax Returns) Here:
$25,569State:
$44,480
Salary/wage: $24,614 (reported on 91.2% of returns )Here:
$24,614State:
$39,198
(% of AGI for various income ranges: 88.6% for AGIs below $10k , 88.1% for AGIs $10k-25k , 90.5% for AGIs $25k-50k , 87.4% for AGIs $50k-75k , 87.3% for AGIs $75k-100k , 69.7% for AGIs over 100k ) Taxable interest for individuals: $760 (reported on 20.8% of returns )This zip code:
$760Ohio:
$1,532
(% of AGI for various income ranges: 1.4% for AGIs below $10k , 0.7% for AGIs $10k-25k , 0.5% for AGIs $25k-50k , 0.7% for AGIs $50k-75k , 0.3% for AGIs $75k-100k , 0.8% for AGIs over 100k ) Taxable dividends: $1,696 (reported on 10.9% of returns )(% of AGI for various income ranges: 0.7% for AGIs below $10k , 0.6% for AGIs $10k-25k , 0.5% for AGIs $25k-50k , 0.7% for AGIs $50k-75k , 0.4% for AGIs $75k-100k , 3.7% for AGIs over 100k ) Net capital gain/loss: +$1,979 (reported on 6.2% of returns )Here:
+$1,979State:
+$8,582
(% of AGI for various income ranges: -0.3% for AGIs below $10k , 0.1% for AGIs $10k-25k , 0.2% for AGIs $25k-50k , 0.7% for AGIs $50k-75k , 0.3% for AGIs $75k-100k , 4.8% for AGIs over 100k ) Profit/loss from business: +$6,837 (reported on 9.3% of returns )Here:
+$6,837State:
+$10,813
(% of AGI for various income ranges: 7.6% for AGIs below $10k , 3.9% for AGIs $10k-25k , 1.5% for AGIs $25k-50k , 1.8% for AGIs $50k-75k , 1.5% for AGIs $75k-100k , 2.4% for AGIs over 100k ) IRA payment deduction: $1,871 (reported on 1.6% of returns )Total itemized deductions: $11,861 (24% of AGI, reported on 18.4% of returns )Here:
$11,861State:
$17,503
Here:
23.7% of AGIState:
20.8% of AGI
(% of AGI for various income ranges: 2.0% for AGIs below $10k , 3.8% for AGIs $10k-25k , 8.4% for AGIs $25k-50k , 11.4% for AGIs $50k-75k , 14.2% for AGIs $75k-100k , 17.1% for AGIs over 100k ) Charity contributions deductions: $1,860 (4% of AGI, reported on 14.4% of returns )Here:
3.5% of AGIState:
3.4% of AGI
(% of AGI for various income ranges: 0.2% for AGIs below $10k , 0.4% for AGIs $10k-25k , 0.9% for AGIs $25k-50k , 1.3% for AGIs $50k-75k , 1.7% for AGIs $75k-100k , 3.4% for AGIs over 100k ) Total tax: $2,935 (reported on 60.8% of returns )(% of AGI for various income ranges: 1.8% for AGIs below $10k , 3.4% for AGIs $10k-25k , 6.6% for AGIs $25k-50k , 9.2% for AGIs $50k-75k , 11.2% for AGIs $75k-100k , 14.7% for AGIs over 100k ) Earned income credit: $2,061 (reported on 35.4% of returns )Percentage of individuals using paid preparers for their 2004 taxes: 57.0%(% for various income ranges: 54.8% for AGIs below $10k , 63.3% for AGIs $10k-25k , 54.7% for AGIs $25k-50k , 50.3% for AGIs $50k-75k , 42.6% for AGIs $75k-100k , 51.9% for AGIs over 100k )
Estimated median household income in 2022: This zip code:
$35,917Ohio:
$65,720
Nearest zip codes: 45204 ,
41016 ,
45238 ,
45225 ,
45214 ,
45203 .
Cincinnati Zip Code Map
Percentage of family households: This zip code:
42.4%Ohio:
43.3%
Percentage of households with unmarried partners: This zip code:
11.2%Ohio:
44.6%
Likely homosexual households (counted as self-reported same-sex unmarried-partner households)
Lesbian couples: 0.1% of all households Gay men: 0.6% of all households
Household received Food Stamps/SNAP in the past 12 months: 1,939Household did not receive Food Stamps/SNAP in the past 12 months: 5,270
Women who had a birth in the past 12 months: 194 (43 now married , 145 unmarried) Women who did not have a birth in the past 12 months: 4,259 (1,193 now married , 3,067 unmarried)
Housing units in zip code 45205 with a mortgage: 1,223 (88
second mortgage , 55
both second mortgage and home equity loan )
Houses without a mortgage: 13
Median monthly owner costs for units with a mortgage: $1,133
Median monthly owner costs for units without a mortgage: $479
Residents with income below the poverty level in 2022:
This zip code:
32.2%Whole state:
13.4%
Residents with income below 50% of the poverty level in 2022:
This zip code:
19.7%Whole state:
7.0%
Median number of rooms in houses and condos: Median number of rooms in apartments: Notable locations in this zip code not listed on our city pages
Click to draw/clear zip code borders Notable locations in zip code 45205: (A) , Number 24 Engine House (B) , Police Station Number 3 (C) , Price Hill Library (D) . Display/hide their locations on the map
Churches in zip code 45205 include: (A) , Plymouth Congregational Church (B) , Church of God (C) , Price Hill Church of the Nazarene (D) , Church of Christ (E) , Price Hill Church of God (F) , Price Hill United Methodist Church (G) , Light House Missionary Church (H) , Price Hill Baptist Church (I) . Display/hide their locations on the map
Cemeteries: (1) , Price Hill Cemeteries (2) . Display/hide their locations on the map
Parks in zip code 45205 include: (1) , Mayfield Park (2) , Embshoff Woods and Nature Preserve (3) , Wilson Common (4) , Panther Athletic Complex (5) , The Pit (6) , Whittier Gardens (7) , Dempsey Playground (8) . Display/hide their locations on the map
Year house built (houses)
0 2020 or later39 2010 to 2019114 2000 to 2009171 1990 to 1999334 1980 to 1989677 1970 to 1979880 1960 to 1969968 1950 to 1959645 1940 to 19494,273 1939 or earlier
Zip code 45205 household income distribution in 2022 1,039 Less than $10,000605 $10,000 to $14,999427 $15,000 to $19,999615 $20,000 to $24,999367 $25,000 to $29,999509 $30,000 to $34,999379 $35,000 to $39,999308 $40,000 to $44,999401 $45,000 to $49,999493 $50,000 to $59,999543 $60,000 to $74,999773 $75,000 to $99,999443 $100,000 to $124,999188 $125,000 to $149,99983 $150,000 to $199,99951 $200,000 or moreEstimate of home value of owner-occupied houses/condos in 2022 in zip code 45205 89 Less than $10,00018 $10,000 to $14,99919 $20,000 to $24,99999 $25,000 to $29,99938 $30,000 to $34,99945 $35,000 to $39,999204 $40,000 to $49,999112 $50,000 to $59,999203 $60,000 to $69,999272 $70,000 to $79,999196 $80,000 to $89,999281 $90,000 to $99,999227 $100,000 to $124,999193 $125,000 to $149,999201 $150,000 to $174,999124 $175,000 to $199,99954 $200,000 to $249,99965 $250,000 to $299,99927 $300,000 to $399,99964 $500,000 to $749,99912 $750,000 to $999,99921 $1,000,000 to $1,499,99916 $2,000,000 or moreRent paid by renters in 2022 in zip code 45205 17 Less than $10059 $100 to $14963 $150 to $199566 $200 to $249102 $250 to $29940 $300 to $34980 $350 to $399109 $400 to $449130 $450 to $499346 $500 to $549297 $550 to $599358 $600 to $649331 $650 to $699326 $700 to $749305 $750 to $799268 $800 to $899335 $900 to $999255 $1,000 to $1,249115 $1,250 to $1,49963 $1,500 to $1,99969 No cash rent
Median gross rent in 2022: $822.
Median price asked for vacant for-sale houses and condos in 2022: $233,049.
Estimated median house (or condo) value in 2022 for: White Non-Hispanic householders: $98,867Black or African American householders: $104,295Asian householders: $95,347Some other race householders: $80,678Two or more races householders: $128,352Hispanic or Latino householders: $149,328Estimated median house or condo value in 2022: $101,215
45205:
$101,215Ohio:
$204,100
Lower value quartile - upper value quartile: $65,686 - $150,802
Mean price in 2022: Detached houses: $96,994Here:
$96,994State:
$254,366
Townhouses or other attached units: $146,802Here:
$146,802State:
$225,733
In 2-unit structures: $106,590Here:
$106,590State:
$144,384
In 5-or-more-unit structures: $167,046Here:
$167,046State:
$211,593
Housing units in structures:
One, detached: 4,339One, attached: 214Two: 1,0433 or 4: 6845 to 9: 40210 to 19: 91220 to 49: 5450 or more: 544Mobile homes: 26Unemployment : 7.6%
Means of transportation to work in zip code 45205 61.6% 4,424 Drove a car alone17.3% 1,241 Carpooled7.6% 545 Bus or trolley bus0.2% 15 Motorcycle2.6% 186 Walked1.8% 129 Other means6.9% 492 Worked at homeTravel time to work (commute) in zip code 45205 347 Less than 5 minutes264 5 to 9 minutes895 10 to 14 minutes1,239 15 to 19 minutes791 20 to 24 minutes416 25 to 29 minutes1,393 30 to 34 minutes349 35 to 39 minutes152 40 to 44 minutes334 45 to 59 minutes226 60 to 89 minutes156 90 or more minutes
Neighborhoods in zip code 45205: Percentage of zip code residents living and working in this county: 80.8%
Household type by relationship:
Households: 19,056
Male householders: 2,854 (1,225 living alone ), Female householders: 4,335 (1,328 living alone )2,044 spouses (1,991 opposite-sex spouses ), 759 unmarried partners , (747 opposite-sex unmarried partners ), 6,776 children (5,995 natural , 288 adopted , 491 stepchildren ), 615 grandchildren , 314 brothers or sisters , 280 parents , 0 foster children , 134 other relatives , 632 non-relatives In group quarters: 227 (-1 institutionalized population )
Size of family households: 1,605 2-persons , 817 3-persons , 680 4-persons , 438 5-persons , 270 6-persons , 196 7-or-more-persons
Size of nonfamily households: 2,552 1-person , 572 2-persons , 14 3-persons , 1 4-persons , 30 5-persons
2,164 married couples with children. single-parent households (758 men , 2,411 women ).
81.6% of residents of 45205 zip code speak English at home. of residents speak Spanish at home (23% very well, 31% well, 35% not well, 10% not at all ).of residents speak other Indo-European language at home (46% very well, 54% not well ).of residents speak Asian or Pacific Island language at home (25% very well, 69% well, 6% not at all ).of residents speak other language at home (48% very well, 27% well, 16% not well, 9% not at all ).
Foreign born population: 2,175 (11.4%)
(26.1%
of them are naturalized citizens )
This zip code:
11.4%Whole state:
5.0%
40% El Salvador 20% Guatemala 10% Haiti 8% Honduras 6% Bangladesh 4% Hong Kong 3% Togo 9% American 8% German 4% English 2% Irish 2% Jamaican 1% Italian 1% African
Year of entry for the foreign-born population
1,684 2010 or later 539 2000 to 2009 251 1990 to 1999 276 Before 1990
There are
37 Medical Specialists in Zip Code 45205 .
Facilities with environmental interests located in this zip code:
BP OIL NO 08991 (3749 GLENWAY AVE in CINCINNATI, OH)
STATE MASTER (Ohio general info) - AIR MAJOR, -31-5541-1038-U, EPCRA, RCRA-OHD987028644, HAZARDOUS WASTE PROGRAM Conditionally Exempt Small Quantity Generators, less than 100 kg/month of hazardous waste (Resource Conservation and Recovery Act (tracking hazardous waste)) - notification Organizations: BP OIL CO (CONTACT/OWNER)
, BP OIL COMPANY (CONTACT/OWNER)
Alternative names: BP OIL CO SITE 08991
B AND E ST LAWRENCE (3528 WARSAW AVE in CINCINNATI, OH)
Small Quantity Generators, between 100 kg and 1000 kg of hazardous waste/month (Resource Conservation and Recovery Act (tracking hazardous waste)) - notification Organizations: VARIN WILLIAM F SR (CONTACT/OWNER)
Housing units lacking complete plumbing facilities: 2.7%
Housing units lacking complete kitchen facilities: 3.1%
73.3% Utility gas 23.4% Electricity 1.3% Bottled, tank, or LP gas 1.0% No fuel used 0.8% Other fuel
Population in 1990: 23,052. Population change in the 1990s: +91 (+0.4%).
Place of birth for U.S.-born residents:
This state: 13,017Northeast: 863Midwest: 323South: 1,875West: 379
49% of the 45205 zip code residents lived in the same house 5 years ago.
Out of people who lived in different houses, 81% lived in this county.
Out of people who lived in different counties, 50% lived in Ohio.
89% of the 45205 zip code residents lived in the same house 1 year ago.
Out of people who lived in different houses, 69% moved from this county.
Out of people who lived in different houses, 5% moved from different county within same state.
Out of people who lived in different houses, 19% moved from different state.
Out of people who lived in different houses, 4% moved from abroad.
Private vs. public school enrollment:
Students in private schools in grades 1 to 8 (elementary and middle school): 744
Students in private schools in grades 9 to 12 (high school): 330
Students in private undergraduate colleges: 148
Occupation by median earnings in the past 12 months ($)
89,492 Architecture and engineering occupations 63,196 Health diagnosing and treating practitioners and other technical occupations 55,583 Business and financial operations occupations 54,199 Computer and mathematical occupations 49,468 Arts, design, entertainment, sports, and media occupations 46,878 Health technologists and technicians
Companies with federal contracts located in this zip code:
BRAFFCO MANUFACTURING INC (1006 WOODLAWN AVE in CINCINNATI, OH; small business)
$2,502 with Army for Hardware, Commercial. Signed on 2004-09-14. Completion date: 2004-11-15.
Top industries in this zip code by the number of employees in 2005:
Educational Services: Elementary and Secondary Schools (50-99 employees: 2 establishments, 20-49 employees: 1 establishment)Accommodation and Food Services: Limited-Service Restaurants (20-49: 2, 10-19: 5, 1-4: 3)Other Services (except Public Administration): Religious Organizations (50-99: 1, 20-49: 2, 1-4: 4)Accommodation and Food Services: Full-Service Restaurants (20-49: 3, 1-4: 3)Accommodation and Food Services: Drinking Places (Alcoholic Beverages) (20-49: 1, 5-9: 1, 1-4: 5)Finance and Insurance: Savings Institutions (10-19: 3)Professional, Scientific, and Technical Services: Tax Preparation Services (20-49: 1, 5-9: 1)
People in group quarters in 2010:
92 people in nursing facilities/skilled-nursing facilities
79 people in residential treatment centers for adults
23 people in group homes intended for adults
People in group quarters in 2000:
118 people in nursing homes
67 people in homes or halfway houses for drug/alcohol abuse
35 people in schools, hospitals, or wards for the intellectually disabled
23 people in religious group quarters
16 people in homes for the mentally retarded
14 people in homes for the mentally ill
Fatal accident statistics in 2014:
Fatal accident count: 1Vehicles involved in fatal accidents: 1Fatal accidents caused by drunken drivers: 0Fatalities: 1Persons involved in fatal accidents: 1Pedestrians involved in fatal accidents: 1
Fatal accident statistics in 2012:
Fatal accident count: 1Vehicles involved in fatal accidents: 1Fatal accidents caused by drunken drivers: 0Fatalities: 1Persons involved in fatal accidents: 1Pedestrians involved in fatal accidents: 1
Home Mortgage Disclosure Act Aggregated Statistics For Year 2009(Based on 4 full and 10 partial tracts) A) FHA, FSA/RHS & VA B) Conventional C) Refinancings D) Home Improvement Loans E) Loans on Dwellings For 5+ Families F) Non-occupant Loans on G) Loans On Manufactured Number Average Value Number Average Value Number Average Value Number Average Value Number Average Value Number Average Value Number Average Value
LOANS ORIGINATED 94 $81,048 49 $53,975 180 $90,918 15 $36,970 1 $541,240 65 $69,466 1 $60,440 APPLICATIONS APPROVED, NOT ACCEPTED 2 $35,825 7 $49,403 20 $72,540 4 $9,340 0 $0 5 $74,332 1 $24,740 APPLICATIONS DENIED 21 $76,583 43 $49,222 172 $76,675 37 $23,625 0 $0 71 $53,361 1 $37,610 APPLICATIONS WITHDRAWN 7 $63,841 7 $42,963 45 $84,159 3 $37,070 0 $0 9 $47,388 0 $0 FILES CLOSED FOR INCOMPLETENESS 4 $69,325 5 $20,554 28 $89,075 4 $37,865 0 $0 16 $60,496 0 $0
Aggregated Statistics For Year 2008(Based on 4 full and 10 partial tracts) A) FHA, FSA/RHS & VA B) Conventional C) Refinancings D) Home Improvement Loans E) Loans on Dwellings For 5+ Families F) Non-occupant Loans on G) Loans On Manufactured Number Average Value Number Average Value Number Average Value Number Average Value Number Average Value Number Average Value Number Average Value
LOANS ORIGINATED 61 $74,368 179 $63,422 225 $73,468 48 $28,469 3 $282,830 193 $59,208 1 $12,000 APPLICATIONS APPROVED, NOT ACCEPTED 5 $73,716 17 $81,955 26 $72,321 5 $21,240 0 $0 10 $53,120 2 $55,060 APPLICATIONS DENIED 38 $80,047 49 $55,964 234 $90,691 86 $23,771 7 $545,889 110 $66,840 0 $0 APPLICATIONS WITHDRAWN 21 $77,619 14 $55,731 56 $84,548 4 $48,660 2 $132,730 18 $53,699 0 $0 FILES CLOSED FOR INCOMPLETENESS 6 $88,477 9 $71,641 21 $96,940 4 $18,582 1 $1,496,000 10 $85,378 0 $0
Aggregated Statistics For Year 2007(Based on 4 full and 10 partial tracts) A) FHA, FSA/RHS & VA B) Conventional C) Refinancings D) Home Improvement Loans E) Loans on Dwellings For 5+ Families F) Non-occupant Loans on G) Loans On Manufactured Number Average Value Number Average Value Number Average Value Number Average Value Number Average Value Number Average Value Number Average Value
LOANS ORIGINATED 42 $85,562 359 $74,257 395 $72,765 85 $41,820 8 $684,719 325 $59,911 4 $30,325 APPLICATIONS APPROVED, NOT ACCEPTED 1 $85,960 44 $70,523 72 $88,945 24 $33,761 0 $0 32 $68,951 2 $15,820 APPLICATIONS DENIED 20 $93,470 187 $72,670 486 $79,897 117 $31,408 9 $414,778 211 $68,728 6 $35,077 APPLICATIONS WITHDRAWN 7 $52,801 60 $80,864 106 $79,851 12 $44,397 0 $0 66 $59,389 0 $0 FILES CLOSED FOR INCOMPLETENESS 0 $0 22 $115,655 42 $80,684 3 $69,563 0 $0 16 $63,854 0 $0
Aggregated Statistics For Year 2006(Based on 4 full and 10 partial tracts) A) FHA, FSA/RHS & VA B) Conventional C) Refinancings D) Home Improvement Loans E) Loans on Dwellings For 5+ Families F) Non-occupant Loans on G) Loans On Manufactured Number Average Value Number Average Value Number Average Value Number Average Value Number Average Value Number Average Value Number Average Value
LOANS ORIGINATED 45 $87,830 518 $66,560 505 $76,850 56 $34,163 12 $341,099 413 $70,720 0 $0 APPLICATIONS APPROVED, NOT ACCEPTED 1 $91,650 101 $70,829 144 $78,402 20 $22,300 2 $129,780 54 $84,657 4 $29,385 APPLICATIONS DENIED 3 $80,763 239 $72,821 533 $82,502 122 $32,517 12 $665,288 228 $70,581 8 $48,121 APPLICATIONS WITHDRAWN 9 $112,823 65 $72,082 190 $83,455 22 $44,299 3 $100,710 73 $64,155 0 $0 FILES CLOSED FOR INCOMPLETENESS 0 $0 40 $67,833 75 $88,110 6 $75,995 0 $0 12 $69,242 0 $0
Aggregated Statistics For Year 2005(Based on 4 full and 10 partial tracts) A) FHA, FSA/RHS & VA B) Conventional C) Refinancings D) Home Improvement Loans E) Loans on Dwellings For 5+ Families F) Non-occupant Loans on G) Loans On Manufactured Number Average Value Number Average Value Number Average Value Number Average Value Number Average Value Number Average Value Number Average Value
LOANS ORIGINATED 65 $88,071 613 $72,903 609 $77,597 87 $50,923 13 $1,575,475 459 $71,383 0 $0 APPLICATIONS APPROVED, NOT ACCEPTED 5 $98,840 106 $65,392 145 $76,560 19 $29,801 0 $0 77 $65,138 2 $29,495 APPLICATIONS DENIED 14 $65,445 294 $65,113 571 $82,235 141 $27,529 5 $191,060 256 $61,737 3 $37,467 APPLICATIONS WITHDRAWN 5 $103,040 82 $75,205 239 $93,815 35 $110,640 3 $170,140 73 $71,528 2 $37,025 FILES CLOSED FOR INCOMPLETENESS 1 $65,770 36 $78,334 47 $80,162 0 $0 0 $0 21 $79,550 1 $100,000
Aggregated Statistics For Year 2004(Based on 4 full and 10 partial tracts) A) FHA, FSA/RHS & VA B) Conventional C) Refinancings D) Home Improvement Loans E) Loans on Dwellings For 5+ Families F) Non-occupant Loans on G) Loans On Manufactured Number Average Value Number Average Value Number Average Value Number Average Value Number Average Value Number Average Value Number Average Value
LOANS ORIGINATED 87 $86,922 620 $71,146 679 $79,301 108 $35,473 23 $1,144,683 442 $67,189 0 $0 APPLICATIONS APPROVED, NOT ACCEPTED 6 $82,608 103 $74,344 183 $79,279 25 $65,298 1 $173,290 103 $68,122 0 $0 APPLICATIONS DENIED 27 $82,439 210 $70,010 580 $79,074 134 $22,369 3 $437,367 170 $69,051 10 $37,727 APPLICATIONS WITHDRAWN 13 $88,562 111 $71,731 299 $84,388 40 $42,854 0 $0 82 $68,649 2 $104,220 FILES CLOSED FOR INCOMPLETENESS 1 $74,230 36 $83,790 94 $86,383 9 $35,888 0 $0 34 $72,449 0 $0
Aggregated Statistics For Year 2003(Based on 4 full and 10 partial tracts) A) FHA, FSA/RHS & VA B) Conventional C) Refinancings D) Home Improvement Loans E) Loans on Dwellings For 5+ Families F) Non-occupant Loans on Number Average Value Number Average Value Number Average Value Number Average Value Number Average Value Number Average Value
LOANS ORIGINATED 117 $86,233 481 $76,232 1,119 $77,274 62 $21,172 15 $492,565 403 $70,370 APPLICATIONS APPROVED, NOT ACCEPTED 2 $68,160 93 $74,425 203 $71,921 17 $20,332 4 $329,972 58 $66,858 APPLICATIONS DENIED 22 $83,433 160 $72,196 586 $77,031 118 $16,041 5 $1,355,060 133 $74,646 APPLICATIONS WITHDRAWN 8 $106,376 56 $79,014 267 $76,537 15 $29,889 0 $0 59 $74,880 FILES CLOSED FOR INCOMPLETENESS 8 $91,309 35 $65,458 74 $82,939 4 $33,580 1 $110,000 23 $69,580
Aggregated Statistics For Year 2002(Based on 4 full and 10 partial tracts) A) FHA, FSA/RHS & VA B) Conventional C) Refinancings D) Home Improvement Loans E) Loans on Dwellings For 5+ Families F) Non-occupant Loans on Number Average Value Number Average Value Number Average Value Number Average Value Number Average Value Number Average Value
LOANS ORIGINATED 163 $84,157 476 $71,695 982 $74,416 90 $19,606 23 $300,899 394 $69,900 APPLICATIONS APPROVED, NOT ACCEPTED 17 $72,471 77 $84,917 261 $77,635 33 $27,047 2 $63,955 32 $68,191 APPLICATIONS DENIED 19 $76,058 158 $67,205 616 $76,358 135 $13,588 2 $147,495 108 $69,917 APPLICATIONS WITHDRAWN 7 $86,916 75 $69,148 284 $79,684 12 $13,338 1 $698,970 39 $63,213 FILES CLOSED FOR INCOMPLETENESS 4 $76,752 40 $68,517 96 $78,409 4 $21,745 0 $0 30 $78,072
Aggregated Statistics For Year 2001(Based on 4 full and 10 partial tracts) A) FHA, FSA/RHS & VA B) Conventional C) Refinancings D) Home Improvement Loans E) Loans on Dwellings For 5+ Families F) Non-occupant Loans on Number Average Value Number Average Value Number Average Value Number Average Value Number Average Value Number Average Value
LOANS ORIGINATED 217 $80,899 412 $73,176 928 $71,502 115 $12,578 17 $483,143 323 $73,619 APPLICATIONS APPROVED, NOT ACCEPTED 15 $74,286 51 $69,494 187 $68,872 19 $15,496 2 $103,940 26 $62,001 APPLICATIONS DENIED 19 $83,229 168 $62,914 748 $70,906 156 $22,352 5 $128,960 93 $62,153 APPLICATIONS WITHDRAWN 14 $87,073 83 $59,723 417 $72,679 34 $17,866 4 $127,728 53 $87,800 FILES CLOSED FOR INCOMPLETENESS 2 $67,840 13 $70,602 64 $77,405 6 $37,735 0 $0 10 $79,294
Aggregated Statistics For Year 2000(Based on 4 full and 10 partial tracts) A) FHA, FSA/RHS & VA B) Conventional C) Refinancings D) Home Improvement Loans E) Loans on Dwellings For 5+ Families F) Non-occupant Loans on Number Average Value Number Average Value Number Average Value Number Average Value Number Average Value Number Average Value
LOANS ORIGINATED 176 $73,081 376 $65,635 526 $66,569 165 $11,295 14 $255,581 251 $64,960 APPLICATIONS APPROVED, NOT ACCEPTED 20 $70,732 63 $60,785 198 $67,154 46 $13,223 1 $362,660 29 $57,708 APPLICATIONS DENIED 34 $58,400 189 $54,808 555 $62,199 184 $14,174 1 $76,000 90 $66,090 APPLICATIONS WITHDRAWN 18 $69,552 67 $59,741 203 $61,951 9 $36,322 1 $60,000 45 $62,627 FILES CLOSED FOR INCOMPLETENESS 1 $65,470 20 $63,604 45 $63,261 1 $22,830 1 $128,000 7 $62,520
Aggregated Statistics For Year 1999(Based on 3 full and 6 partial tracts) A) FHA, FSA/RHS & VA B) Conventional C) Refinancings D) Home Improvement Loans E) Loans on Dwellings For 5+ Families F) Non-occupant Loans on Number Average Value Number Average Value Number Average Value Number Average Value Number Average Value Number Average Value
LOANS ORIGINATED 77 $69,015 293 $61,480 376 $59,121 93 $11,065 8 $331,328 173 $63,454 APPLICATIONS APPROVED, NOT ACCEPTED 5 $61,822 33 $71,782 156 $57,084 29 $9,704 0 $0 16 $56,351 APPLICATIONS DENIED 8 $56,669 104 $59,847 258 $55,630 111 $11,043 3 $256,687 51 $62,446 APPLICATIONS WITHDRAWN 4 $87,452 46 $60,926 137 $59,394 8 $30,852 0 $0 17 $52,224 FILES CLOSED FOR INCOMPLETENESS 0 $0 6 $60,515 37 $62,674 2 $20,305 0 $0 4 $91,910
Private Mortgage Insurance Companies Aggregated Statistics For Year 2009(Based on 3 full and 8 partial tracts) A) Conventional B) Refinancings C) Non-occupant Loans on Number Average Value Number Average Value Number Average Value
LOANS ORIGINATED 6 $49,815 5 $138,802 1 $103,210 APPLICATIONS APPROVED, NOT ACCEPTED 3 $72,930 1 $106,110 2 $50,490 APPLICATIONS DENIED 4 $69,652 2 $172,535 0 $0 APPLICATIONS WITHDRAWN 0 $0 0 $0 0 $0 FILES CLOSED FOR INCOMPLETENESS 0 $0 0 $0 0 $0
Aggregated Statistics For Year 2008(Based on 4 full and 10 partial tracts) A) Conventional B) Refinancings C) Non-occupant Loans on Number Average Value Number Average Value Number Average Value
LOANS ORIGINATED 61 $77,304 22 $89,125 15 $54,625 APPLICATIONS APPROVED, NOT ACCEPTED 32 $67,037 11 $103,696 7 $64,891 APPLICATIONS DENIED 10 $82,392 2 $102,320 5 $69,970 APPLICATIONS WITHDRAWN 2 $73,740 0 $0 0 $0 FILES CLOSED FOR INCOMPLETENESS 10 $111,320 1 $63,930 5 $108,732
Aggregated Statistics For Year 2007(Based on 4 full and 10 partial tracts) A) Conventional B) Refinancings C) Non-occupant Loans on Number Average Value Number Average Value Number Average Value
LOANS ORIGINATED 154 $84,478 51 $91,956 49 $74,291 APPLICATIONS APPROVED, NOT ACCEPTED 27 $95,845 13 $86,980 8 $87,280 APPLICATIONS DENIED 7 $68,570 1 $107,000 4 $55,752 APPLICATIONS WITHDRAWN 8 $83,135 0 $0 1 $81,940 FILES CLOSED FOR INCOMPLETENESS 0 $0 0 $0 0 $0
Aggregated Statistics For Year 2006(Based on 4 full and 10 partial tracts) A) Conventional B) Refinancings C) Non-occupant Loans on Number Average Value Number Average Value Number Average Value
LOANS ORIGINATED 112 $76,049 21 $89,874 38 $61,707 APPLICATIONS APPROVED, NOT ACCEPTED 19 $89,693 14 $92,498 10 $82,350 APPLICATIONS DENIED 1 $58,760 0 $0 0 $0 APPLICATIONS WITHDRAWN 5 $101,628 3 $68,940 1 $78,870 FILES CLOSED FOR INCOMPLETENESS 0 $0 0 $0 0 $0
Aggregated Statistics For Year 2005(Based on 4 full and 10 partial tracts) A) Conventional B) Refinancings C) Non-occupant Loans on Number Average Value Number Average Value Number Average Value
LOANS ORIGINATED 94 $68,602 46 $92,973 53 $62,344 APPLICATIONS APPROVED, NOT ACCEPTED 42 $124,224 28 $91,212 15 $69,851 APPLICATIONS DENIED 0 $0 0 $0 0 $0 APPLICATIONS WITHDRAWN 4 $49,740 7 $101,217 3 $89,977 FILES CLOSED FOR INCOMPLETENESS 2 $111,080 3 $98,113 2 $111,080
Aggregated Statistics For Year 2004(Based on 4 full and 10 partial tracts) A) Conventional B) Refinancings C) Non-occupant Loans on Number Average Value Number Average Value Number Average Value
LOANS ORIGINATED 116 $75,262 57 $88,495 66 $64,070 APPLICATIONS APPROVED, NOT ACCEPTED 34 $77,574 31 $85,887 29 $71,582 APPLICATIONS DENIED 4 $47,848 1 $111,490 3 $47,797 APPLICATIONS WITHDRAWN 5 $58,680 16 $94,641 4 $88,000 FILES CLOSED FOR INCOMPLETENESS 0 $0 2 $78,095 0 $0
Aggregated Statistics For Year 2003(Based on 4 full and 10 partial tracts) A) Conventional B) Refinancings C) Non-occupant Loans on Number Average Value Number Average Value Number Average Value
LOANS ORIGINATED 134 $76,547 94 $89,096 55 $61,713 APPLICATIONS APPROVED, NOT ACCEPTED 40 $91,714 55 $83,305 17 $72,621 APPLICATIONS DENIED 3 $106,610 2 $122,515 3 $106,610 APPLICATIONS WITHDRAWN 10 $82,720 8 $105,595 6 $78,530 FILES CLOSED FOR INCOMPLETENESS 0 $0 2 $95,500 0 $0
Aggregated Statistics For Year 2002(Based on 4 full and 10 partial tracts) A) Conventional B) Refinancings C) Non-occupant Loans on Number Average Value Number Average Value Number Average Value
LOANS ORIGINATED 147 $77,311 130 $88,537 65 $70,879 APPLICATIONS APPROVED, NOT ACCEPTED 45 $106,559 50 $82,469 32 $75,259 APPLICATIONS DENIED 9 $77,206 6 $109,760 4 $77,192 APPLICATIONS WITHDRAWN 9 $80,301 25 $95,030 9 $82,800 FILES CLOSED FOR INCOMPLETENESS 5 $145,438 8 $96,844 6 $77,875
Aggregated Statistics For Year 2001(Based on 4 full and 10 partial tracts) A) Conventional B) Refinancings C) Non-occupant Loans on Number Average Value Number Average Value Number Average Value
LOANS ORIGINATED 122 $71,227 98 $81,488 58 $66,687 APPLICATIONS APPROVED, NOT ACCEPTED 14 $62,409 32 $76,597 11 $61,141 APPLICATIONS DENIED 4 $60,040 4 $94,952 3 $62,010 APPLICATIONS WITHDRAWN 2 $68,160 1 $71,130 0 $0 FILES CLOSED FOR INCOMPLETENESS 1 $40,000 0 $0 0 $0
Aggregated Statistics For Year 2000(Based on 4 full and 10 partial tracts) A) Conventional B) Refinancings C) Non-occupant Loans on Number Average Value Number Average Value Number Average Value
LOANS ORIGINATED 100 $69,911 56 $72,260 57 $60,138 APPLICATIONS APPROVED, NOT ACCEPTED 12 $66,847 12 $83,799 9 $61,786 APPLICATIONS DENIED 3 $61,287 2 $84,620 2 $76,465 APPLICATIONS WITHDRAWN 0 $0 1 $83,280 0 $0 FILES CLOSED FOR INCOMPLETENESS 1 $127,580 0 $0 0 $0
Aggregated Statistics For Year 1999(Based on 3 full and 6 partial tracts) A) Conventional B) Refinancings C) Non-occupant Loans on Number Average Value Number Average Value Number Average Value
LOANS ORIGINATED 72 $68,670 26 $66,221 17 $63,784 APPLICATIONS APPROVED, NOT ACCEPTED 11 $108,002 7 $65,421 1 $80,490 APPLICATIONS DENIED 8 $59,715 3 $50,823 4 $51,370 APPLICATIONS WITHDRAWN 1 $85,470 2 $58,645 1 $61,280 FILES CLOSED FOR INCOMPLETENESS 4 $171,365 1 $47,580 0 $0
2002 - 2018 National Fire Incident Reporting System (NFIRS) incidents See full 2006 National Fire Incident Reporting System statistics for zip code 45205, Ohio
Most common first names in zip code 45205 among deceased individuals Name Count Lived (average)
John 246 72.7 years Mary 245 76.9 years William 218 73.5 years Robert 176 67.8 years Joseph 147 75.2 years Charles 145 74.7 years James 139 68.8 years Edward 137 73.7 years George 137 75.9 years Anna 125 80.5 years
Most common last names in zip code 45205 among deceased individuals Last name Count Lived (average)
Smith 66 70.7 years Johnson 50 68.7 years Miller 43 76.0 years Jones 40 70.6 years Davis 35 67.5 years Williams 29 74.2 years Wilson 27 71.5 years Meyer 25 77.0 years Taylor 24 70.0 years Moore 24 69.6 years
Businesses in zip code 45205
Name Count Name Count
AutoZone 1 McDonald's 1 Cricket Wireless 2 U-Haul 1 Domino's Pizza 1 Walgreens 1 H&R Block 1 White Castle 1 Kroger 1

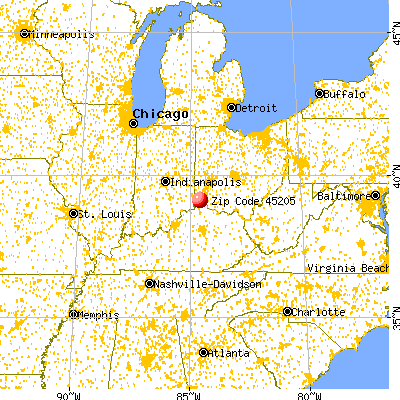

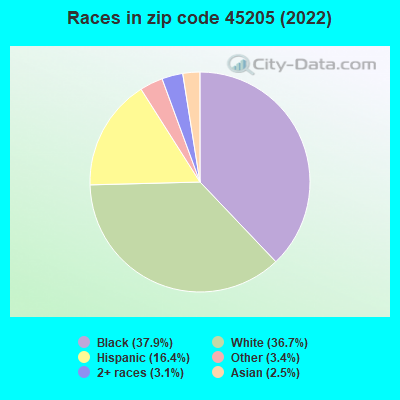


 Nearest zip codes: 45204, 41016, 45238, 45225, 45214, 45203.
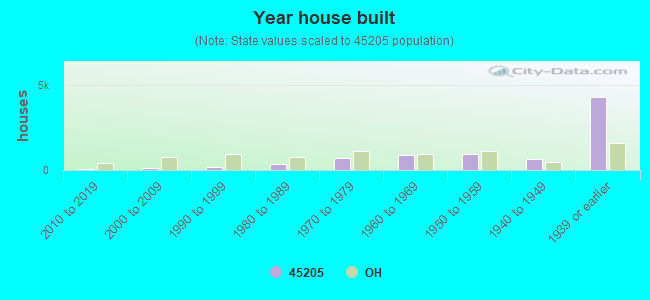

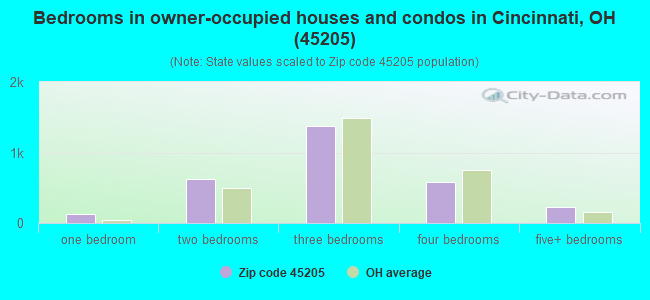
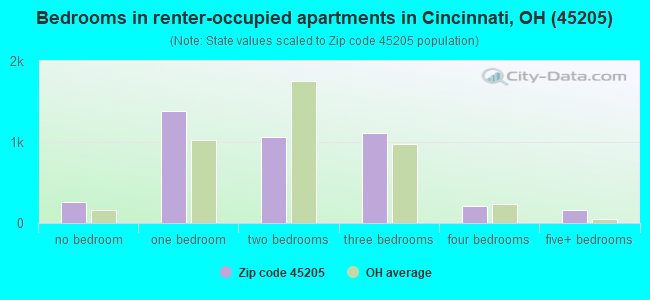
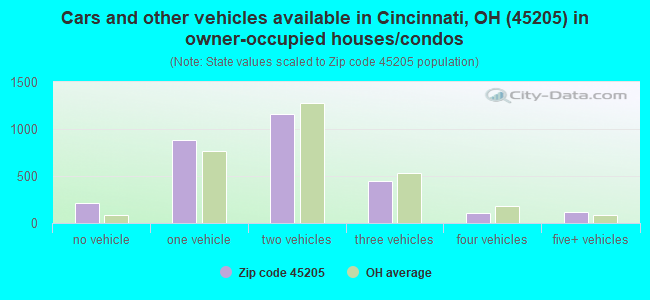


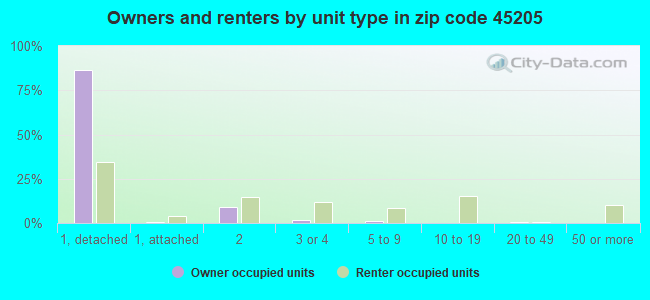
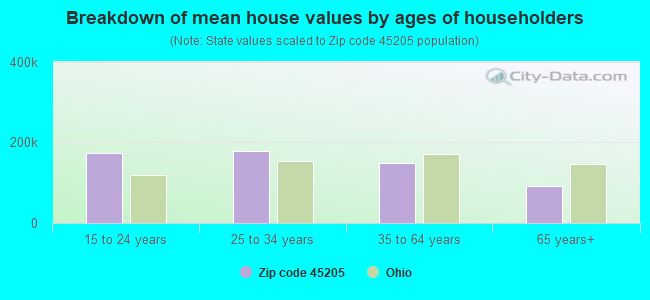


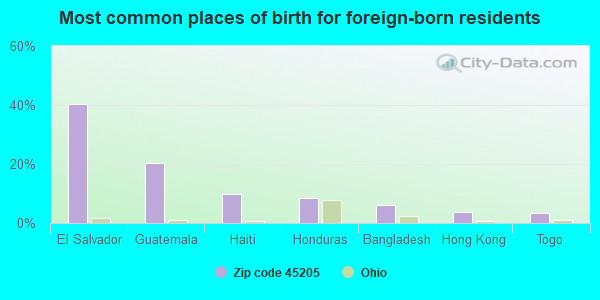
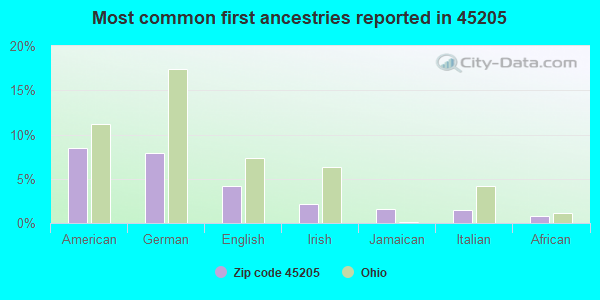
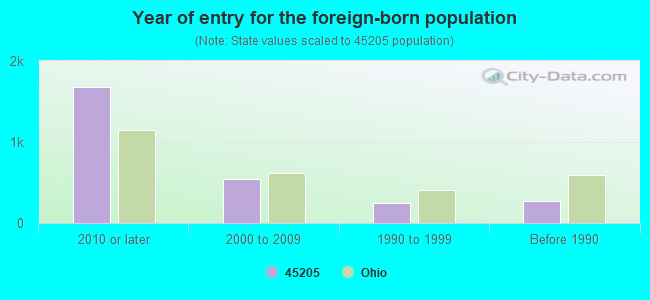


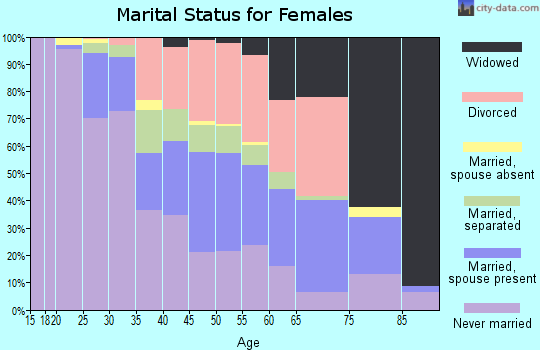
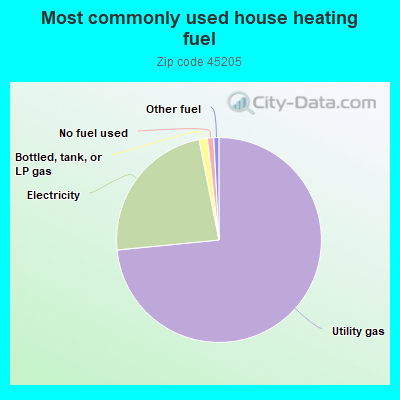
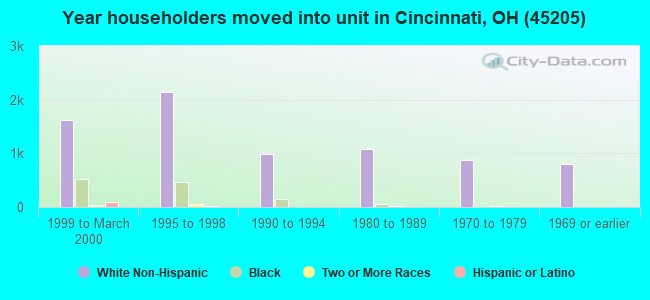
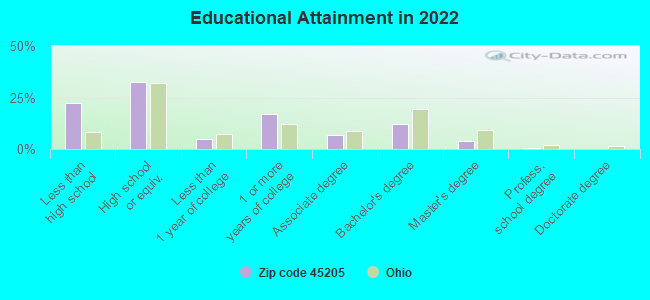
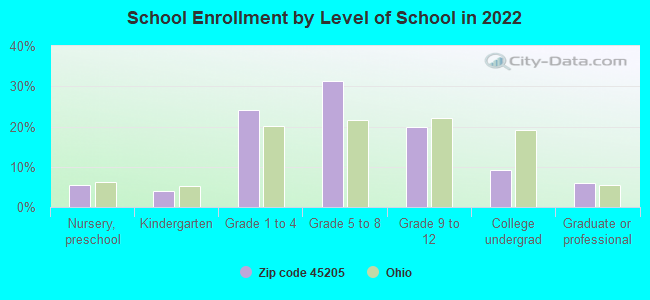
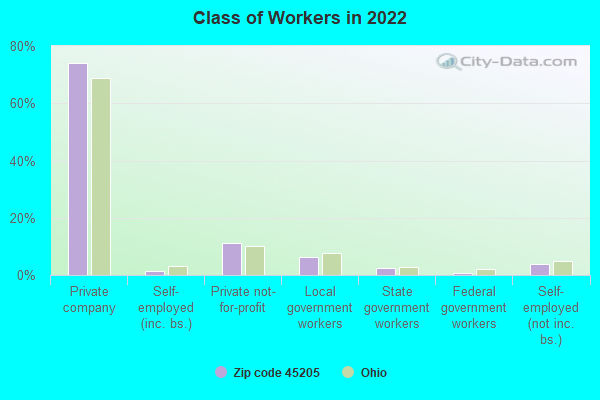
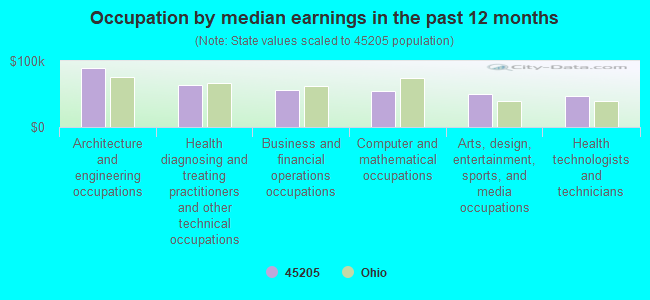
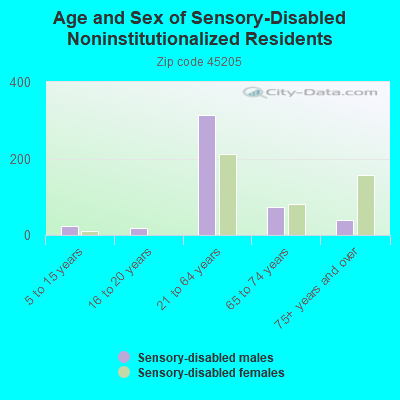
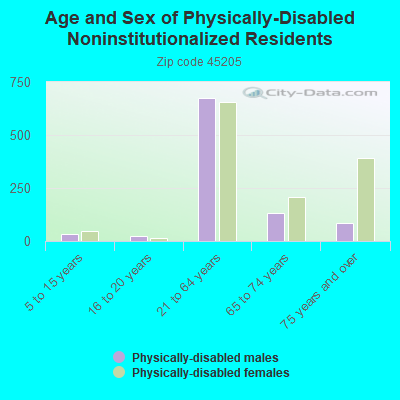
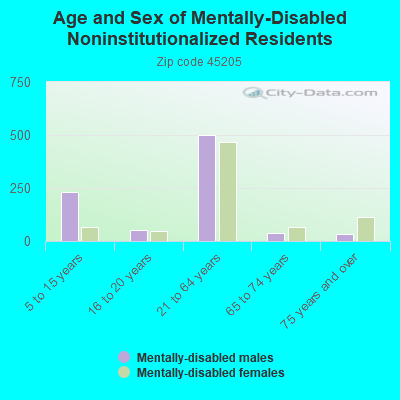
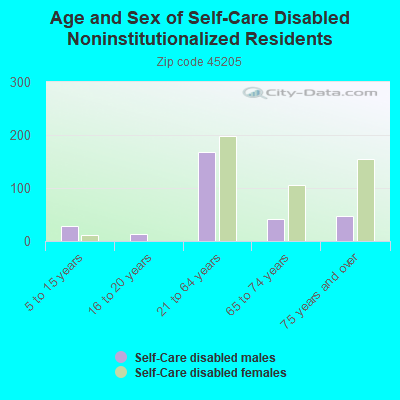
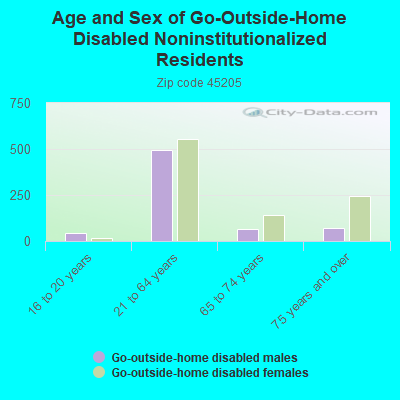
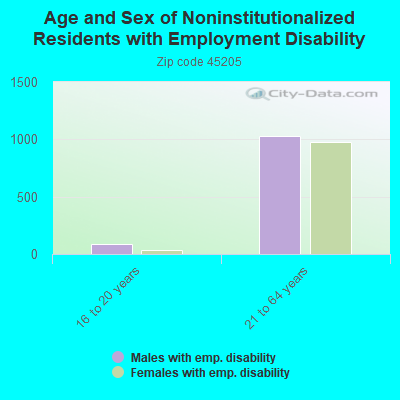
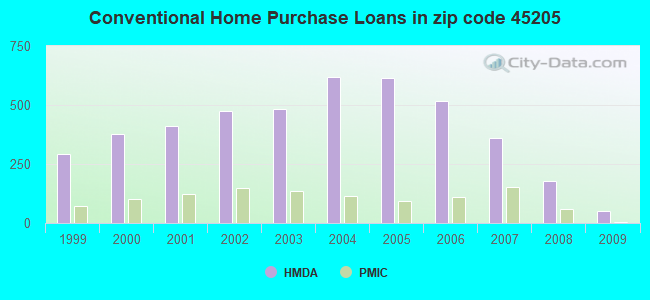
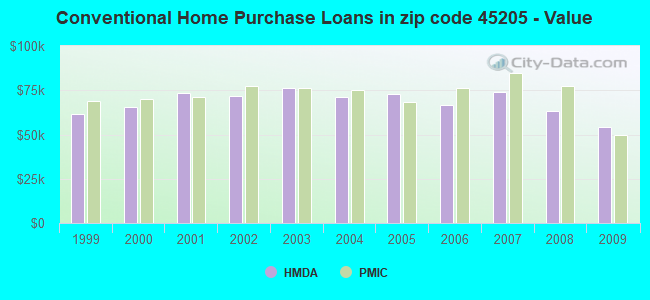
 Based on the data from the years 2002 - 2018 the average number of fire incidents per year is 106. The highest number of reported fires - 153 took place in 2007, and the least - 40 in 2002. The data has a growing trend.
 When looking into fire subcategories, the most reports belonged to: Structure Fires (38.2%), and Outside Fires (29.8%).