Estimated zip code population in 2022: 12,536 Zip code population in 2010: 12,360 Zip code population in 2000: 13,516
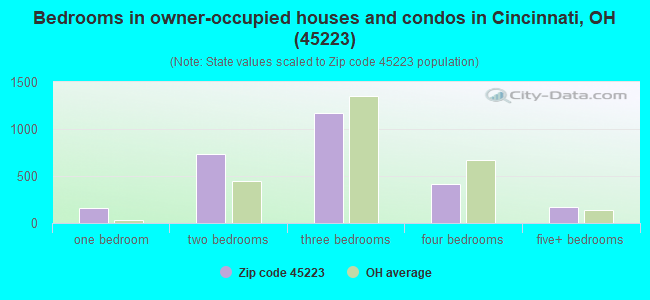
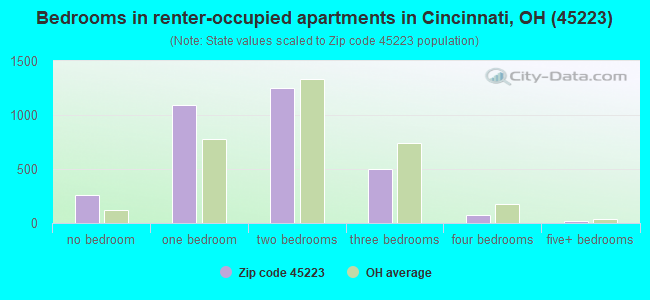
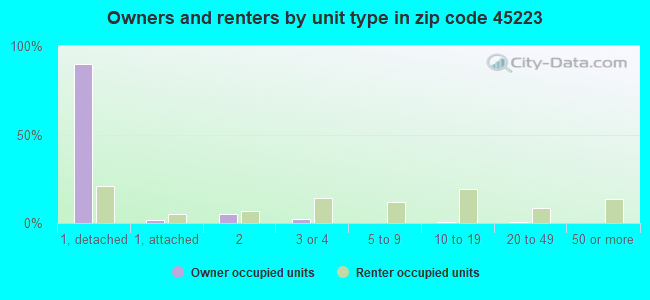
Houses and condos: 6,925 Renter-occupied apartments: 3,177
% of renters here:
55%
State:
33%
March 2022 cost of living index in zip code 45223: 88.9 (less than average, U.S. average is 100)
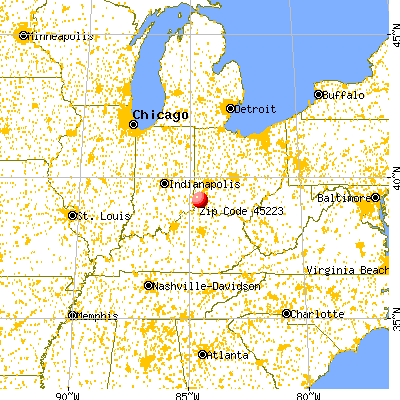
Land area: 5.8 sq. mi. Water area: 0.0 sq. mi.
Population density: 2,155 people per square mile
(low).
OSM Map
General Map
Google Map
MSN Map
OSM Map
General Map
Google Map
MSN Map
OSM Map
General Map
Google Map
MSN Map
OSM Map
General Map
Google Map
MSN Map
Please wait while loading the map...
Real estate property taxes paid for housing units in 2022:
This zip code:
1.1% ($2,441)
Ohio:
1.3% ($2,639)
Median real estate property taxes paid for housing units with mortgages in 2022: $2,641 (1.1%) Median real estate property taxes paid for housing units with no mortgage in 2022: $1,623 (1.2%)
Averages for the 2020 tax year for zip code 45223, filed in 2021:
Average Adjusted Gross Income (AGI) in 2020: $47,026 (Individual Income Tax Returns)
Here:
$47,026
State:
$67,288
Salary/wage: $42,174 (reported on 86.5% of returns)
Here:
$42,174
State:
$55,628
(% of AGI for various income ranges: 1135.2% for AGIs below $25k, 3712.8% for AGIs $25k-50k, 7019.2% for AGIs $50k-75k, 10345.0% for AGIs $75k-100k, 19332.3% for AGIs $100k-200k, 51010.0% for AGIs over 200k)
Taxable interest for individuals: $715 (reported on 17.3% of returns)
This zip code:
$715
Ohio:
$1,518
(% of AGI for various income ranges: 3.2% for AGIs below $25k, 7.1% for AGIs $25k-50k, 16.1% for AGIs $50k-75k, 26.5% for AGIs $75k-100k, 89.7% for AGIs $100k-200k, 354.0% for AGIs over 200k)
Ordinary dividends: $3,853 (reported on 14.6% of returns)
Here:
$3,853
State:
$7,167
(% of AGI for various income ranges: 14.2% for AGIs below $25k, 20.3% for AGIs $25k-50k, 65.9% for AGIs $50k-75k, 134.2% for AGIs $75k-100k, 312.7% for AGIs $100k-200k, 2584.0% for AGIs over 200k)
Net capital gain/loss in AGI: +$10,683 (reported on 12.2% of returns)
Here:
+$10,683
State:
+$18,919
(% of AGI for various income ranges: 8.0% for AGIs below $25k, 18.7% for AGIs $25k-50k, 79.5% for AGIs $50k-75k, 184.6% for AGIs $75k-100k, 550.7% for AGIs $100k-200k, 10540.0% for AGIs over 200k)
Profit/loss from business: +$12,033 (reported on 17.1% of returns)
Here:
+$12,033
State:
+$13,744
(% of AGI for various income ranges: 105.4% for AGIs below $25k, 159.7% for AGIs $25k-50k, 171.8% for AGIs $50k-75k, 600.4% for AGIs $75k-100k, 1079.7% for AGIs $100k-200k, 5350.0% for AGIs over 200k)
Taxable individual retirement arrangement distribution: $17,044 (reported on 4.2% of returns)
45223:
$17,044
Ohio:
$18,876
(% of AGI for various income ranges: 21.2% for AGIs below $25k, 27.2% for AGIs $25k-50k, 104.3% for AGIs $50k-75k, 387.3% for AGIs $75k-100k, 469.0% for AGIs $100k-200k, 1400.0% for AGIs over 200k)
Self-employed (Keogh) retirement plans: $17,900 (reported on 0.6% of returns)
45223:
$17,900
Ohio:
$24,898
(% of AGI for various income ranges: 238.7% for AGIs $100k-200k)
Total itemized deductions: $23,942 (reported on 3.8% of returns)
Here:
$23,942
State:
$33,869
(% of AGI for various income ranges: 56.0% for AGIs $25k-50k, 126.4% for AGIs $50k-75k, 428.5% for AGIs $75k-100k, 641.0% for AGIs $100k-200k, 2208.0% for AGIs over 200k)
Charity contributions: $6,575 (reported on 2.5% of returns)
Here:
$6,575
State:
$14,577
(% of AGI for various income ranges: 3.4% for AGIs below $25k, 21.0% for AGIs $50k-75k, 71.2% for AGIs $75k-100k, 101.3% for AGIs $100k-200k, 728.0% for AGIs over 200k)
Taxes paid: $6,754 (reported on 3.8% of returns)
45223:
$6,754
State:
$7,681
(% of AGI for various income ranges: 7.2% for AGIs $25k-50k, 35.7% for AGIs $50k-75k, 107.7% for AGIs $75k-100k, 220.7% for AGIs $100k-200k, 706.0% for AGIs over 200k)
Earned income credit: $2,508 (reported on 25.9% of returns)
Here:
$2,508
State:
$2,304
(% of AGI for various income ranges: 148.4% for AGIs below $25k, 68.5% for AGIs $25k-50k)
Percentage of individuals using paid preparers for their 2020 taxes: 93.9%
Here:
94%
State:
94%
(% for various income ranges: 93.1% for AGIs below $25k, 95.2% for AGIs $25k-50k, 92.9% for AGIs $50k-75k, 92.7% for AGIs $75k-100k, 94.4% for AGIs $100k-200k, 100.0% for AGIs over 200k)
Averages for the 2012 tax year for zip code 45223, filed in 2013:
Average Adjusted Gross Income (AGI) in 2012: $32,967 (Individual Income Tax Returns)
Here:
$32,967
State:
$54,926
Salary/wage: $30,090 (reported on 88.0% of returns)
Here:
$30,090
State:
$45,869
(% of AGI for various income ranges: 79.9% for AGIs below $25k, 87.9% for AGIs $25k-50k, 83.0% for AGIs $50k-75k, 85.0% for AGIs $75k-100k, 74.3% for AGIs $100k-200k, 52.1% for AGIs over 200k)
Taxable interest for individuals: $611 (reported on 15.9% of returns)
This zip code:
$611
Ohio:
$1,297
(% of AGI for various income ranges: 0.2% for AGIs below $25k, 0.3% for AGIs $25k-50k, 0.2% for AGIs $50k-75k, 0.3% for AGIs $75k-100k, 0.7% for AGIs $100k-200k, 0.2% for AGIs over 200k)
Ordinary dividends: $3,173 (reported on 12.3% of returns)
Here:
$3,173
State:
$5,821
(% of AGI for various income ranges: 0.5% for AGIs below $25k, 0.6% for AGIs $25k-50k, 1.0% for AGIs $50k-75k, 1.0% for AGIs $75k-100k, 3.4% for AGIs $100k-200k, 2.2% for AGIs over 200k)
Net capital gain/loss in AGI: +$4,051 (reported on 7.5% of returns)
Here:
+$4,051
State:
+$11,232
(% of AGI for various income ranges: 0.2% for AGIs $25k-50k, 1.0% for AGIs $50k-75k, 0.7% for AGIs $75k-100k, 3.7% for AGIs $100k-200k, 0.8% for AGIs over 200k)
Profit/loss from business: +$8,771 (reported on 16.1% of returns)
Here:
+$8,771
State:
+$12,773
(% of AGI for various income ranges: 12.0% for AGIs below $25k, 2.2% for AGIs $25k-50k, 1.7% for AGIs $50k-75k, 2.6% for AGIs $75k-100k, 3.7% for AGIs $100k-200k)
Taxable individual retirement arrangement distribution: $13,300 (reported on 4.7% of returns)
45223:
$13,300
Ohio:
$14,511
(% of AGI for various income ranges: 0.7% for AGIs below $25k, 1.1% for AGIs $25k-50k, 1.9% for AGIs $50k-75k, 1.9% for AGIs $75k-100k, 6.1% for AGIs $100k-200k)
Self-employment retirement plans: $16,500 (reported on 0.3% of returns)
45223:
$16,500
Ohio:
$20,257
(% of AGI for various income ranges: 0.8% for AGIs below $25k)
Total itemized deductions: $15,376 (20% of AGI, reported on 17.2% of returns)
Here:
$15,376
State:
$21,278
Here:
19.6% of AGI
State:
18.8% of AGI
(% of AGI for various income ranges: 2.5% for AGIs below $25k, 5.3% for AGIs $25k-50k, 9.2% for AGIs $50k-75k, 11.7% for AGIs $75k-100k, 14.0% for AGIs $100k-200k, 14.2% for AGIs over 200k)
Charity contributions: $2,447 (reported on 12.5% of returns)
Here:
$2,447
State:
$3,943
(% of AGI for various income ranges: 0.2% for AGIs below $25k, 0.5% for AGIs $25k-50k, 1.1% for AGIs $50k-75k, 1.5% for AGIs $75k-100k, 1.7% for AGIs $100k-200k, 1.7% for AGIs over 200k)
Taxes paid: $6,442 (reported on 17.0% of returns)
45223:
$6,442
State:
$9,568
(% of AGI for various income ranges: 0.7% for AGIs below $25k, 1.7% for AGIs $25k-50k, 3.7% for AGIs $50k-75k, 4.9% for AGIs $75k-100k, 6.8% for AGIs $100k-200k, 7.0% for AGIs over 200k)
Earned income credit: $2,635 (reported on 36.0% of returns)
Here:
$2,635
State:
$2,285
(% of AGI for various income ranges: 11.9% for AGIs below $25k, 1.2% for AGIs $25k-50k)
Percentage of individuals using paid preparers for their 2012 taxes: 40.2%
Here:
40%
State:
51%
(% for various income ranges: 39.0% for AGIs below $25k, 38.3% for AGIs $25k-50k, 42.1% for AGIs $50k-75k, 50.0% for AGIs $75k-100k, 50.0% for AGIs $100k-200k, 75.0% for AGIs over 200k)
Averages for the 2004 tax year for zip code 45223, filed in 2005:
Average Adjusted Gross Income (AGI) in 2004: $26,713 (Individual Income Tax Returns)
Here:
$26,713
State:
$44,480
Salary/wage: $24,703 (reported on 91.3% of returns)
Here:
$24,703
State:
$39,198
(% of AGI for various income ranges: 96.1% for AGIs below $10k, 90.0% for AGIs $10k-25k, 89.6% for AGIs $25k-50k, 86.8% for AGIs $50k-75k, 82.5% for AGIs $75k-100k, 59.3% for AGIs over 100k)
Taxable interest for individuals: $862 (reported on 20.5% of returns)
This zip code:
$862
Ohio:
$1,532
(% of AGI for various income ranges: 1.2% for AGIs below $10k, 0.4% for AGIs $10k-25k, 0.7% for AGIs $25k-50k, 0.5% for AGIs $50k-75k, 0.9% for AGIs $75k-100k, 0.8% for AGIs over 100k)
Taxable dividends: $2,722 (reported on 11.9% of returns)
Here:
$2,722
State:
$3,496
(% of AGI for various income ranges: 1.2% for AGIs below $10k, 0.4% for AGIs $10k-25k, 0.6% for AGIs $25k-50k, 1.1% for AGIs $50k-75k, 2.7% for AGIs $75k-100k, 3.3% for AGIs over 100k)
Net capital gain/loss: +$5,577 (reported on 7.6% of returns)
Here:
+$5,577
State:
+$8,582
(% of AGI for various income ranges: -0.3% for AGIs below $10k, 0.3% for AGIs $10k-25k, 0.3% for AGIs $25k-50k, 0.9% for AGIs $50k-75k, 2.0% for AGIs $75k-100k, 7.5% for AGIs over 100k)
Profit/loss from business: +$9,489 (reported on 11.3% of returns)
Here:
+$9,489
State:
+$10,813
(% of AGI for various income ranges: 9.6% for AGIs below $10k, 3.7% for AGIs $10k-25k, 2.2% for AGIs $25k-50k, 2.4% for AGIs $50k-75k, 3.8% for AGIs $75k-100k, 8.6% for AGIs over 100k)
IRA payment deduction: $1,652 (reported on 1.6% of returns)
45223:
$1,652
Ohio:
$2,794
Self-employed pension: $9,667 (reported on 0.4% of returns)
Here:
$9,667
Ohio:
$13,981
Total itemized deductions: $13,690 (22% of AGI, reported on 18.5% of returns)
Here:
$13,690
State:
$17,503
Here:
22.4% of AGI
State:
20.8% of AGI
(% of AGI for various income ranges: 3.7% for AGIs below $10k, 3.8% for AGIs $10k-25k, 8.3% for AGIs $25k-50k, 12.6% for AGIs $50k-75k, 16.7% for AGIs $75k-100k, 15.6% for AGIs over 100k)
Charity contributions deductions: $2,601 (4% of AGI, reported on 14.7% of returns)
Here:
$2,601
State:
$3,087
Here:
3.9% of AGI
State:
3.4% of AGI
(% of AGI for various income ranges: 0.3% for AGIs below $10k, 0.3% for AGIs $10k-25k, 1.1% for AGIs $25k-50k, 1.8% for AGIs $50k-75k, 2.6% for AGIs $75k-100k, 3.2% for AGIs over 100k)
Total tax: $3,944 (reported on 59.8% of returns)
45223:
$3,944
State:
$6,781
(% of AGI for various income ranges: 2.1% for AGIs below $10k, 3.3% for AGIs $10k-25k, 7.5% for AGIs $25k-50k, 10.8% for AGIs $50k-75k, 12.2% for AGIs $75k-100k, 18.7% for AGIs over 100k)
Earned income credit: $2,017 (reported on 37.4% of returns)
Here:
$2,017
State:
$1,696
Percentage of individuals using paid preparers for their 2004 taxes: 54.9%
Here:
55%
State:
55%
(% for various income ranges: 53.1% for AGIs below $10k, 61.3% for AGIs $10k-25k, 49.6% for AGIs $25k-50k, 49.6% for AGIs $50k-75k, 46.3% for AGIs $75k-100k, 65.4% for AGIs over 100k)
Likely homosexual households (counted as self-reported same-sex unmarried-partner households)
Lesbian couples: 0.1% of all households
Gay men: 0.3% of all households
Household received Food Stamps/SNAP in the past 12 months: 1,354 Household did not receive Food Stamps/SNAP in the past 12 months: 4,515
Women who had a birth in the past 12 months: 324 (68 now married, 247 unmarried) Women who did not have a birth in the past 12 months: 3,032 (851 now married, 2,182 unmarried)
Housing units in zip code 45223 with a mortgage: 1,906 (298 second mortgage, 13 home equity loan, 278 both second mortgage and home equity loan) Houses without a mortgage: 36
Median monthly owner costs for units with a mortgage: $1,317 Median monthly owner costs for units without a mortgage: $543
Residents with income below the poverty level in 2022:
This zip code:
24.9%
Whole state:
13.4%
Residents with income below 50% of the poverty level in 2022:
This zip code:
10.5%
Whole state:
7.0%
Median number of rooms in houses and condos:
Here:
6.3
State:
6.7
Median number of rooms in apartments:
Here:
3.9
State:
4.4
Notable locations in this zip code not listed on our city pages
Notable locations in zip code 45223: Hamilton County Dog Pound (A), Cincinnati Fire Department Engine and Truck 20 (B), Number 20 Engine House (C), McKie Community Center (D). Display/hide their locations on the map
Churches in zip code 45223 include: Marbly Memorial United Methodist Church (A), True Unity Baptist Church (B), Greater Bethel Apostolic Church (C), First United Church of Christ (D), First Pentecostal Apostolic Church (E), Northside Christian Church (F), North Presbyterian Church (G), Immanuel Baptist Church (H), Wesleyan Bible Holiness Chapel (I). Display/hide their locations on the map
Parks in zip code 45223 include: Ludlow Monument (1), Blue Rock Oval (2), Hoffner Historic District (3), Jacob Hoffner Park (4), Hille Playground (5), Wayne Playground (6), Felter Park (7). Display/hide their locations on the map
1,052 married couples with children.
1,945 single-parent households (427 men, 1,518 women).
94.8% of residents of 45223 zip code speak English at home.
2.1% of residents speak Spanish at home (50% very well, 50% not at all).
1.9% of residents speak other Indo-European language at home (68% very well, 32% well).
0.6% of residents speak Asian or Pacific Island language at home (79% very well, 21% well).
0.1% of residents speak other language at home (100% very well).
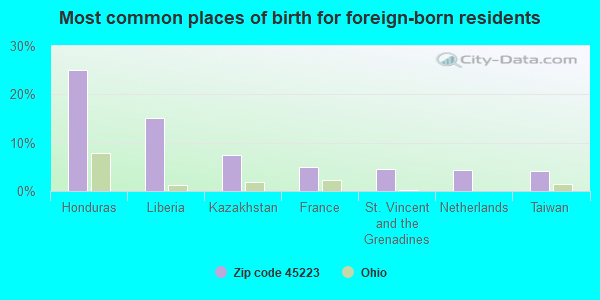
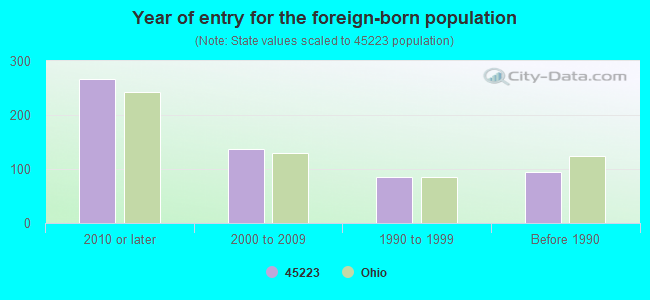
Foreign born population: 475 (3.8%) (58.0% of them are naturalized citizens)
Facilities with environmental interests located in this zip code:
BP OIL NO 09028 (3949 SPRING GROVE AVE in CINCINNATI, OH)
STATE MASTER (Ohio general info) - AIR MAJOR STATE MASTER (Ohio general info) - -31-5541-1038-P, EPCRA, RCRA-OHD987028917, HAZARDOUS WASTE PROGRAM Conditionally Exempt Small Quantity Generators, less than 100 kg/month of hazardous waste (Resource Conservation and Recovery Act (tracking hazardous waste)) - notification Organizations: BP OIL CO (CONTACT/OWNER)
, BP OIL COMPANY (CONTACT/OWNER)
Alternative names: BP OIL CO SITE 09028, BP OIL SITE NO 09028
BARREL & DRUM SERVICE INC (1728 POWERS STREET in CINCINNATI, OH)
AIR MINOR (AIRS/AFS) STATE MASTER (Ohio general info) - PCS-,, National Pollutant Discharge Elimination System Permit, AIR MAJOR, RCRA-OHD017611187, HAZARDOUS WASTE PROGRAM HAZARDOUS WASTE BIENNIAL REPORTER (Resource Conservation and Recovery Act (tracking hazardous waste)) (Resource Conservation and Recovery Act (tracking hazardous waste)) Business SIC classification: MANUFACTURING INDUSTRIES Organizations: RONALD A KORMAN (CONTACT/OWNER)
CF INDUSTRIES CINCINNATI WAREHOUSE (5125 RIVER ROAD in CINCINNATI, OH)
AIR MINOR (AIRS/AFS) STATE MASTER (Ohio general info) - EPCRA, RCRA-OHT400011326, HAZARDOUS WASTE PROGRAM Conditionally Exempt Small Quantity Generators, less than 100 kg/month of hazardous waste (Resource Conservation and Recovery Act (tracking hazardous waste)) - notification Business SIC classification: FARM SUPPLIES Alternative names: C F INDUSTRIES, CF INDUSTRIES INC
ART WOODWORKING & MFG CO INC (4238 DANE STREET in CINCINNATI, OH)
AIR SYNTHETIC MINOR (AIRS/AFS) STATE MASTER (Ohio general info) - AIR MAJOR, RCRA-OHD004252714, HAZARDOUS WASTE PROGRAM Conditionally Exempt Small Quantity Generators, less than 100 kg/month of hazardous waste (Resource Conservation and Recovery Act (tracking hazardous waste)) - notification Business SIC classification: WOOD OFFICE AND STORE FIXTURES, PARTITIONS, SHELVING, AND LOCKERS Organizations: DICKMAN RAYMOND (CONTACT/OWNER)
, ART WOODWORKING & MANUFACTURIN (CONTACT/OWNER)
BERNARD LABORATORIES INC (1738 TOWNSEND STREET in CINCINNATI, OH)
STATE MASTER (Ohio general info) - AIR MAJOR Conditionally Exempt Small Quantity Generators, less than 100 kg/month of hazardous waste (Resource Conservation and Recovery Act (tracking hazardous waste)) - notification Organizations: BOYD J PIPER JR (CONTACT/OWNER)
, PIPER BOYD J JR (CONTACT/OWNER)
ARMOR METAL FABRICATION (3408 BEEKMAN ST in CINCINNATI, OH)
STATE MASTER (Ohio general info) - RCRA-OHD987007341, HAZARDOUS WASTE PROGRAM, AIR MAJOR Conditionally Exempt Small Quantity Generators, less than 100 kg/month of hazardous waste (Resource Conservation and Recovery Act (tracking hazardous waste)) - notification Organizations: DAVID SCHMITT (CONTACT/OWNER)
BP OIL NO 09070 (3100 READING RD in CINCINNATI, OH)
STATE MASTER (Ohio general info) - AIR MAJOR, -315541-1038-GG, EPCRA, RCRA-OHD987028263, HAZARDOUS WASTE PROGRAM Conditionally Exempt Small Quantity Generators, less than 100 kg/month of hazardous waste (Resource Conservation and Recovery Act (tracking hazardous waste)) - notification Organizations: BP OIL CO (CONTACT/OWNER)
, BP OIL COMPANY (CONTACT/OWNER)
Alternative names: BP OIL CO SITE 09070
CHASE QUALITY DRYCLEANERS (4203 HAMILTON AVE in CINCINNATI, OH)
STATE MASTER (Ohio general info) - AIR MAJOR Small Quantity Generators, between 100 kg and 1000 kg of hazardous waste/month (Resource Conservation and Recovery Act (tracking hazardous waste)) - notification Organizations: BLESSING TONY (CONTACT/OWNER)
Alternative names: CHASE CLEANERS
CHASE ELEMENTARY SCHOOL (4151 TURRILL ST in CINCINNATI, OH)
(Geographic Names Information System) (National Center for Education Statistics) - STATE ID-006015 Organizations: CINCINNATI CITY SD (SCHOOL DISTRICT)
Housing units lacking complete plumbing facilities: 3.7% Housing units lacking complete kitchen facilities: 4.0%
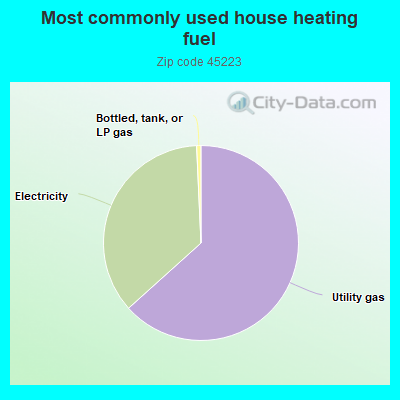
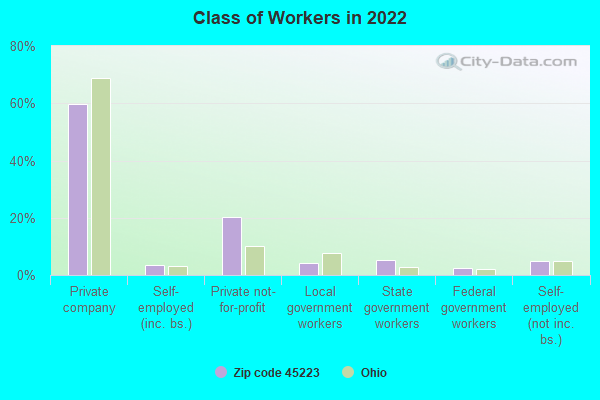
62.7%Utility gas
35.6%Electricity
0.7%Bottled, tank, or LP gas
Population in 1990: 15,639.
Place of birth for U.S.-born residents:
This state: 9,131
Northeast: 517
Midwest: 817
South: 1,132
West: 349
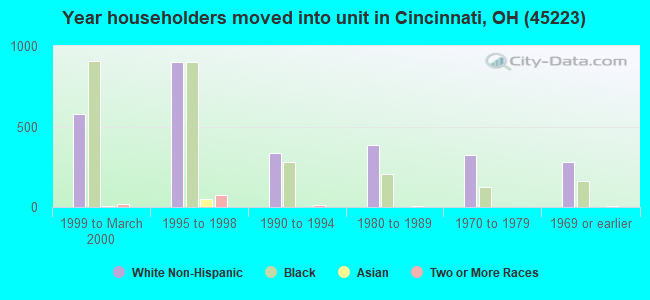
41% of the 45223 zip code residents lived in the same house 5 years ago. Out of people who lived in different houses, 86% lived in this county. Out of people who lived in different counties, 50% lived in Ohio.
88% of the 45223 zip code residents lived in the same house 1 year ago. Out of people who lived in different houses, 65% moved from this county. Out of people who lived in different houses, 6% moved from different county within same state. Out of people who lived in different houses, 25% moved from different state.
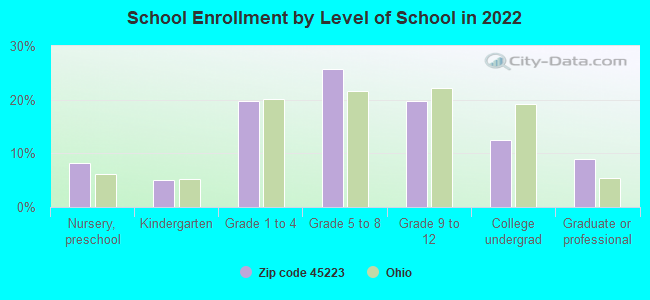
Private vs. public school enrollment:
Students in private schools in grades 1 to 8 (elementary and middle school): 287
Here:
19.6%
Ohio:
16.0%
Students in private schools in grades 9 to 12 (high school): 126
Here:
19.9%
Ohio:
13.1%
Students in private undergraduate colleges: 124
Here:
31.0%
Ohio:
22.3%
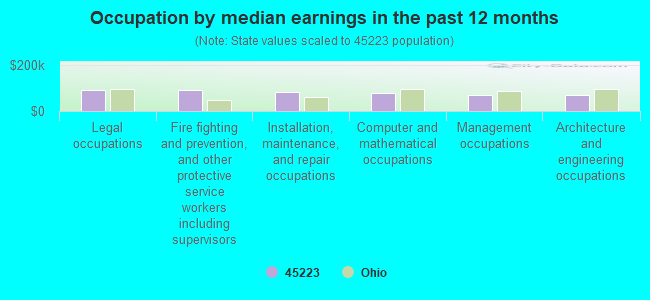
Occupation by median earnings in the past 12 months ($)
91,015Legal occupations
89,154Fire fighting and prevention, and other protective service workers including supervisors
82,881Installation, maintenance, and repair occupations
76,688Computer and mathematical occupations
71,291Management occupations
70,387Architecture and engineering occupations
Companies with federal contracts located in this zip code (CINCINNATI, OH):
CASTELLINI COMPANY (INC) (1755 DREMAN AVE; small business) : $3,629,468 in 112 contractsfrom 1999 to 2000
Contracts for Fruits and Vegetables, Sugar, Confectionery, and Nuts by Defense Logistics Agency Signed by year:2000: $2,684,844; 2001: $0; 2002: $0; 2003: $0; 2004: $0; 2005: $0; 2006: $0.
Biggest contracts:
$61,560 with Defense Logistics Agency for Fruits and Vegetables. Taking place in KY. Signed on 2000-07-01. Completion date: 2000-07-01.
$52,229, same as above.Signed on 2000-06-10. Completion date: 2000-06-10.
$51,959, same as above.Signed on 2000-06-03. Completion date: 2000-06-03.
$48,868, same as above.Signed on 2000-06-24. Completion date: 2000-06-24.
SPECTRAL ENERGETICS INC (4230 BROOKSIDE AVE; small business) : $796,133 in 2 contractsin 2005
$399,987 with Navy for Biomedical -- Basic Research (R&D). Signed on 2005-06-30. Completion date: 2005-06-29.
$396,146, same as above.Signed on 2005-06-30. Completion date: 2005-06-29.
KING BAG & MANUFACTURING COMPA (1500 SPRING LAWN AVE; small business) 50 employees, $0 revenue: $323,804 in 20 contractsfrom 2002 to 2006
Contracts for Aircraft Ground Servicing Equipment, Maintenance, Repair and Rebuilding of Equipment -- Engine Accessories, Gas Turbines and Jet Engines, Aircraft; Prime Moving, and Components, Bags and Sacks, and moreby Air Force, U.S. Army Corps of Engineers - civil program financing only, Army, Defense Logistics Agency, and others Signed by year:2000: $0; 2001: $0; 2002: $25,115; 2003: $8,488; 2004: $29,435; 2005: $221,076; 2006: $39,690.
Biggest contracts:
$80,760 with Air Force for Aircraft Ground Servicing Equipment. Signed on 2005-03-31. Completion date: 2006-05-31.
$41,018 with Air Force for Maintenance, Repair and Rebuilding of Equipment -- Engine Accessories. Signed on 2005-09-21. Completion date: 2005-10-27.
$38,793 with Air Force for Gas Turbines and Jet Engines, Aircraft; Prime Moving, and Components. Signed on 2005-02-15. Completion date: 2005-05-12.
$25,115 with Air Force for Bags and Sacks. Signed on 2002-11-13. Completion date: 2003-02-15.
THE F D LAWRENCE ELECTRIC CO (3450 BEEKMAN ST; small business) : $70,581 in 10 contractsfrom 2000 to 2006
Contracts for Electrical Control Equipment, Circuit Breakers, Coils and Transformers by Defense Logistics Agency Signed by year:2000: $30,225; 2001: $0; 2002: $0; 2003: $0; 2004: $3,155; 2005: $26,451; 2006: $10,750.
Biggest contracts:
$30,225 with Defense Logistics Agency for Electrical Control Equipment. Signed on 2000-08-15. Completion date: 2000-12-13.
$10,750, same as above.Signed on 2006-03-30. Completion date: 2006-05-29.
$10,635 with Defense Logistics Agency for Circuit Breakers. Signed on 2005-04-11. Completion date: 2005-06-07.
$7,861, same as above.Signed on 2005-04-20. Completion date: 2005-06-27.
C W WOOD MACHINERY INC (3290 BEEKMAN ST; small business) : $43,050 in 4 contractsfrom 2004 to 2005
$29,450 with Army for Mechanical Presses, Power Driven. Signed on 2004-09-30. Completion date: 2004-10-29.
$9,950, same as above.Signed on 2004-09-29. Completion date: 2004-10-18.
$3,200 with Army for Drilling and Tapping Machines. Signed on 2005-09-12. Completion date: 2005-09-19.
$450 with Army for Miscellaneous Special Industry Machinery. Signed on 2004-09-30. Completion date: 2004-10-29.
AURAND MANUFACTURING & EQUIPME (1210 ELLIS ST; small business)
$4,123 with Army for Machine Tool Accessories. Taking place in NC. Signed on 2005-07-06. Completion date: 2005-07-11.
Top industries in this zip code by the number of employees in 2005:
2002 - 2018 National Fire Incident Reporting System (NFIRS) incidents
Based on the data from the years 2002 - 2018 the average number of fires per year is 72. The highest number of fire incidents - 101 took place in 2010, and the least - 31 in 2002. The data has a rising trend.
When looking into fire subcategories, the most reports belonged to: Structure Fires (37.3%), and Outside Fires (24.5%).
Fire incident types reported to NFIRS in Zip Code 45223


 Nearest zip codes: 45225, 45224, 45220, 45232, 45239, 45211.


 Based on the data from the years 2002 - 2018 the average number of fires per year is 72. The highest number of fire incidents - 101 took place in 2010, and the least - 31 in 2002. The data has a rising trend.
 When looking into fire subcategories, the most reports belonged to: Structure Fires (37.3%), and Outside Fires (24.5%).