Estimated zip code population in 2022: 29,459 Zip code population in 2010: 28,315 Zip code population in 2000: 29,008
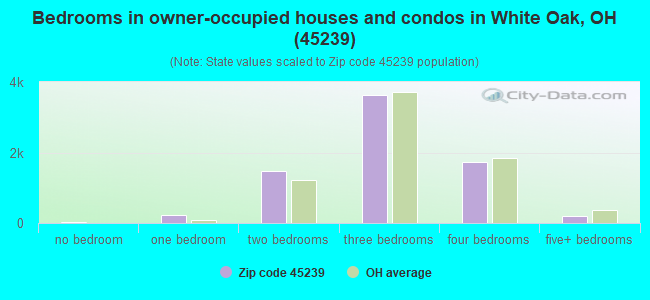
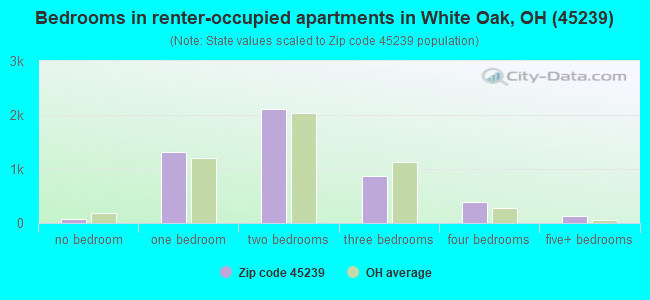
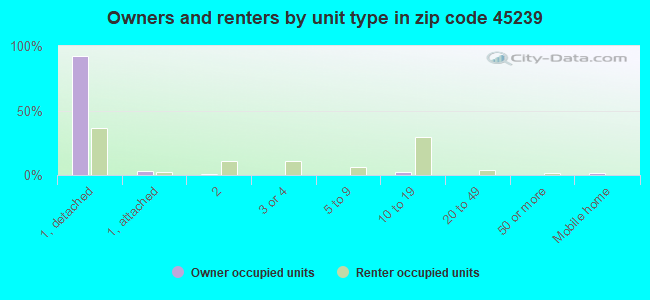
Houses and condos: 13,013 Renter-occupied apartments: 4,882
% of renters here:
40%
State:
33%
March 2022 cost of living index in zip code 45239: 87.9 (less than average, U.S. average is 100)
Land area: 6.3 sq. mi. Water area: 0.0 sq. mi.
Population density: 4,652 people per square mile
(average).
OSM Map
General Map
Google Map
MSN Map
OSM Map
General Map
Google Map
MSN Map
OSM Map
General Map
Google Map
MSN Map
OSM Map
General Map
Google Map
MSN Map
Please wait while loading the map...
Real estate property taxes paid for housing units in 2022:
This zip code:
1.4% ($2,265)
Ohio:
1.3% ($2,639)
Median real estate property taxes paid for housing units with mortgages in 2022: $2,331 (1.4%) Median real estate property taxes paid for housing units with no mortgage in 2022: $2,098 (1.6%)
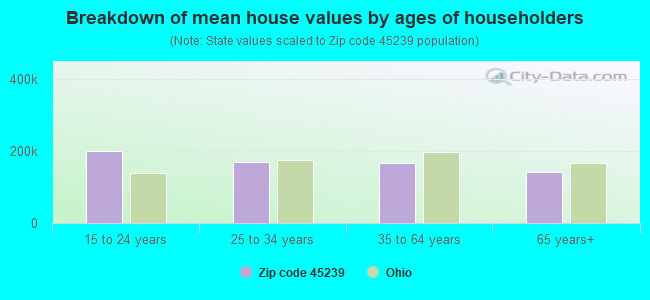
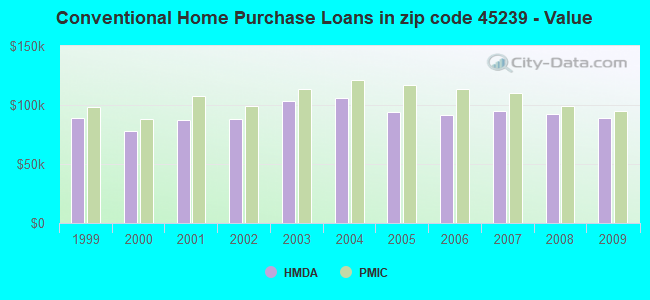
Estimated median house/condo value in 2022: $157,445
45239:
$157,445
Ohio:
$204,100
According to our research of Ohio and other state lists, there were 40 registered sex offenders living in 45239 zip code as of April 27, 2024. The ratio of all residents to sex offenders in zip code 45239 is 717 to 1. The ratio of registered sex offenders to all residents in this zip code is lower than the state average.
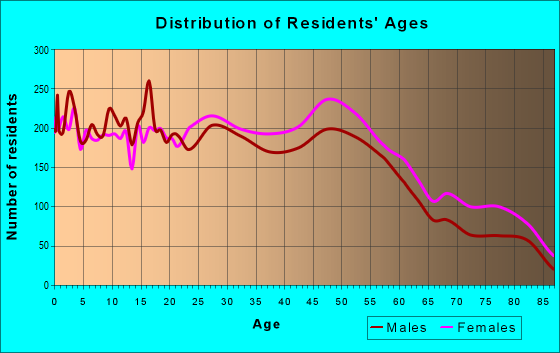
Median resident age:
This zip code:
34.6 years
Ohio median age:
39.9 years
Average household size:
This zip code:
2.4 people
Ohio:
2.4 people
Averages for the 2020 tax year for zip code 45239, filed in 2021:
Average Adjusted Gross Income (AGI) in 2020: $45,140 (Individual Income Tax Returns)
Here:
$45,140
State:
$67,288
Salary/wage: $40,881 (reported on 85.5% of returns)
Here:
$40,881
State:
$55,628
(% of AGI for various income ranges: 1226.6% for AGIs below $25k, 3750.7% for AGIs $25k-50k, 6943.6% for AGIs $50k-75k, 10137.7% for AGIs $75k-100k, 16395.8% for AGIs $100k-200k, 56086.7% for AGIs over 200k)
Taxable interest for individuals: $816 (reported on 17.6% of returns)
This zip code:
$816
Ohio:
$1,518
(% of AGI for various income ranges: 8.3% for AGIs below $25k, 9.2% for AGIs $25k-50k, 23.0% for AGIs $50k-75k, 35.0% for AGIs $75k-100k, 89.2% for AGIs $100k-200k, 630.0% for AGIs over 200k)
Ordinary dividends: $4,184 (reported on 14.0% of returns)
Here:
$4,184
State:
$7,167
(% of AGI for various income ranges: 22.7% for AGIs below $25k, 27.3% for AGIs $25k-50k, 92.6% for AGIs $50k-75k, 122.1% for AGIs $75k-100k, 524.4% for AGIs $100k-200k, 2660.0% for AGIs over 200k)
Net capital gain/loss in AGI: +$6,136 (reported on 10.2% of returns)
Here:
+$6,136
State:
+$18,919
(% of AGI for various income ranges: 5.8% for AGIs below $25k, 16.5% for AGIs $25k-50k, 77.0% for AGIs $50k-75k, 135.4% for AGIs $75k-100k, 607.6% for AGIs $100k-200k, 6936.7% for AGIs over 200k)
Profit/loss from business: +$7,821 (reported on 12.4% of returns)
Here:
+$7,821
State:
+$13,744
(% of AGI for various income ranges: 67.5% for AGIs below $25k, 90.3% for AGIs $25k-50k, 117.0% for AGIs $50k-75k, 260.7% for AGIs $75k-100k, 471.3% for AGIs $100k-200k, 3376.7% for AGIs over 200k)
Taxable individual retirement arrangement distribution: $15,444 (reported on 7.2% of returns)
45239:
$15,444
Ohio:
$18,876
(% of AGI for various income ranges: 45.8% for AGIs below $25k, 61.3% for AGIs $25k-50k, 141.1% for AGIs $50k-75k, 412.4% for AGIs $75k-100k, 859.7% for AGIs $100k-200k, 3520.0% for AGIs over 200k)
Self-employed (Keogh) retirement plans: $16,800 (reported on 0.1% of returns)
45239:
$16,800
Ohio:
$24,898
(% of AGI for various income ranges: 20.5% for AGIs $50k-75k)
Total itemized deductions: $24,998 (reported on 3.0% of returns)
Here:
$24,998
State:
$33,869
(% of AGI for various income ranges: 21.5% for AGIs below $25k, 44.1% for AGIs $25k-50k, 175.9% for AGIs $50k-75k, 213.0% for AGIs $75k-100k, 618.5% for AGIs $100k-200k)
Charity contributions: $8,119 (reported on 2.1% of returns)
Here:
$8,119
State:
$14,577
(% of AGI for various income ranges: 2.3% for AGIs below $25k, 6.4% for AGIs $25k-50k, 36.5% for AGIs $50k-75k, 49.0% for AGIs $75k-100k, 190.5% for AGIs $100k-200k)
Taxes paid: $5,598 (reported on 3.0% of returns)
45239:
$5,598
State:
$7,681
(% of AGI for various income ranges: 2.2% for AGIs below $25k, 6.7% for AGIs $25k-50k, 32.3% for AGIs $50k-75k, 63.0% for AGIs $75k-100k, 173.1% for AGIs $100k-200k)
Earned income credit: $2,470 (reported on 21.5% of returns)
Here:
$2,470
State:
$2,304
(% of AGI for various income ranges: 119.1% for AGIs below $25k, 80.2% for AGIs $25k-50k, 1.6% for AGIs $50k-75k)
Percentage of individuals using paid preparers for their 2020 taxes: 93.0%
Here:
93%
State:
94%
(% for various income ranges: 92.5% for AGIs below $25k, 93.8% for AGIs $25k-50k, 92.7% for AGIs $50k-75k, 91.9% for AGIs $75k-100k, 92.5% for AGIs $100k-200k, 100.0% for AGIs over 200k)
Averages for the 2012 tax year for zip code 45239, filed in 2013:
Average Adjusted Gross Income (AGI) in 2012: $39,704 (Individual Income Tax Returns)
Here:
$39,704
State:
$54,926
Salary/wage: $36,270 (reported on 86.1% of returns)
Here:
$36,270
State:
$45,869
(% of AGI for various income ranges: 77.1% for AGIs below $25k, 83.4% for AGIs $25k-50k, 81.1% for AGIs $50k-75k, 79.4% for AGIs $75k-100k, 77.2% for AGIs $100k-200k, 43.9% for AGIs over 200k)
Taxable interest for individuals: $791 (reported on 23.7% of returns)
This zip code:
$791
Ohio:
$1,297
(% of AGI for various income ranges: 0.7% for AGIs below $25k, 0.3% for AGIs $25k-50k, 0.5% for AGIs $50k-75k, 0.5% for AGIs $75k-100k, 0.5% for AGIs $100k-200k, 0.4% for AGIs over 200k)
Ordinary dividends: $3,952 (reported on 19.0% of returns)
Here:
$3,952
State:
$5,821
(% of AGI for various income ranges: 1.2% for AGIs below $25k, 1.1% for AGIs $25k-50k, 1.6% for AGIs $50k-75k, 1.7% for AGIs $75k-100k, 2.9% for AGIs $100k-200k, 7.4% for AGIs over 200k)
Net capital gain/loss in AGI: +$3,274 (reported on 10.6% of returns)
Here:
+$3,274
State:
+$11,232
(% of AGI for various income ranges: 0.1% for AGIs below $25k, 0.2% for AGIs $25k-50k, 0.3% for AGIs $50k-75k, 0.7% for AGIs $75k-100k, 1.3% for AGIs $100k-200k, 9.6% for AGIs over 200k)
Profit/loss from business: +$8,820 (reported on 10.9% of returns)
Here:
+$8,820
State:
+$12,773
(% of AGI for various income ranges: 7.1% for AGIs below $25k, 1.9% for AGIs $25k-50k, 1.4% for AGIs $50k-75k, 1.4% for AGIs $75k-100k, 2.4% for AGIs $100k-200k)
Taxable individual retirement arrangement distribution: $12,964 (reported on 9.8% of returns)
45239:
$12,964
Ohio:
$14,511
(% of AGI for various income ranges: 3.1% for AGIs below $25k, 2.0% for AGIs $25k-50k, 2.7% for AGIs $50k-75k, 3.2% for AGIs $75k-100k, 4.3% for AGIs $100k-200k, 9.7% for AGIs over 200k)
Self-employment retirement plans: $8,000 (reported on 0.2% of returns)
45239:
$8,000
Ohio:
$20,257
(% of AGI for various income ranges: 0.3% for AGIs $75k-100k)
Total itemized deductions: $15,310 (21% of AGI, reported on 24.3% of returns)
Here:
$15,310
State:
$21,278
Here:
21.2% of AGI
State:
18.8% of AGI
(% of AGI for various income ranges: 5.3% for AGIs below $25k, 7.5% for AGIs $25k-50k, 10.2% for AGIs $50k-75k, 11.2% for AGIs $75k-100k, 12.8% for AGIs $100k-200k, 8.7% for AGIs over 200k)
Charity contributions: $2,603 (reported on 18.7% of returns)
Here:
$2,603
State:
$3,943
(% of AGI for various income ranges: 0.4% for AGIs below $25k, 0.8% for AGIs $25k-50k, 1.2% for AGIs $50k-75k, 1.5% for AGIs $75k-100k, 2.1% for AGIs $100k-200k, 1.7% for AGIs over 200k)
Taxes paid: $5,465 (reported on 24.3% of returns)
45239:
$5,465
State:
$9,568
(% of AGI for various income ranges: 0.9% for AGIs below $25k, 2.1% for AGIs $25k-50k, 3.5% for AGIs $50k-75k, 4.4% for AGIs $75k-100k, 5.5% for AGIs $100k-200k, 5.1% for AGIs over 200k)
Earned income credit: $2,408 (reported on 23.1% of returns)
Here:
$2,408
State:
$2,285
(% of AGI for various income ranges: 7.9% for AGIs below $25k, 1.2% for AGIs $25k-50k)
Percentage of individuals using paid preparers for their 2012 taxes: 42.7%
Here:
43%
State:
51%
(% for various income ranges: 39.5% for AGIs below $25k, 43.9% for AGIs $25k-50k, 46.0% for AGIs $50k-75k, 46.7% for AGIs $75k-100k, 44.2% for AGIs $100k-200k, 75.0% for AGIs over 200k)
Averages for the 2004 tax year for zip code 45239, filed in 2005:
Average Adjusted Gross Income (AGI) in 2004: $36,261 (Individual Income Tax Returns)
Here:
$36,261
State:
$44,480
Salary/wage: $33,913 (reported on 86.1% of returns)
Here:
$33,913
State:
$39,198
(% of AGI for various income ranges: 86.6% for AGIs below $10k, 77.3% for AGIs $10k-25k, 84.0% for AGIs $25k-50k, 83.3% for AGIs $50k-75k, 82.0% for AGIs $75k-100k, 67.8% for AGIs over 100k)
Taxable interest for individuals: $1,185 (reported on 39.2% of returns)
This zip code:
$1,185
Ohio:
$1,532
(% of AGI for various income ranges: 3.2% for AGIs below $10k, 2.2% for AGIs $10k-25k, 1.0% for AGIs $25k-50k, 1.0% for AGIs $50k-75k, 1.0% for AGIs $75k-100k, 1.6% for AGIs over 100k)
Taxable dividends: $2,939 (reported on 25.3% of returns)
Here:
$2,939
State:
$3,496
(% of AGI for various income ranges: 2.7% for AGIs below $10k, 2.1% for AGIs $10k-25k, 1.3% for AGIs $25k-50k, 1.5% for AGIs $50k-75k, 2.3% for AGIs $75k-100k, 4.2% for AGIs over 100k)
Net capital gain/loss: +$2,907 (reported on 15.5% of returns)
Here:
+$2,907
State:
+$8,582
(% of AGI for various income ranges: -1.3% for AGIs below $10k, 0.3% for AGIs $10k-25k, 0.4% for AGIs $25k-50k, 0.7% for AGIs $50k-75k, 1.4% for AGIs $75k-100k, 5.3% for AGIs over 100k)
Profit/loss from business: +$8,741 (reported on 10.1% of returns)
Here:
+$8,741
State:
+$10,813
(% of AGI for various income ranges: 3.7% for AGIs below $10k, 3.9% for AGIs $10k-25k, 1.8% for AGIs $25k-50k, 2.0% for AGIs $50k-75k, 1.7% for AGIs $75k-100k, 4.0% for AGIs over 100k)
IRA payment deduction: $2,342 (reported on 2.2% of returns)
45239:
$2,342
Ohio:
$2,794
(% of AGI for various income ranges: 0.2% for AGIs below $10k, 0.2% for AGIs $10k-25k, 0.2% for AGIs $25k-50k, 0.1% for AGIs $50k-75k, 0.1% for AGIs $75k-100k, 0.1% for AGIs over 100k)
Self-employed pension: $7,114 (reported on 0.3% of returns)
Here:
$7,114
Ohio:
$13,981
(% of AGI for various income ranges: 0.0% for AGIs $10k-25k, 0.1% for AGIs $50k-75k, 0.3% for AGIs over 100k)
Total itemized deductions: $13,350 (22% of AGI, reported on 33.4% of returns)
Here:
$13,350
State:
$17,503
Here:
22.4% of AGI
State:
20.8% of AGI
(% of AGI for various income ranges: 8.6% for AGIs below $10k, 6.9% for AGIs $10k-25k, 11.3% for AGIs $25k-50k, 13.6% for AGIs $50k-75k, 15.2% for AGIs $75k-100k, 14.6% for AGIs over 100k)
Charity contributions deductions: $2,094 (3% of AGI, reported on 28.0% of returns)
Here:
$2,094
State:
$3,087
Here:
3.4% of AGI
State:
3.4% of AGI
(% of AGI for various income ranges: 0.5% for AGIs below $10k, 0.8% for AGIs $10k-25k, 1.3% for AGIs $25k-50k, 1.7% for AGIs $50k-75k, 2.3% for AGIs $75k-100k, 2.5% for AGIs over 100k)
Total tax: $4,180 (reported on 75.8% of returns)
45239:
$4,180
State:
$6,781
(% of AGI for various income ranges: 2.0% for AGIs below $10k, 4.1% for AGIs $10k-25k, 7.2% for AGIs $25k-50k, 9.0% for AGIs $50k-75k, 10.3% for AGIs $75k-100k, 15.4% for AGIs over 100k)
Earned income credit: $1,786 (reported on 16.4% of returns)
Here:
$1,786
State:
$1,696
Percentage of individuals using paid preparers for their 2004 taxes: 49.1%
Here:
49%
State:
55%
(% for various income ranges: 41.6% for AGIs below $10k, 53.7% for AGIs $10k-25k, 51.4% for AGIs $25k-50k, 46.7% for AGIs $50k-75k, 44.8% for AGIs $75k-100k, 51.0% for AGIs over 100k)
Likely homosexual households (counted as self-reported same-sex unmarried-partner households)
Lesbian couples: 0.2% of all households
Gay men: 0.0% of all households
Household received Food Stamps/SNAP in the past 12 months: 1,680 Household did not receive Food Stamps/SNAP in the past 12 months: 10,485
Women who had a birth in the past 12 months: 365 (342 now married, 29 unmarried) Women who did not have a birth in the past 12 months: 6,725 (1,901 now married, 4,827 unmarried)
Housing units in zip code 45239 with a mortgage: 5,190 (411 second mortgage, 350 both second mortgage and home equity loan) Houses without a mortgage: 256
Median monthly owner costs for units with a mortgage: $1,185 Median monthly owner costs for units without a mortgage: $527
Residents with income below the poverty level in 2022:
This zip code:
13.1%
Whole state:
13.4%
Residents with income below 50% of the poverty level in 2022:
This zip code:
6.7%
Whole state:
7.0%
Median number of rooms in houses and condos:
Here:
6.3
State:
6.7
Median number of rooms in apartments:
Here:
4.3
State:
4.4
Notable locations in this zip code not listed on our city pages
Notable locations in zip code 45239: Clovernook Country Club (A), Community Ambulance Service (B), North College Hill City Hall (C), Saint Josephs Orphanage (D), Colerain Township Department of Fire and Emergency Medical Services Station 26 (E), Siller Professional Building (F), North College Hill Police Department (G), North College Hill Fire Department (H). Display/hide their locations on the map
Shopping Centers: Colerain Hills Shopping Center (1), Monfort Heights Shopping Center (2), White Oak Shopping Center (3). Display/hide their locations on the map
Churches in zip code 45239 include: Mount Airy United Methodist Church (A), Mount Airy Church of God (B), Hope Church (C), Saint Paul United Church of Christ (D), Saint Ann Catholic Church (E), North College Hill United Methodist Church (F), Lincoln Park Baptist Church (G), Garden Park Unity Church (H), First Hilltop Baptist Church (I). Display/hide their locations on the map
2,956 married couples with children.
2,481 single-parent households (634 men, 1,847 women).
89.2% of residents of 45239 zip code speak English at home.
2.7% of residents speak Spanish at home (67% very well, 17% well, 4% not well, 11% not at all).
5.3% of residents speak other Indo-European language at home (48% very well, 24% well, 22% not well, 6% not at all).
0.5% of residents speak Asian or Pacific Island language at home (100% very well).
2.2% of residents speak other language at home (68% very well, 17% well, 12% not well, 3% not at all).
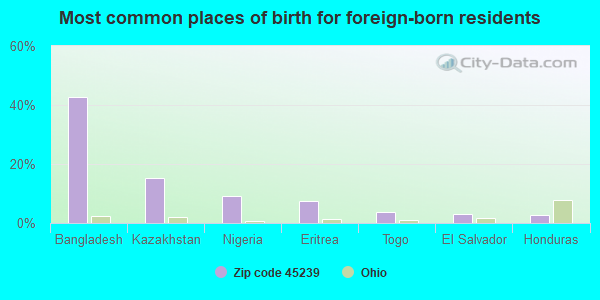
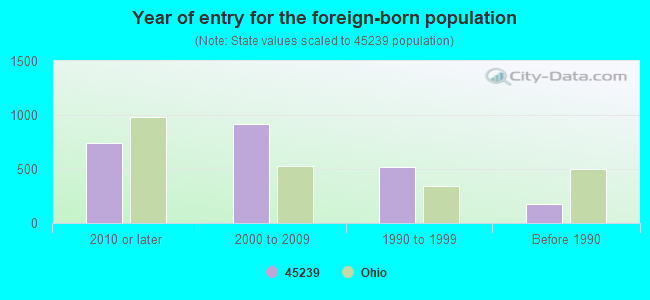
Foreign born population: 2,169 (7.4%) (69.6% of them are naturalized citizens)
This zip code:
7.4%
Whole state:
5.0%
43%Bangladesh
15%Kazakhstan
9%Nigeria
7%Eritrea
4%Togo
3%El Salvador
3%Honduras
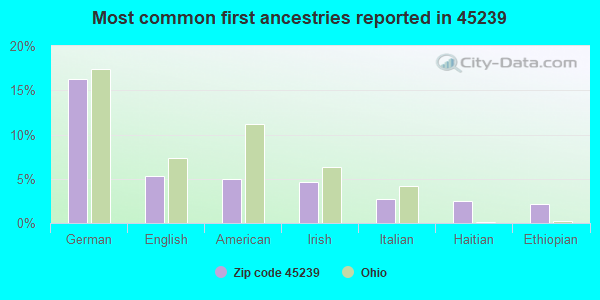
16%German
5%English
5%American
5%Irish
3%Italian
3%Haitian
2%Ethiopian
Year of entry for the foreign-born population
7392010 or later
9202000 to 2009
5201990 to 1999
180Before 1990
Facilities with environmental interests located in this zip code:
BOB TOWNSEND FORD (8571 COLERAIN AVE in CINCINNATI, OH)
STATE MASTER (Ohio general info) - RCRA-OHD017612524, HAZARDOUS WASTE PROGRAM Conditionally Exempt Small Quantity Generators, less than 100 kg/month of hazardous waste (Resource Conservation and Recovery Act (tracking hazardous waste)) - notification Organizations: REPUBLIC INDUSTRIES (CONTACT/OWNER)
, REPUBLIC SERVICES INC (CONTACT/OWNER)
1ST STOP CLARK #55 (7434 COLERAIN AVE in CINCINNATI, OH)
STATE MASTER (Ohio general info) - AIR MAJOR, EPCRA, RCRA-OHD987051612, HAZARDOUS WASTE PROGRAM Small Quantity Generators, between 100 kg and 1000 kg of hazardous waste/month (Resource Conservation and Recovery Act (tracking hazardous waste)) - notification Organizations: CLARK OIL AND REFINING CORPORA (CONTACT/OWNER)
, CLARK OIL AND REFINING CORP (CONTACT/OWNER)
Alternative names: CLARK SUPER 100
BLUST MOTOR SERVICE INC (3254 MCGILL LN in CINCINNATI, OH)
STATE MASTER (Ohio general info) - AIR MAJOR Small Quantity Generators, between 100 kg and 1000 kg of hazardous waste/month (Resource Conservation and Recovery Act (tracking hazardous waste)) - notification Organizations: BLUST OLLIE (CONTACT/OWNER)
BP OIL CO NO 08778 (8195 COLERAIN AVE in CINCINNATI, OH)
STATE MASTER (Ohio general info) - AIR MAJOR, -31-5541-1038-6, EPCRA, RCRA-OHD987028743, HAZARDOUS WASTE PROGRAM Conditionally Exempt Small Quantity Generators, less than 100 kg/month of hazardous waste (Resource Conservation and Recovery Act (tracking hazardous waste)) - notification Organizations: BP OIL COMPANY (CONTACT/OWNER)
Alternative names: BP OIL CO SITE 08778
BP OIL NO 09105 (5233 N BEND RD in CINCINNATI, OH)
STATE MASTER (Ohio general info) - AIR MAJOR, -315541-1038-CC, EPCRA, RCRA-OHD987028412, HAZARDOUS WASTE PROGRAM Conditionally Exempt Small Quantity Generators, less than 100 kg/month of hazardous waste (Resource Conservation and Recovery Act (tracking hazardous waste)) - notification Organizations: BP OIL CO (CONTACT/OWNER)
, BP OIL COMPANY (CONTACT/OWNER)
Alternative names: BP OIL CO SITE 09105
BD OF CNTY CMMSNRS COLERAIN WTF (4001 SPRINGDALE ROAD in CINCINNATI, OH)
(Resource Conservation and Recovery Act (tracking hazardous waste))
BP OIL CO SITE 09155 (6960 COLERAIN in CINCINNATI, OH)
(Resource Conservation and Recovery Act (tracking hazardous waste)) Organizations: BP OIL COMPANY (CONTACT/OWNER)
Housing units lacking complete plumbing facilities: 0.8% Housing units lacking complete kitchen facilities: 1.0%
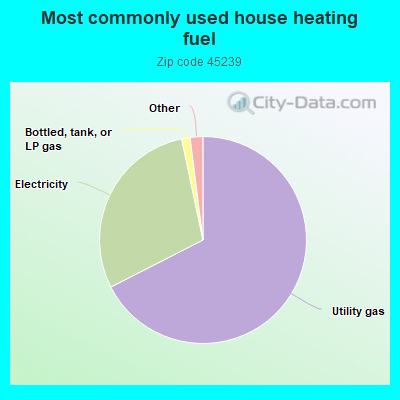
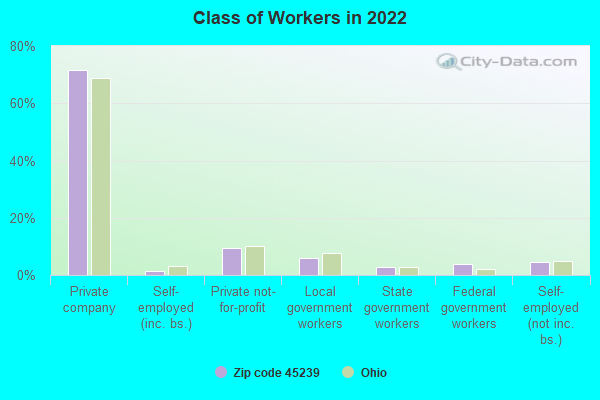
67.5%Utility gas
29.2%Electricity
1.3%Bottled, tank, or LP gas
1.0%Wood
0.7%No fuel used
Population in 1990: 27,024. Population change in the 1990s: +1,984 (+7.3%).
Place of birth for U.S.-born residents:
This state: 22,363
Northeast: 407
Midwest: 1,173
South: 2,780
West: 336
59% of the 45239 zip code residents lived in the same house 5 years ago. Out of people who lived in different houses, 79% lived in this county. Out of people who lived in different counties, 50% lived in Ohio.
91% of the 45239 zip code residents lived in the same house 1 year ago. Out of people who lived in different houses, 69% moved from this county. Out of people who lived in different houses, 15% moved from different county within same state. Out of people who lived in different houses, 10% moved from different state. Out of people who lived in different houses, 5% moved from abroad.
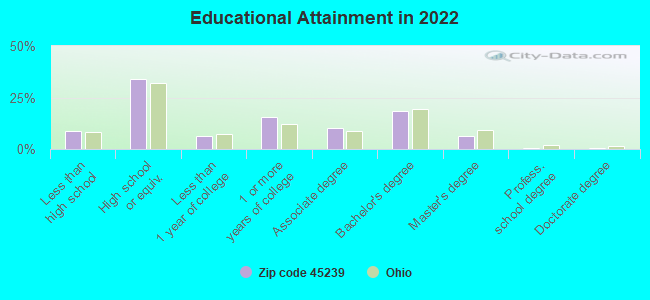
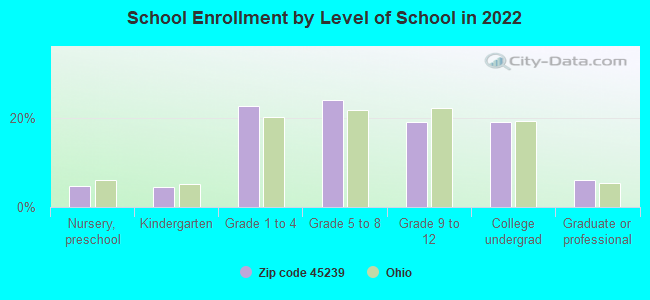
Private vs. public school enrollment:
Students in private schools in grades 1 to 8 (elementary and middle school): 805
Here:
21.8%
Ohio:
16.0%
Students in private schools in grades 9 to 12 (high school): 368
Here:
24.3%
Ohio:
13.1%
Students in private undergraduate colleges: 264
Here:
17.6%
Ohio:
22.3%
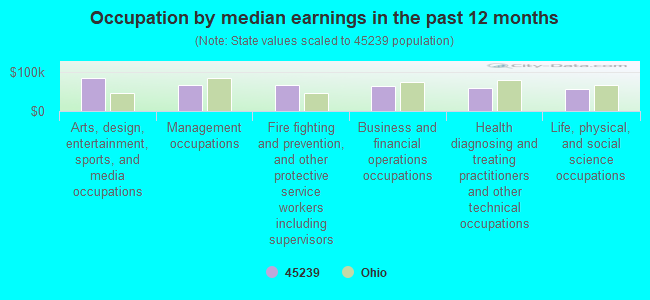
Occupation by median earnings in the past 12 months ($)
85,604Arts, design, entertainment, sports, and media occupations
66,413Management occupations
65,667Fire fighting and prevention, and other protective service workers including supervisors
63,441Business and financial operations occupations
59,766Health diagnosing and treating practitioners and other technical occupations
57,733Life, physical, and social science occupations
Companies with federal contracts located in this zip code:
GIESTING & ASSOCIATES INC (2854 BLUE ROCK RD in CINCINNATI, OH; small business) : $2,051,414 in 117 contractsfrom 2000 to 2006
Contracts for Winches, Hoists, Cranes, and Derricks, Optoelectronic Devices and Associated Hardware, Ballasts, Lampholders, and Starters, Connectors, Electrical, and moreby Navy, Defense Logistics Agency, Army Signed by year:2000: $227,050; 2001: $140,296; 2002: $250,728; 2003: $76,344; 2004: $271,753; 2005: $691,955; 2006: $393,288.
Biggest contracts:
$178,141 with Navy for Winches, Hoists, Cranes, and Derricks. Signed on 2005-07-11. Completion date: 2006-05-31.
$154,906, same as above.Signed on 2005-03-04. Completion date: 2005-04-04.
$154,906, same as above.Signed on 2004-08-05. Completion date: 2004-08-06.
$97,900 with Defense Logistics Agency for Optoelectronic Devices and Associated Hardware. Signed on 2002-02-19. Completion date: 2002-05-20.
NOLTE PRECISE MANUFACTURING, I (6850 COLERAIN AVE in CINCINNATI, OH; small business)
$4,443 with Defense Logistics Agency for Hardware, Commercial. Signed on 2005-10-26. Completion date: 2005-12-11.
Top industries in this zip code by the number of employees in 2005:
Health Care and Social Assistance: General Medical and Surgical Hospitals (500-999 employees: 1 establishment)
2002 - 2018 National Fire Incident Reporting System (NFIRS) incidents
According to the data from the years 2002 - 2018 the average number of fire incidents per year is 107. The highest number of fires - 169 took place in 2015, and the least - 50 in 2002. The data has a growing trend.
When looking into fire subcategories, the most incidents belonged to: Structure Fires (58.9%), and Outside Fires (25.5%).
Fire incident types reported to NFIRS in Zip Code 45239
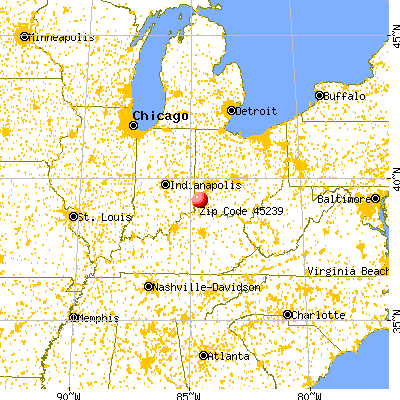


 Nearest zip codes: 45223, 45224, 45211, 45231, 45225, 45232.


 According to the data from the years 2002 - 2018 the average number of fire incidents per year is 107. The highest number of fires - 169 took place in 2015, and the least - 50 in 2002. The data has a growing trend.
 When looking into fire subcategories, the most incidents belonged to: Structure Fires (58.9%), and Outside Fires (25.5%).